| |
|
 |
Till the end of 2006, Ningbo city totally holds 249,300 individual industrial and commercial units and 482,600 employees; and meanwhile there are also 83,200 private enterprises and 180,400 investors in Ningbo. In 2006, for the whole Ningbo city, total production values from both individually-owned enterprise and private enterprises realized RMB 227.068 billion, accounting for about 80% of GDP in Ningbo.
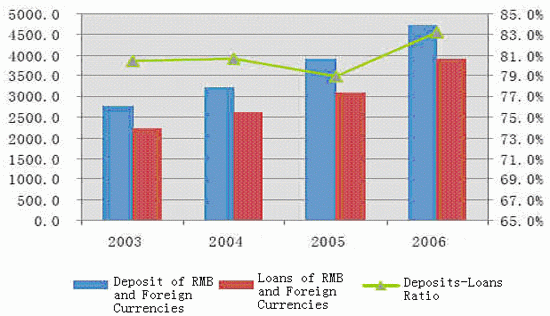
Till the end of 2006, total deposit balances of RMB and foreign currencies in Ningbo banking financial institutions have realized RMB 470.05 billion, up by 20.03% year-on-year. Furthermore, total loan balances of RMB and foreign currencies have reached RMB 391 billion, up by 26.56% year-on-year. Besides, paper profits of Ningbo banking financial institutions has realized RMB 9.359 billion, up by 37.34% year-on-year; non-performing loans balances reached RMB 7.723 billion at the end of 2006, down by 1.025 billion compared with that at the beginning of 2006; and non-performing loan ratio was 1.98%, down by 0.87 percentage points compared with that at the beginning of 2006.
Till the year of 2006, Bank of Ningbo has kept crediting business relations with more than 3,986 companies, of which medium & small-scale enterprise clients accounted for 94.8%, and private enterprise clients accounted for 78.78%.
In 2006, operating profits of individual business in Bank of Ningbo reached RMB 156 million up by 1256% over 2004, accounting for 18.6% of total operating profits.
Credit Status in Ningbo City, 2003-2006

Type Distribution of Loan Enterprises in Bank of Ningbo in 2006

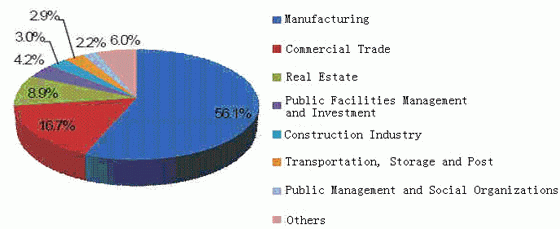
Industry Distribution of Loans Objects in Bank of Ningbo in 2006

|
|
|
|
|
If this report could not still meet your requirement, or
you have any comments or suggestions on it, please leave a
message to us.
|
2005-2008 www.researchinchina.com All Rights Reserved
| |
|
 |
| |
|
Till the end of 2006, Ningbo city totally holds 249,300 individual industrial and commercial units and 482,600 employees; and meanwhile there are also 83,200 private enterprises and 180,400 investors in Ningbo. In 2006, for the whole Ningbo city, total production values from both individually-owned enterprise and private enterprises realized RMB 227.068 billion, accounting for about 80% of GDP in Ningbo.
Till the end of 2006, total deposit balances of RMB and foreign currencies in Ningbo banking financial institutions have realized RMB 470.05 billion, up by 20.03% year-on-year. Furthermore, total loan balances of RMB and foreign currencies have reached RMB 391 billion, up by 26.56% year-on-year. Besides, paper profits of Ningbo banking financial institutions has realized RMB 9.359 billion, up by 37.34% year-on-year; non-performing loans balances reached RMB 7.723 billion at the end of 2006, down by 1.025 billion compared with that at the beginning of 2006; and non-performing loan ratio was 1.98%, down by 0.87 percentage points compared with that at the beginning of 2006.
Till the year of 2006, Bank of Ningbo has kept crediting business relations with more than 3,986 companies, of which medium & small-scale enterprise clients accounted for 94.8%, and private enterprise clients accounted for 78.78%.
In 2006, operating profits of individual business in Bank of Ningbo reached RMB 156 million up by 1256% over 2004, accounting for 18.6% of total operating profits.
Credit Status in Ningbo City, 2003-2006

Type Distribution of Loan Enterprises in Bank of Ningbo in 2006

Industry Distribution of Loans Objects in Bank of Ningbo in 2006

|
|
|
|
|
2005-2006 www.researchinchina.com All Rights Reserved |
|
| |
|
 |
| |
|
1 Company Profile
1.1 Brief Introduction
1.2 Equity Ownership Structure
1.3 Share-holding of Bank of Overseas Chinese2 Economy Development Analysis in Ningbo 3 Business Analysis of Bank of Ningbo
3.1 Medium & Small Enterprises-oriented
3.2 Individual Business 4 Assets Quality Evaluation of Bank of Ningbo 5 Profitability of Bank of Ningbo
5.1 Credit
5.2 Bond Investment
5.3 Intermediary Business 6 Risk Analysis |
|
|
|
|
2005-2008 www.researchinchina.com All Rights Reserved |
|
| |
|
 |
| |
|
GDP and its Growth in Ningbo City, 2002-2006
Credit Status in Ningbo City, 2003-2006
Changes in Market Shares of Bank of Ningbo in Local Deposit and Loan Market, 2004-2006
Type Distribution of Loan Enterprises in Bank of Ningbo in 2006
Loans Application Project Distribution of Bank of Ningbo in 2006
Industry Distribution of Loans Objects in Bank of Ningbo in 2006
Comparison of Loans Placement Proportions of Listed Banks in Manufacturing Industry in 2006
Status and Forecast of Assets Quality of Bank of Ningbo, 2004-2008
Profitability of Bank of Ningbo
Comparison of Deposit/Loan Interest Margin of Listed Banks in 2006 Figure Eleven: Comparison of Return on Bond Investment of Listed Banks in 2006 Figure Twelve: Comparison of Proportions of Net Service Charges and Commission Revenues between Listed Banks in 2006 Table One: Assets and Liabilities of Bank of Ningbo, 2004-2006 Table Two: Profits of Bank of Ningbo, 2004-2006 Table Three: Comparison of Major Indices between Listed Banks in 2006 Table Four: Ranking of China City Commercial Banks Table Five: Equity Ownership Structure before and after Issuance of Bank of Ningbo Table Six: Ranking of Financial Institutions in Ningbo City, by Deposit and Loan of RMB and Foreign Currencies Table Seven: Business Structure of Bank of Ningbo Table Eight: Personal Loans in Bank of Ningbo Table Nine: Non-performing Loan Ratio of Bank of Ningbo
|
2005-2008 www.researchinchina.com All Rights Reserved
|


