| |
|
 |
China's sales revenue of online games market reached CNY10.57 billion, up 61.5% year on year. Of which, CNY6.88 billion were the sales revenue from online games developed independently by Chinese companies, amounting to 65.1% of the national total, a big jump of 65.1% year on year compared to CNY4.24 billion recorded in the previous year. This the third year in a row that sales revenue of China's independently developed online games dominated the local market. However, the market shares of China's top three online games developers, Shanda, Netease and Giant, began to decline, as more and more local companies with independently developed online game products have taken part in the market competition. More online game companies grabbed the market shares from the top three giants by use of the success of only one or two online game products, resulting in a further decline in industry concentration. As of December, 2007, the number of China's online games users has reached 40.17 million, up 23% year on year.
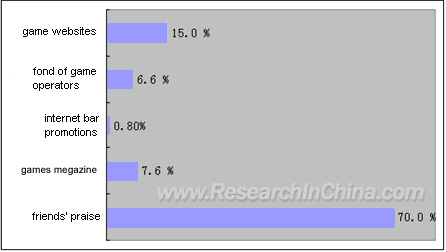
In 2007-2008, ResearchInChina surveyed online game players in Beijing, Shanghai, Tianjin, Wuhan, Harbin and Jinan via online and offline questionnaires and recovered a total of 1,000 valid questionnaires. Based on our investigation, we find the percentage of influence that makes players decide to play which games as follows; friends' praise amounts to 70%, followed by the influence of game websites, online game magazines 7.6%, fond of game operators 6.6% and promotions by internet bars 0.80% only.
Influence Deciding to Play Which New Games

Source: ResearchInChina
Monthly spending of a game player on online games is about CNY140.13 (including internet fee in internet bar but excluding internet fee via computers at home). Monthly spending, ranging CNY0-CNY300, amounts to 89% of the total market. Of which, monthly spending, ranging CNY0-CNY100, takes up 60.40%; that, ranging CNY300-CNY500, 8.8%; that above CNY500 2.2% only. Furthermore, 70.40% of game players believe that their spending on online games in 2007 would be higher than that in the previous year.
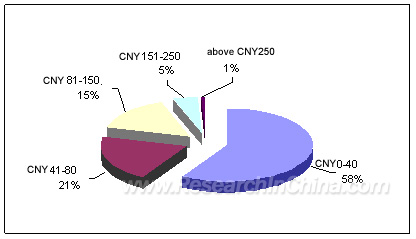
Our survey also shows that the average spending players spend on virtual props is CNY49.77, of which, spending, ranging CNY0-CNY40, takes up 58% of the total; that, ranging CNY41-80, 21%; that, ranging CNY81-150, 15% and that above CNY151, only 6% respectively.
Percentage of Online Game Players' Spending on Virtual Props

Source: ResearchInChina
Free-mode was popularized within this industry in 2006 and it has become a historic turning point. After this revolution, China online game market has had a new round of rapid growth.
|
|
|
|
|
If this report could not still meet your requirement, or
you have any comments or suggestions on it, please leave a
message to us.
|
2005-2008 www.researchinchina.com All Rights Reserved
| |
|
 |
| |
|
China's sales revenue of online games market reached CNY10.57 billion, up 61.5% year on year. Of which, CNY6.88 billion were the sales revenue from online games developed independently by Chinese companies, amounting to 65.1% of the national total, a big jump of 65.1% year on year compared to CNY4.24 billion recorded in the previous year. This the third year in a row that sales revenue of China's independently developed online games dominated the local market. However, the market shares of China's top three online games developers, Shanda, Netease and Giant, began to decline, as more and more local companies with independently developed online game products have taken part in the market competition. More online game companies grabbed the market shares from the top three giants by use of the success of only one or two online game products, resulting in a further decline in industry concentration. As of December, 2007, the number of China's online games users has reached 40.17 million, up 23% year on year.
In 2007-2008, ResearchInChina surveyed online game players in Beijing, Shanghai, Tianjin, Wuhan, Harbin and Jinan via online and offline questionnaires and recovered a total of 1,000 valid questionnaires. Based on our investigation, we find the percentage of influence that makes players decide to play which games as follows; friends' praise amounts to 70%, followed by the influence of game websites, online game magazines 7.6%, fond of game operators 6.6% and promotions by internet bars 0.80% only.
Influence Deciding to Play Which New Games

Source: ResearchInChina
Monthly spending of a game player on online games is about CNY140.13 (including internet fee in internet bar but excluding internet fee via computers at home). Monthly spending, ranging CNY0-CNY300, amounts to 89% of the total market. Of which, monthly spending, ranging CNY0-CNY100, takes up 60.40%; that, ranging CNY300-CNY500, 8.8%; that above CNY500 2.2% only. Furthermore, 70.40% of game players believe that their spending on online games in 2007 would be higher than that in the previous year.
Our survey also shows that the average spending players spend on virtual props is CNY49.77, of which, spending, ranging CNY0-CNY40, takes up 58% of the total; that, ranging CNY41-80, 21%; that, ranging CNY81-150, 15% and that above CNY151, only 6% respectively.
Percentage of Online Game Players' Spending on Virtual Props

Source: ResearchInChina
Free-mode was popularized within this industry in 2006 and it has become a historic turning point. After this revolution, China online game market has had a new round of rapid growth.
|
|
|
|
|
2005-2006 www.researchinchina.com All Rights Reserved |
|
| |
|
 |
| |
|
1. Overview of Online Games
1.1 Definition and Classification
1.1.1 Definition
1.1.2 Classification
1.2 Development Process of Online Games
1.3 Value Chain Structure
1.4 Status quo of overseas online games 2. China Online Games Development
2.1 Main Participants
2.2 Main Business Models
2.3 China Business Models
2.4 Main Overseas Online Game Companies and Products in China
2.5 Main Characteristics of China Online Games
2.6 Contribution to China Internet Industry
2.6.1 Promoting Widely Usage of Multimedia
2.6.2 Promoting Diversification of Operating Models
2.6.3 Improving Awareness of Independent Research and Development 3. Industrial Chain of Online Games
3.1 Introduction
3.2 Development
3.3 Popularization
3.4 Sale
3.4.1 Sales Model and Status Quo
3.4.2 Sales Network
3.4.3 Sales Trend
3.5 Typical Marketing Channel
3.5.1 Distributors
3.5.2 Internet Bars
3.5.3 Regional Operators
3.6 Telecom Operators 4. Games Players Features
4.1 Age Distribution
4.2 Gender Proportion
4. Occupation Distribution
4.4 Time Spending on Games
4.5 Time Structure of Playing Various Kinds of Games
4.6 Distribution of Time and Place in Playing Games
4.7 Online Games Age
4.8 Reasons for Playing New Games
4.9 Reasons for Playing Games in Internet Bar
4.10 Monthly Spending on Games
4.11 Comparison of Spending on Games between 2006 and 2007
4.12 Payment Options for Online Games
4.13 Quantity of Playing Games Simultaneously
4.14 Monthly Spending on Virtual Props
4.15 Trend of Monthly Spending on Virtual Props, 2007
4.16 Source of Spending
4.17 Stand-alone Game Purchased Per Year
4.18 Stand-alone Game Downloaded Per Year
4.19 Types of Games Platform Purchased by Players Per Year
4.20 Quantity of Palm Games Platform Purchased by Players
4.21 Preference Percentage of Games Types
4.22 Electronic Game Console Survey
4.23 Palm Game Console Survey
4.24 Places Intended for Purchasing Palm Games Console
4.25 No Intention to Purchase Games Console
4.26 Computers Possessed by Games Players
4.27 Purchase Intention of Users' without Computers
4.28 Purchase Time of Game Players with Computers
4.29 Re-purchase Time of Game Plays with Computers
4.30 Playing Games on Household Computers
4.31 Game Players to Play LAN Games
4.32 Time and Place Used Mostly by Games Players 5. Entry Conditions and Risks of Online Game Market
5.1 Market Entry Conditions
5.1.1 Games with Strong Competitiveness
5.1.2 Sound Operations Management
5.1.3 Sustained Development Ability
5.1.4 Reliable Revenue
5.2 Market Entry Risks and Avoidance of Risks
5.2.1 Low-quality Game Contents
5.2.2 Public Opinion
5.2.3 Unfair Competition
5.2.4 Short of Follow-up Funds
5.2.5 Impeded Research and Development Capability
5.2.6 Unstable Service Platform
5.2.7 Threat of Overseas Games
5.2.8 Unclear Marketing Mode
5.2.9 Management Risks
5.3 Market Entry Strategies
5.3.1 Strategy and Its Implementation of Network Firms to Enter Online Game Market
5.3.2 Strategies and Its Implementation of Start-up Online Game Companies 6. China Online Games Market Competition
6.1 Market Share and Revenue of Key Companies
6.1.1 Market Share
6.1.2 Revenue
6.2 Main Companies and Products
6.2.1 Shanda Network
6.2.2 Beijing Globallink Computer Technology Co., Ltd
6.2.3 The 9 Computer Technology Consulting(Shanghai)Co., Ltd
6.2.4 Kingsoft
6.2.5 Tencent Holdings Co., Ltd
6.2.6 Netease
6.2.7 Giant
6.2.8 9you
6.2.9 NetDragon Websoft Inc.
6.2.10 Perfect World
6.2.11 Sohu
6.2.12 Beijing Guang Yu-huaxia Sci-Tech Co., Ltd
6.2.13 www.china.com
6.2.14 T2CN Information Technology (Shanghai) Co., Ltd
6.2.15 Century's Success Information Technology Co., Ltd 7. Development Trend of China Online Games Market |
|
|
|
|
2005-2008 www.researchinchina.com All Rights Reserved |
|
| |
|
 |
| |
|
Development Stage of China Online games Market
Value Chain of Online games Industry
Industrial Chain of Agent Online games
List of Some Online games Entering China Market
Four Channel Patterns
User's Attitude towards Internet Bar
Age Distribution of Game Players
Gender Proportion of Game Players
Vocational Distribution of Games Players
Hours Spending on Games Weekly
Time Structure of Playing Games
Time Structure of Games-Playing Place
Time Structure of Playing Games
Reasons for Playing New Games
Reasons for Playing Games in Internet Bar
Expense on Games Per Month
Monthly Expense of Players on Games, 2006-2007
Payment Options for Online Games
Quantity and Types of Playing Games Simultaneously
Game Players'Expenses Percentage on Virtual Property
Revenues of Main Online games Companies, 2007
China Online games Market Scale, 2003-2011
Operation of Kingsoft Online Games, 2006-2007
Online players of Tencent and the percentage, 2007
Giant Games Revenue over Years
Sohu Games Revenue over Years
China Website Games Revenue over Years
Tencent Games Revenue over Years
The 9 Computer Games Revenue over Years
Shanda Games Revenue over Years
|
2005-2008 www.researchinchina.com All Rights Reserved
|


