Global and China Tire Industry Report, 2013-2014
-
Apr./2014
- Hard Copy
- USD
$2,800
-
- Pages:160
- Single User License
(PDF Unprintable)
- USD
$2,600
-
- Code:
ZYW170
- Enterprise-wide License
(PDF Printable & Editable)
- USD
$4,050
-
- Hard Copy + Single User License
- USD
$3,000
-
Global and China Tire Industry Report, 2013-2014 highlights:
1. Global automobile industry and market analysis;
2. China automobile industry and market analysis;
3. American, Indian and Chinese Tire industry and market analysis;
4. Leading 27 tire vendors worldwide
2013 and 2014 marked bumper years for the tire industry. On the one hand, the raw material prices in the upstream remained falling; on the other hand, both the European and American markets resuscitated in a moderate manner, leading to an increasing demand from downstream. Take natural rubber, as a kind of raw material in the upstream, for example, the prices continued slipping, down from USD4,616/ton in 2011Q4 to USD2,574/ton in 2013Q4 in the international market. As the same case in Chinese market, the natural rubber price slumped from RMB21, 500/ton in Oct.2013 to RMB14, 380/ton by Mar.2013, a sharp drop of 33%. It is estimated that the price of natural rubber will maintain at a low level or even will see a slight decline in the second half of 2014.
In 2013, the tire demand appeared to be robust due to the steady recovery of European and American Economy. In 2013, on the global basis, the OE tire and RT (Replacement) tire demand for PLT (Passenger and Light Truck) use both grew by 3%, for CV (Commercial Vehicle) use increased by 6% and 5%, separately.
In Europe, the OE tire for PLT use rose by 1% and RT tire demand kept flat, the figure for CV use witnessed growth of 4% and 8%, respectively.
In North America, the OE tire and RT tire demand for PLT use both jumped by 5%, while for CV use fell by 7% and 2%, separately.
In Asia, the OE tire and RT tire demand for PLT use shot up by 5% and 6%, and for CV use went up by 12% and 5%, respectively.
In South America, the tire demand for CV use presented strong rebound, OE and RT shot up by 30% and 10%, respectively.
As for Africa-India-Middle East market, the OE tire demand for PLT use dropped by 6% , while RT went up by 4%; the OE tire for CV use glided by 13%, while RT climbed by 8%.
According to the statistics conducted by China Rubber Industry Association Tire Branch, the profit of 46 industrial players surveyed rose by 12.3% to a record high of RMB10.07 billion. China exports a matter of one third of its tire products, and mostly to the US. In 2013, the US imported 51.2 million tires from China, up 57.5%, the record growth in the past 7 years. In 2012, the import volume, for the US, grew by 25% to 32.5 million units; in 2011, the figure posted 26 million. During 2013, the import volume of tires for passenger cars, for America, beat a new peak, up by 13.6% year-on-year to 143.7 million. The growth mainly attributed to the import business from following three regions: Chinese mainland (a sharp year-on-year rise of 55.8%), Indonesia (a year-on-year growth of 16.7%) and Taiwan (a year-on-year jump of 22.7%).
Because of substantial benefits of tire vendors, their enthusiasm for investment in the tire business was boosted greatly. When it comes to bidding dynamics in 2014, new projects and new capacities showed no less fever, with the estimated growth in all-steel tire capacity of 15 million units and in semi-steel tire capacity approximating 100 million units. As a result, China is expected to realize full-steel tire capacity 165 million units and semi-steel tire capacity roughly 600 million units by 2014 yearend when will witness further surplus of industrial structure and fiercer industrial competition.
In addition, due to pervasive haze, there have been provinces and municipalities since 2013H2 voicing their willingness to carry out national Ⅳ emission standard. It means that heavy-load trucks in line with national Ⅲ emission standard are not allowed to be sold. In comparison, heavy-load trucks in line with national Ⅳ emission standard are tens of thousands of higher in price than the equivalents in line with national Ⅲ emission standard. Coupled with unsmooth supply of diesel, many consumers in advance bought vehicles in line with national Ⅲ emission standard. Overdraft, stocking up and consumption in advance are, as ever, commonplace, which in part contributed to a steep year-on-year rise in sales volume between the full 2013 year and the first two months of 2014. Furthermore, the investment in fixed assets in March and April failed to witness sharp upward mobility, albeit the two marked peak season. With the addition of previous “overdraft”, the heavy-duty truck market in 2014H2 is likely to demonstrate poor performance, and the all-steel radial tire market is expected to embrace oversupply.
1.Global Automobile Industry
2. Global Automobile Market
3. China Automobile Market
3.1. Overview of China Automobile Market
3.2. Analysis on China Automobile Industry
4. Global Tire Market
4.1. Market Scale
4.2. Market Structure by Region
4.3. Ranking of Global Tire Vendors
4.4. US Tire Market
4.4.1. Market Scale
4.4.2 Ranking of Tire Dealers
4.4.3. Market Occupancy of Main Tire Vendors
4.4.4. Market Occupancy of Main OTR Vendors
4.5. Tire Market in India
4.5.1. Automobile Market
4.5.2. Tire Market and Industry
4.5.3. Market Occupancy of Auto Tire Vendors
4.6 China Tire Market and Industry
4.6.1 Market Scale
4.6.2. Industry Scale
4.6.3. Status Quo
4.6.4. Tire Export
4.6.5. All-Steel Radial Tire Industry
4.6.6. Market Occupancy of Main Tire Vendors
4.6.7. Revenue, Output and Profit of Top 10 Tire Vendors
4.6.8. Analysis on Overseas Investment of China Auto Tire Industry
5. Leading Tire Vendors Worldwide
5.1. Michelin
5.2. Bridgestone
5.3. Goodyear
5.4. Continental
5.5. Sumitomo Rubber Group
5.6. Pirelli
5.7. Yokohama Rubber
5.8. Hankook
5.9. Cooper
5.10. Kumho Tire
5.11. Toyo Tire &Rubber
5.12. Apollo Tyres
5.13. MRF
5.14. Nokian
5.15. Cheng Shin Tire
5.16. Hangzhou Zhongce Rubber
5.17. Triangle Tire
5.18. Linglong Tire
5.19. Aeolus Tire
5.20. Double Coin
5.21. Guizhou Tire
5.22. Qingdao Double Star
5.24. Xingyuan
5.25. Sailun Group
5.26. Giti Tire
5.27. Shengtai
Automobile Sales Volume Worldwide by Brand, 2010-2013
Global Light Vehicle Output, 2011-2014
Global Heavy Vehicle Output, 2011-2014
Automobile Output in China, 2001-2013
Year-on-Year Growth in Annual Auto Output in China by Type, 2008-2013
Sales Volume of Major Automakers in China, 2013
Sales Volume of Local Automakers in China, 2013
Global Tire Market Scale, 2006-2015
Global Tire Market Structure by Type, 2008-2010
Global Auto Tire Shipment, 2011-2012
PLT Tire Output Worldwide by Region, 2012
PLT Tire Demand Worldwide by Region, 2012
PLT-use RT Tire Shipment by Region, 2011-2012
CV-use RT Tire Shipment by Region, 2011-2012
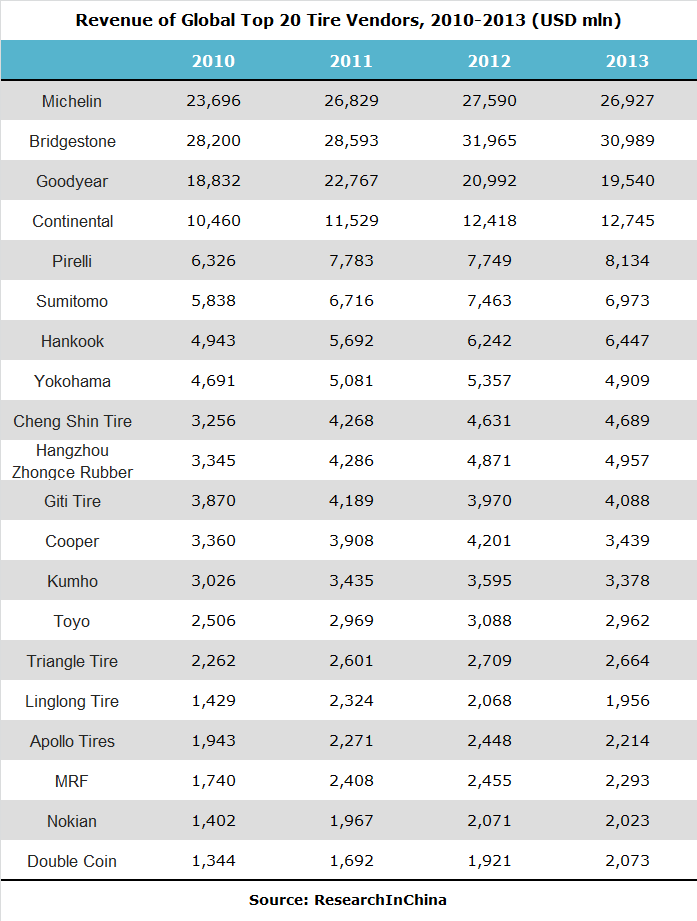
Revenue of Top 20 Tire Companies Worldwide, 2010-2013
Operating Margin of Top 20 Tire Companies Worldwide, 2011-2013
US Tire Sales Volume by Channel, 2011
Shipment of OE and Replacement Tire for PLT in America, 2004-2013
Shipment of OE and Replacement Tire for Light-Truck in America, 2004-2013
Shipment of OE and Replacement Tire for Medium-Truck in America, 2004-2013
Market Share of Major OTR Bias Tire Vendors in America, 2010-2011
Market Share of Major OTR Radial Tire Vendors in America, 2010-2011
Tire Market Downstream Distribution in India, 2010-2013
Major Tire Projects Completed/Scheduled for Completion in India, 2010-2013
Market Share of Major Passenger Car Tire Vendors in India, 2012
Market Share of Major Light-Duty Commercial Vehicle Tire Companies in India, 2012
Market Share of Major Truck Tire Companies in India, 2012
China Automobile Tire Market Size, 2005-2014
Automobile OE and Replacement Tire Market Size of China, 2005-2014
China Automobile Tire Output, 2003-2012
Radial Tire Proportion in Auto Tire of China, 2003-2012
Radial Tire Output in China, 2005-2012
China Automobile Tire Output by Region, 2013
Export Volume of Auto Tire in China, 2005-2012
Export Value of Auto Tire in China, 2005-2012
All-Steel Radial Tire Output in China, 2005-2012
Market Share of Leading Sedan OE Tire Companies in China, 2010
Market Share of Leading Sedan OE Tire Companies in China, 2011
Market Share of Leading Sedan OE Tire Companies in China, 2012
Market Share of Leading Sedan OE Tire Companies in China,, 2013
Market Share of Leading Cross Passenger Car Tire Companies in China, 2013
Market Share of Leading Heavy-Duty Vehicle Tire Companies in China, 2013
Ranking of Top 10 Chinese Tire Companies by Sales and Total Profit, 2007
Output of Top 10 Chinese Tire Companies, 2008-2010
Profit of Top 10 Chinese Tire Companies, 2008-2010
Revenue and Operating Margin of Michelin, 2004-2013
Operating Profit of Michelin, 2012-2013
YoY change in Unit Gross Margin Components of Michelin, 2013
Revenue of Michelin by Region, 2008-2012
Tire Shipment of Michelin by Size, 2012
Tire Shipment of Michelin by Size, 2013
Operating Expenses of Michelin, 2012
Michelin Tonnes per Employee, 2006-2013
Michelin Capital Expenditure and Depreciation, 2011-2017
Quarterly Volumes and Price-mix of Michelin, 2012Q1-2013Q4
Revenue of Michelin by Division, 2009-2013
Operating Margin of Michelin by Division, 2009-2013
Application of Michelin Tire in Auto Models made in China
Revenue and Operating Margin of Bridgestone, 2007-2014
Revenue of Bridgestone by Region, 2004-2013
Operating Profit of Bridgestone, 2013
Operating Profit of Bridgestone, 2014
Global Distribution of Plants under Bridgestone, 2011
Global Distribution of Plants under Bridgestone, Apr.2013
Distribution of Bridgestone in China
Revenue and Operating Margin of Goodyear, 2004-2013
Sales Volume of Goodyear, 2007-2013
Revenue of Goodyear by Business, 2013
Revenue of Goodyear by Region, 2008-2013
Operating Margin of Goodyear by Region, 2008-2013
Replacement Tire Sales Proportion of Goodyear by Region, 2006-2013
Tire Sales Volume of Goodyear by Region, 2006-2013
Application of Goodyear Tire in China
Revenue and Business of Continental by Region, 2008-2013
Key Figures of Continental from Tire Business, 2011-2013
Tyre Brands of Continental
Revenue of Continental from Tire Business by Region, 2012-2013
PLT Tire Capacity of Continental by Region (Excluding Europe), 2012
PLT Tire Capacity of Continental by Region (Excluding Europe), 2013
PLT Tire Capacity of Continental Europe by Region, 2012
PLT Tire Capacity of Continental Europe by Region, 2013
CV Tire Capacity of Continental by Region, 2012
CV Tyre Capacity of Continental by Region, 2013
PLT Tire Sales Volume of Continental, 2008-2013
CV Tire Sales Volume of Continental, 2008-2013
Revenue and Operating Margin of Sumitomo Rubber Group, 2007-2014
Revenue of Sumitomo Rubber Group by Region, 2007-2013
Revenue of Sumitomo Rubber Group by Product, 2007-2013
Operating Profit of Sumitomo Rubber Group by Product, 2007-2013
Sales Volume of Sumitomo Rubber Group by Region beyond Japan, 2009-2014
Tire Output and Capacity Utilization of Sumitomo Rubber Group, 2006-2014
Output and Capacity Utilization of Sumitomo Rubber Group, 2006-2014
Tire Application of Sumitomo Rubber Group
Revenue of Sumitomo Rubber Group in China
Revenue and Operating Margin of Pirelli, 2006-2013
EBIT Bridge of Pirelli Tire, 2012-2013
Revenue of Pirelli Tire by Business, 2006-2013
Raw Material Cost of Pirelli Tire, 2012
Raw Material Cost of Pirelli Tire, 2013
Revenue of Pirelli Tyre by Product, 2013
Revenue of Pirelli Tyre by Region, 2012
Revenue of Pirelli Tyre by Region, 2013
Workforce of Pirelli by Region, 2012
Workforce of Pirelli by Region, 2013
Distribution of Pirelli Worldwide
Sales Value and Operating Profit of Yokohama Rubber, 2006-2014
Revenue of Yokohama Rubber by Region, 2006-2013
Global Capacity of Yokohama Rubber, 2009-2014
Revenue and Operating Margin of Hankook, 2003-2013
Sales and Operating Margin of Hankook, 2010Q2-2013Q4
Quarterly Sales Value of Hankook in South Korea and China, 2012Q4-2013Q4
Quarterly Sales Value of Hankook in Europe and North America, 2012Q4-2013Q4
Output of Hankook by Region, 2005-2014
Prices of Natural Rubber and Synthetic Rubber, 2011Q4-2013Q4
Application of Hankook for OE Auto Models
Revenue and Operating Margin of COOPER, 2004-2013
Revenue of COOPER by Region, 2006-2013
Sales Value of COOPER by Product, 2012
Revenue and Operating Margin of Kumho Tire, 2005-2013
Capacity Distribution of Kumho Tire
Shipment and ASP of Kumho Tire, 2009-2013
Quarterly Capacity Utilization of Kumho Tire Worldwide, 2012Q1-2013Q4
Output of Kumho Tire by Region, 2012-2013
Revenue and Operating Margin of Toyo Tire &Rubber, 2004-2013
Revenue of Toyo Tire &Rubber by Region, 2007-2013
Output of Toyo Tire &Rubber, 2008-2013
Changes of Toyo Tire &Rubber in Capital Investment and in Depreciation, 2010-2014
Revenue and Net Margin of Apollo Tires, FY2007-FY2014
Sales Value of Apollo Tires by Product, FY2012
Output and EBITDA Rate of Apollo Tires, FY2007-FY2011
Sales Value and Capacity of Apollo Tires by Region, FY2012
Revenue of Apollo Tyres by Region
Operating Profit of Apollo Tyres by Region
Revenue and Profit of MRF, FY2005-FY2013
Distribution of MRF Plants
Revenue and Operating Margin of Nokian, 2004-2013
Sales Value of Nokian by Destination, 2012
Sales Value of Nokian by Destination, 2013
Sales Value of Nokian by Region, 2012
Raw Material Consumption of Nokian, 2012
Cost of Nokian, 2012-2013
Revenue of Nokian in Russia and CIS, 2003-2012
Revenue and Operating Margin of Cheng Shin Tire, 2003-2013
Revenue of Cheng Shin Tire by Region, 2011-2013
Global Distribution of Plants under Cheng Shin Tire
Brief of Cheng Shin Tire’s Plants
Revenue of Cheng Shin Tire by Product, 2012-2013
Revenue of Cheng Shin Tire by Subsidiary, 2013
Revenue of Cheng Shin Tire by OE & RE Customer, 2013
Application of Cheng Shin Tire in China by Model
Revenue and Operating Margin of Hangzhou Zhongce Rubber from Rubber Business, 2007-2012
Revenue and Output of Hangzhou Zhongce Rubber from Rubber Business, 2007-2012
Organization Structure of Hangzhou Zhongce Rubber
Revenue and Operating Margin of Triangle Tire, 2007-2012
Revenue and Output of Triangle Tire, 2007-2012
Revenue and Operating Margin of Linglong Tire, 2007-2011
Revenue and Output of Linglong Tire, 2007-2011
Revenue and Operating Margin of Aeolus Tire, 2006-2013
Organization Structure of Aeolus Tire
Shareholders of Aeolus Tire
Revenue and Operating Margin of Double Coin, 2005-2013
Organization Structure of Shanghai Tire Group
Revenue and Operating Margin of Guizhou Tire, 2006-2013
Revenue and Operating Margin of Qingdao Double Star, 2004-2013
Revenue and Operating Margin of Xingyuan, 2007-2013
Operating Margin of Sailun Group, 2009-2013
Cost Structure of Sailun Group, 2012-2013
Revenue of Sailun Group by Product, 2009-2014
Gross Margin of Sailun Group by Product, 2009-2014
Revenue and Operating Income of Giti Tire, 2006-2013