Map Tree
RICDB not only offers extensive data for users, but also shows the data in the form of map and graph, which greatly improve the visualized effect. Currently Map Tree covers economic data of more than 180 countries and regions in the world, over 30 provinces, municipalities, and autonomous regions of China, and a dozen of prefecture-level cities in China. Totally there are more than 400,000 indices (time sequence) showed in the Map Tree.
RICDB supports over 900 kinds of map for each continent, country and region in the world and provinces and autonomous regions in China.
RICDB also provides some advanced function, for example£º
Map color change, map data display by level, diversified map data marker
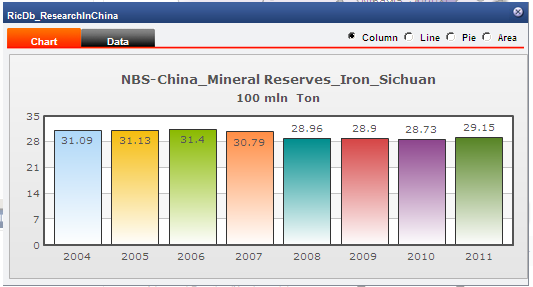
Relevance of map and graph: click one region in the map, you can view the historical trend graph for the region
Search and download data directly based on the map
 How to use Map Tree
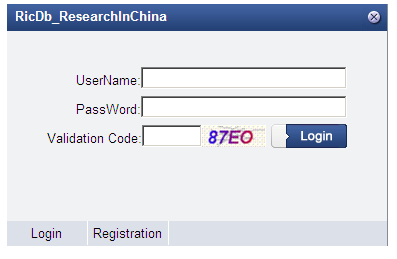
1.Clip Map tree in Homepage. You need to log in for further step.
2.Unfold index in the Map Tree step-by-step, then select map you need.

3.The selected map will be shown in the right.
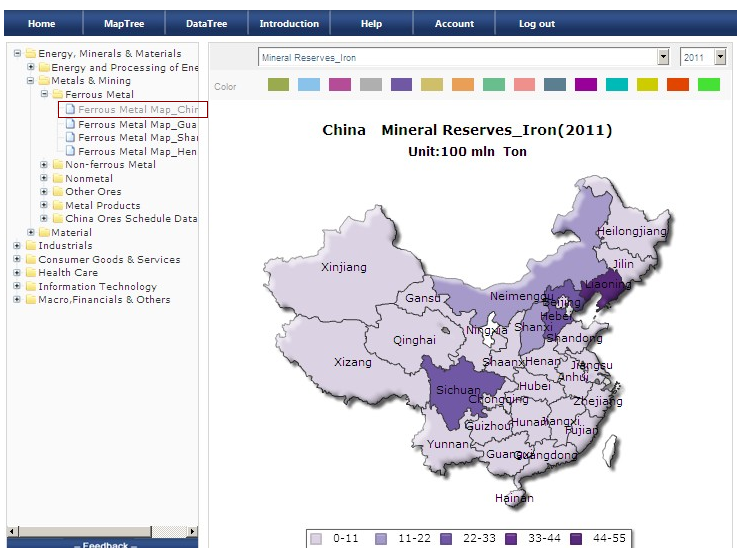
4.You can change the title, color and time of the map.
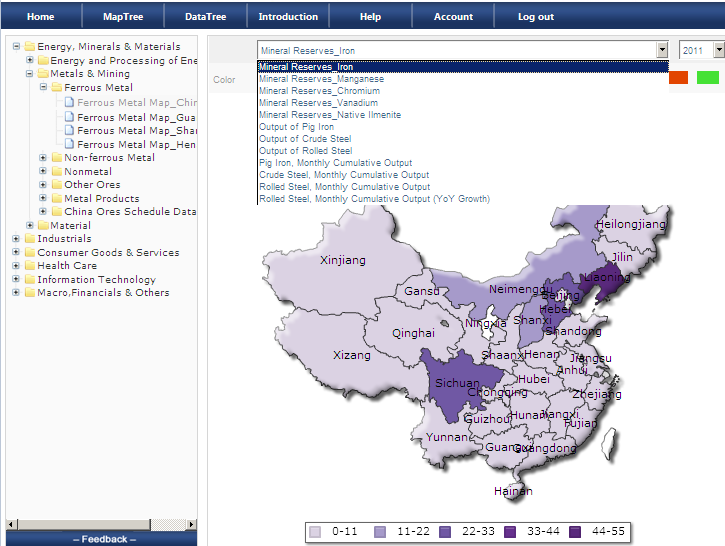
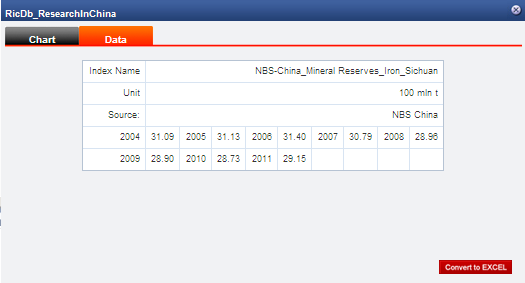
5. Click the region in the map, you can see the data in the format of table or graph.
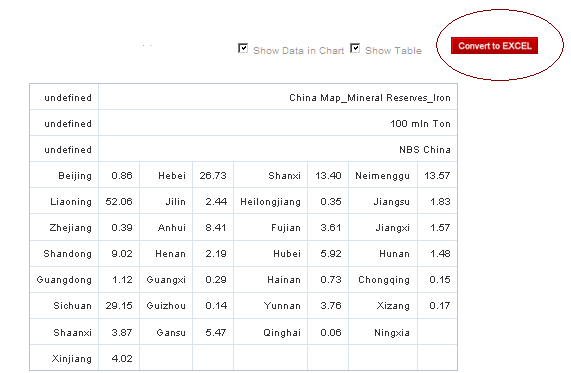
How to download indices under Map Tree
We suggest apply with latest version of Internet Explorer browser and Chrome under Windows System; use Chrome browser under Mac OS, Linux, Android system. We will try to support more browsers as early as possible.
Click "Convert to Excel" button below the table, and download related indices in EXCEL format.