Global and China Automotive Drive Shaft Market Report, 2015
-
July 2015
- Hard Copy
- USD
$2,600
-
- Pages:130
- Single User License
(PDF Unprintable)
- USD
$2,400
-
- Code:
ZN022
- Enterprise-wide License
(PDF Printable & Editable)
- USD
$3,700
-
- Hard Copy + Single User License
- USD
$2,800
-
China needed 62.44 million automotive drive shafts in 2014, of which 79% came from passenger vehicles. Up to now, Chinese automotive drive shaft companies have been capable of developing and producing drive shafts for construction machinery, commercial vehicles and passenger vehicles. However, most of domestic drive shaft producers are small sized and focus on low- and mid-range products, compared with a lower proportion of high-precision, high technical content and high value added products, especially high-end constant velocity (CV) drive shaft market, which is still dominated by foreign brands.
Drive shaft, depending on whether constant angular velocity rotates or not, can be divided into CV drive shaft and non-CV drive shaft.
CV drive shaft, primarily used in passenger vehicle market, enjoys huge market demand. Shanghai GKN Drive Shaft Co., Ltd. (SDS), a supplier holing a dominant position, is a joint venture of GKN Driveline International GmbH and HUAYU Automotive Systems Co., Ltd. SDS now has production bases in Kangqiao (Shanghai), Chongqing, Wuhan and Changchun. GKN Drive Shaft (Chongqing) Co. Ltd. is a joint venture established by SDS and Chang'an Automobile Group.
Non-CV drive shaft is principally used in commercial vehicles, construction machinery, and a small minority of passenger vehicles. Due to limited demand from downstream markets in recent years, non-CV drive shaft market has been highly competitive. Major players in the field include XuchangYuandong Drive Shaft Co., Ltd. and WanxiangQianchao Co., Ltd.
XuchangYuandong Drive Shaft Co., Ltd. is the largest non-CV drive shaft manufacturer in China, producing mainly drive shafts for variedconstruction machineryincluding light, medium-duty and heavy trucks, pickups, SUVs, buses, loaders and cranes. In 2014, the company sold 3.5007 million drive shafts, up 19.06% from 2.9402 million units in 2013, mainly due to significant rise in sales of light drive shaft arising from adjustment in sales structure.
WanxiangQianchao had drive shaft capacity of 4 million units and sold 3.29 million units in 2014. The production of drive shaft is chiefly undertaken by Qianchao Transmission Shaft Co., Ltd., which has 5 factories and 1 research institute, producing mainly drive shafts, steering columns, EPS and other auto parts. Due to a fiercely competitive drive shaft market, the company underwent a decline in drive shaft utilization to 83% in 2014 from 97% in 2013.
Layout of Major Foreign Drive Shaft Companies in China, 2015
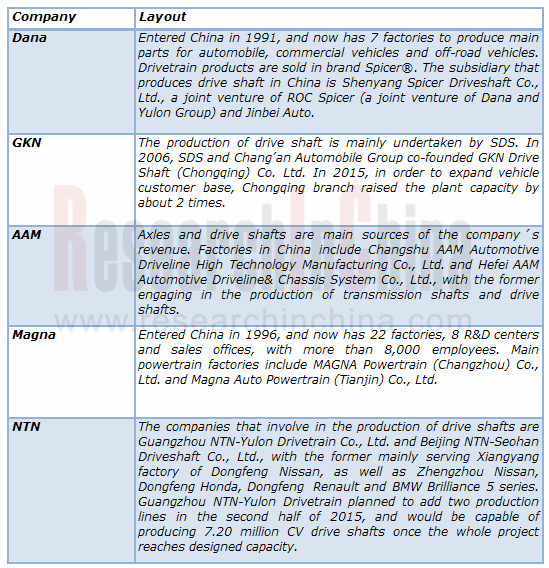
Source: ResearchInChina
The report highlights the followings:
 Overview of China automotive drive shaft industry, including definition, classification, etc.;
Overall study into the Chinese automotive drive shaft market, covering demand, market competition pattern, latest market characteristics;
Study into the Chinese automotive drive shaft market segments, CV drive shaft and non-CV drive shaft market demands and major companies;
Study into major Chinese automotive drive shaft companies, comprising operation, output and sales volume of drive shaft, main customers, and new products.
1 Macro-economy
1.1 GDP
1.2 Fixed-asset Investment
1.3 Import and Export
1.4 Total Retail Sales of Consumer Goods
2 Definition and Classification of Drive Shaft
2.1 Definition
2.2 Composition
2.2.1 Universal Joint
2.2.2 Flexible Sleeve
2.2.3 Shaft Sleeve
2.3 Technical Standards
2.3.1 Performance Requirements and Test Methods for Automobile Steering Drive Shaft Assembly
2.3.2 Test Methods and Technical Conditions for Automotive Drive Shaft Assembly Rack
2.3.3 Test Methods for Automotive CV Universal Joint and Assembly
2.4 Business Model
2.5 Industry Chain
3 Global and China Drive Shaft Downstream Industries
3.1 Global Market
3.2 Chinese Market
3.2.1 Automobile Industry
3.2.2 Output and Sales Volume by Auto Model
4 Drive Shaft Market
4.1 Global
4.2 China
4.3 Drive Shaft Market Demand
4.3.1 Overall
4.3.2 Non-CV Drive Shaft
4.3.3 CV Drive Shaft
5 China’s Import and Export of Drive Shaft
5.1 Import
5.1.1 Import Size
5.1.2 Import by Region
5.2 Export
5.2.1 Export Size
5.2.2 Export by Region
6 Major Chinese Companies
6.1 WanxiangQianchao Co., Ltd.
6.1.1 Profile
6.1.2 Operation
6.1.3 Operating Revenue Structure
6.1.4 Gross Margin
6.1.5 R&D Center
6.1.6 Drive Shaft
6.1.7 Major Customers
6.1.8 Major Suppliers
6.2 Shanghai GKN Drive System Co., Ltd
6.2.1 Profile
6.2.2 Operation
6.2.3 Output and Sales Volume of Drive Shaft
6.2.4 Subsidiaries
6.2.5 Production Base
6.3 XuchangYuandong Drive Shaft Co., Ltd.
6.3.1 Profile
6.3.2 Operation
6.3.3 Operating Revenue Structure
6.3.4 Gross Margin
6.3.5 Subsidiaries
6.3.6 Drive Shaft
6.3.7 Major Customers
6.3.8 Major Suppliers
6.3.9 R&D
6.3.10 Key Projects
6.4 Hebei Yulong Drive Shaft Co., Ltd.
6.4.1 Profile
6.4.2 Output and Sales Volume of Drive Shaft
6.4.3 Major Customers
6.5 FAWER Automotive Parts Limited Company
6.5.1 Profile
6.5.2 Operation
6.5.3 Operating Revenue Structure
6.5.4 Gross Margin
6.5.5 R&D Center
6.5.6 Drive Shaft
6.5.7 Major Customers
6.5.8 Major Suppliers
6.5.9 Production Base
6.6 LuoheShilinXinyuan Auto Parts Co., Ltd.
6.7 Shanghai Yaoyuan Crop.
7 Major Foreign Players
7.1 DANA
7.1.1 Profile
7.1.2 Operation
7.1.3 Revenue Structure
7.1.4 Gross Margin
7.1.5 R & D Base
7.1.6 Major Customers
7.1.7 Production Base
7.1.8 DANA China
7.2 GKN
7.2.1 Profile
7.2.2 Operation
7.2.3 Revenue Structure
7.2.4 Headcount
7.2.5 Drive Shaft
7.2.6 GKN China
7.2.7 Auto Models Supported
7.3 AAM
7.3.1 Profile
7.3.2 Operation
7.3.3 Revenue Structure
7.3.4 Gross Margin
7.3.5 R&D Base
7.3.6 Major Customers
7.3.7 Production Base
7.3.8 AAM China
7.4 Magna
7.4.1 Profile
7.4.2 Operation
7.4.3 Revenue Structure
7.4.4 Gross Margin
7.4.5 Major Customers
7.4.6 Production Base
7.4.7 Magna China
7.5 NTN
7.5.1 Profile
7.5.2 Operation
7.5.3 R&D
7.5.4 Production Base
7.5.5 Drive Shaft
7.5.6 NTN China
7.6 IFA Rotorion
China’s Aggregate GDP and YoY Growth, 2000-2015
China’s GDP Growth by Industry, 2001-2015
China’s Fixed Asset Investment and YoY Growth, 2013-2015
China’s Fixed Asset Investment and YoY Growth by Industry, 2013-2015
Real Estate Development’s Share of Fixed Asset Investment in China, 2013-2015
China’s Investment for Real Estate Development and YoY Growth, 2013-2015
China’s Imports, Exports and YoY Growth, 2013-2015
China’s Total Retail Sales of Consumer Goods and YoY Growth, 2013-2015
Classification of Drive Shaft
Structure of Drive Shaft Industry Chain
Global Automobile Output, 2006-2018E
Global Top20 Automobile Producing Countries, 2007-2014
Number of Chinese Carmakers and YoY Growth, 2003-2015
Revenue and YoY Growth of China Automobile Manufacturing Industry, 2003-2015
Total Profit and YoY Growth of China Automobile Manufacturing Industry, 2003-2015
China’s Automobile Output, 2007-2015
China’s Automobile Output by Model, 2007-2015
China’s Output of Passenger Vehicles and Market Segments, 2005-2015
China’s Bus Output by Model, 2005-2015
China’s Truck Output by Model, 2005-2015
Sales Volume of Automotive Drive Shaft and Relevant Products Worldwide, 2007-2018E
Sales of Automotive Drive Shaft and Relevant Products Worldwide, 2007-2018E
Market Share of Dynamic System Worldwide, 2012
Number of Chinese Drive Shaft Companies, 2008-2013
Output of Major Chinese Drive Shaft Companies, 2011-2013
Sales Volume of Major Chinese Drive Shaft Companies, 2011-2013
Share of Demand for Drive Shaft from Passenger Vehicle and Commercial Vehicle in China, 2011-2014
China’s Demand for Non-CV Drive Shaft, 2011-2014
China’s New Demand for Drive Shaft for Commercial Vehicle, 2011-2014
AM Demand for Non-CV Drive Shaft for Commercial Vehicle in China, 2011-2014
China’s Demand for Drive Shaft for Commercial Vehicle, 2011-2014
China’s New Demand for Drive Shaft for Construction Machinery, 2011-2014
AM Demand for Drive Shaft for Construction Machinery in China, 2011-2014
China’s Demand for Drive Shaft for Construction Machinery, 2011-2014
China’s New Demand for CV Drive Shaft for Passenger Vehicle, 2011-2014
AM Demand for CV Drive Shaft for Passenger Vehicle in China, 2011-2014
China’s Demand for CV Drive Shaft for Passenger Vehicle, 2011-2014
China’s Import Volume and Value of Automotive Drive Shaft, 2009-2015
China’s Automotive Drive Shaft Imports, 2009-2015
Top 10 Chinese Regions by Automotive Drive Shaft Import Volume, 2009-2015
China's Automotive Drive Shaft Import Value, 2009-2015
Top 10 Chinese Regions by Automotive Drive Shaft Import Value, 2009-2015
China’s Export Volume and Value of Automotive Drive Shaft, 2009-2015
China’s Automotive Drive Shaft Exports, 2009-2015
Top 10 Chinese Regions by Automotive Drive Shaft Export Volume, 2009-2015
China's Automotive Drive Shaft Export Value, 2009-2015
Top 10 Chinese Regions by Automotive Drive Shaft Export Value, 2009-2015
Revenue and YoY Growth of WanxiangQianchao, 2010-2015
Revenue and YoY Growth of WanxiangQianchao by Product, 2009-2013
Revenue and YoY Growth of WanxiangQianchao by Region, 2010-2014
Revenue Structure of WanxiangQianchao by Channel, 2013-2014
Overall Gross Margin of WanxiangQianchao, 2010-2014
Gross Margin of WanxiangQianchao by Product and Region, 2010-2014
R&D Costs and % of Total Revenue of WanxiangQianchao, 2012-2014
Output, Sales Volume and Inventory of WanxiangQianchao, 2012-2014
WanxiangQianchao’s Revenue from Top5 Customers and % of Total Revenue, 2013-2014
WanxiangQianchao’s Procurement from Top5 Suppliers and % of Total Procurement, 2013-2014
Investment Structure of Shanghai GKN Drive System
Revenue and YoY Growth of Shanghai GKN Drive System, 2010-2013
Drive Shaft Output of Shanghai GKN Drive System, 2009-2013
Subsidiaries of Shanghai GKN Drive System
Production Bases of Shanghai GKN Drive System
Revenue and YoY Growth of XuchangYuandong Drive Shaft, 2009-2015
Revenue Breakdown of XuchangYuandong Drive Shaft by Product and Region, 2009-2014
Operating Costs of XuchangYuandong Drive Shaft by Product and Region, 2009-2014
Gross Margin of XuchangYuandong Drive Shaft by Product, 2009-2014
Joint-stock and Holding Companies, Shareholding Ratio and Primary Businesses of XuchangYuandong Drive Shaft, 2014
Output and Sales Volume of XuchangYuandong Drive Shaft, 2012-2014
XuchangYuandong Drive Shaft’s Revenue from Top5 Customers and % of Total Revenue, 2014
XuchangYuandong Drive Shaft’s Procurement from Top5 Suppliers and % of Total Procurement
R&D Costs of XuchangYuandong Drive Shaft, 2013-2014
Output and Sales Volume of Hebei Yulong Drive Shaft, 2011-2013
Customers of Hebei Yulong Drive Shaft
Revenue and YoY Growth of FAWER Automotive Parts, 2009-2015
Revenue and YoY Growth of FAWER Automotive Parts by Product, 2013-2014
Gross Margin of FAWER Automotive Parts by Product, 2013-2014
R&D Costs of FAWER Automotive Parts and % of Total Revenue, 2013-2014
R&D Projects of FAWER Automotive Parts, 2014
FAWER Automotive Parts
Output and Sales Volume of FAWER Automotive Parts’ Main Products, 2013-2014
FAWER Automotive Parts’ Revenue from Top5 Customers and % of Total Revenue, 2013-2014
FAWER Automotive Parts’ Procurement from Top5 Suppliers and % of Total Procurement, 2013-2014
Products of FAWER Automotive Parts’ Major Branch Companies
Major Subsidiaries and Joint Ventures of FAWER Automotive Parts, 2014
Revenue and YoY Growth of DANA, 2009-2015
Classification of and Models Supported by DANA’s Products
Revenue Breakdown of DANA by Product, 2009-2014
Revenue Structure of DANA by Product, 2009-2014
Revenue Breakdown of DANA by Region, 2009-2014
Revenue Structure of DANA by Region, 2009-2014
Forecast of DANA’s Performance by Region, 2015
Gross Margin of DANA, 2009-2014
R&D Costs of DANA and % of Total Revenue, 2011-2014
Markets and Major Customers of DANA
Share of DANA’s Major Customers, 2014
Regional Production Bases of DANA, 2014
Main Business Segments of GKN, 2014
Global Production Bases of GKN
Revenue and YoY Growth of GKN, 2013-2014
Revenue Breakdown of GKN by Product/Segment, 2012-2014
Revenue Structure of GKN by Region, 2014
Employees and YoY Growth of GKN, 2009-2014
Global Employees of GKN, 2014
Revenue of GKN Driveline Segment, 2013-2014
Revenue Breakdown of GKN Driveline Segment by Business, 2014
Revenue of GKN Driveline Segment by Region, 2014
Production Bases of GKN Driveline, 2014
Major Customers of GKN Driveline, 2014
Main Factories for AWD Systems of GKN
Revenue and YoY Growth of AAM, 2009-2015
Revenue Structure of AAM by Product, 2009-2014
Revenue Breakdown of AAM by Region, 2009-2014
Consolidated Gross Margin of AAM, 2011-2014
R&D Costs of AAM, 2011-2014
Major Customers’ Share of Total Revenue of AAM, 2011-2014
Production Bases, Locations and Main Businesses of AAM
Revenue and YoY Growth of Magna, 2009-2014
Net Income of Magna, 2010-2014
Revenue Breakdown of Magna by Product, 2009-2014
Revenue Structure of Magna by Product, 2009-2014
Revenue Breakdown of Magna by Region, 2009-2014
Consolidated Gross Margin of Magna, 2009-2014
Revenue Breakdown of Magna by Customer, 2009-2014
Revenue Structure of Magna by Customer, 2009-2014
Revenue and Financial Indexes of NTN, FY2010-FY2015
Revenue Breakdown of NTN by Business/Region, FY2013-FY2015
Revenue Breakdown of NTN’s After-sales Service Business by Region, FY2011-FY2015
Revenue Breakdown of NTN’s Automotive Business by Region, FY2011-FY2015
R&D Costs of NTN, FY2012-FY2014
NTN’s Production and Marketing Network in China
Major Customers of Guangzhou NTN-Yulong Drivetrain, 2013
China Automotive Lighting and Ambient Lighting System Research Report, 2025
Automotive Lighting System Research: In 2025H1, Autonomous Driving System (ADS) Marker Lamps Saw an 11-Fold Year-on-Year Growth and the Installation Rate of Automotive LED Lighting Approached 90...
Ecological Domain and Automotive Hardware Expansion Research Report, 2025
ResearchInChina has released the Ecological Domain and Automotive Hardware Expansion Research Report, 2025, which delves into the application of various automotive extended hardware, supplier ecologic...
Automotive Seating Innovation Technology Trend Research Report, 2025
Automotive Seating Research: With Popularization of Comfort Functions, How to Properly "Stack Functions" for Seating?
This report studies the status quo of seating technologies and functions in aspe...
Research Report on Chinese Suppliers’ Overseas Layout of Intelligent Driving, 2025
Research on Overseas Layout of Intelligent Driving: There Are Multiple Challenges in Overseas Layout, and Light-Asset Cooperation with Foreign Suppliers Emerges as the Optimal Solution at Present
20...
High-Voltage Power Supply in New Energy Vehicle (BMS, BDU, Relay, Integrated Battery Box) Research Report, 2025
The high-voltage power supply system is a core component of new energy vehicles. The battery pack serves as the central energy source, with the capacity of power battery affecting the vehicle's range,...
Automotive Radio Frequency System-on-Chip (RF SoC) and Module Research Report, 2025
Automotive RF SoC Research: The Pace of Introducing "Nerve Endings" such as UWB, NTN Satellite Communication, NearLink, and WIFI into Intelligent Vehicles Quickens
RF SoC (Radio Frequency Syst...
Automotive Power Management ICs and Signal Chain Chips Industry Research Report, 2025
Analog chips are used to process continuous analog signals from the natural world, such as light, sound, electricity/magnetism, position/speed/acceleration, and temperature. They are mainly composed o...
Global and China Electronic Rearview Mirror Industry Report, 2025
Based on the installation location, electronic rearview mirrors can be divided into electronic interior rearview mirrors (i.e., streaming media rearview mirrors) and electronic exterior rearview mirro...
Intelligent Cockpit Tier 1 Supplier Research Report, 2025 (Chinese Companies)
Intelligent Cockpit Tier1 Suppliers Research: Emerging AI Cockpit Products Fuel Layout of Full-Scenario Cockpit Ecosystem
This report mainly analyzes the current layout, innovative products, and deve...
Next-generation Central and Zonal Communication Network Topology and Chip Industry Research Report, 2025
The automotive E/E architecture is evolving towards a "central computing + zonal control" architecture, where the central computing platform is responsible for high-computing-power tasks, and zonal co...
Vehicle-road-cloud Integration and C-V2X Industry Research Report, 2025
Vehicle-side C-V2X Application Scenarios: Transition from R16 to R17, Providing a Communication Base for High-level Autonomous Driving, with the C-V2X On-board Explosion Period Approaching
In 2024, t...
Intelligent Cockpit Patent Analysis Report, 2025
Patent Trend: Three Major Directions of Intelligent Cockpits in 2025
This report explores the development trends of cutting-edge intelligent cockpits from the perspective of patents. The research sco...
Smart Car Information Security (Cybersecurity and Data Security) Research Report, 2025
Research on Automotive Information Security: AI Fusion Intelligent Protection and Ecological Collaboration Ensure Cybersecurity and Data Security
At present, what are the security risks faced by inte...
New Energy Vehicle 800-1000V High-Voltage Architecture and Supply Chain Research Report, 2025
Research on 800-1000V Architecture: to be installed in over 7 million vehicles in 2030, marking the arrival of the era of full-domain high voltage and megawatt supercharging.
In 2025, the 800-1000V h...
Foreign Tier 1 ADAS Suppliers Industry Research Report 2025
Research on Overseas Tier 1 ADAS Suppliers: Three Paths for Foreign Enterprises to Transfer to NOA
Foreign Tier 1 ADAS suppliers are obviously lagging behind in the field of NOA.
In 2024, Aptiv (2.6...
VLA Large Model Applications in Automotive and Robotics Research Report, 2025
ResearchInChina releases "VLA Large Model Applications in Automotive and Robotics Research Report, 2025": The report summarizes and analyzes the technical origin, development stages, application cases...
OEMs’ Next-generation In-vehicle Infotainment (IVI) System Trends Report, 2025
ResearchInChina releases the "OEMs’ Next-generation In-vehicle Infotainment (IVI) System Trends Report, 2025", which sorts out iterative development context of mainstream automakers in terms of infota...
Autonomous Driving SoC Research Report, 2025
High-level intelligent driving penetration continues to increase, with large-scale upgrading of intelligent driving SoC in 2025
In 2024, the total sales volume of domestic passenger cars in China was...