China Electric Bus Industry Report, 2015-2020
-
July 2015
- Hard Copy
- USD
$2,700
-
- Pages:118
- Single User License
(PDF Unprintable)
- USD
$2,500
-
- Code:
ys010
- Enterprise-wide License
(PDF Printable & Editable)
- USD
$3,900
-
- Hard Copy + Single User License
- USD
$2,900
-
China Electric Bus Industry Report, 2015-2020 by ResearchInChina focuses on the followings:
 Significance, status quo, development trends at home and abroad of electric bus promotion;
Mainstream technology roadmaps for electric bus, and status quo & trend of bus battery, motor, electronic control industry chain in China;
Main subsidies for purchase (tax relief and fiscal subsidies) and usage in China electric bus industry, and promotion policies nationwide;
Electric bus output & sales volume and future trends in China, competitive landscape among and market share, sales volume prediction, investment and capacity of major electric bus companies;
Technological level, output & sales volume, capacity and development strategy of 12 major Chinese electric bus manufacturers.
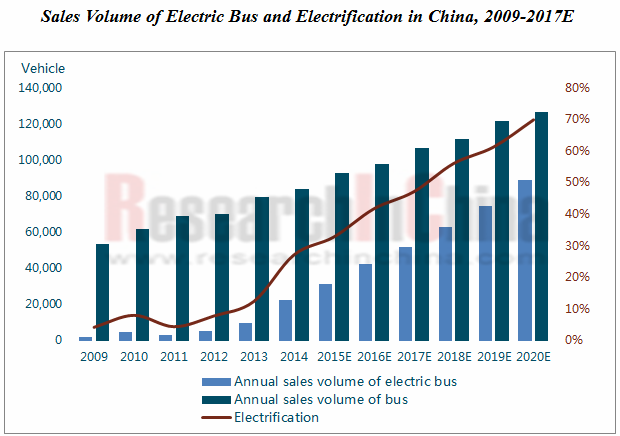
Sales volume of electric bus reached 27,000 vehicles throughout the year 2014, soaring by 160.3% from the previous year, and kept growing rapidly in the first half of 2015, approaching 20,000 vehicles. It is expected that China will sell 154,000 electric buses in 2020, with a CAGR of 33.6% during this period.
The variety that is vigorously promoted is electric public bus which accounts for 85% of total sales volume of electric bus. City bus ownership in China now has exceeded 500,000 vehicles, carrying 60% of city passenger transportation in urban public transport system. As of 2014, electric public bus ownership nationwide topped 80,000 vehicles.
Next, the Chinese government will gradually cut fuel subsidies for traditional bus and shifts financial support to electric model, the move that will give local governments a significant stimulus to replace new additional public buses with electric ones. It is expected that new electric public buses added in 2020 will make up 70% of new public buses added that year, and cumulative electric public bus ownership will exceed 300,000 vehicles by 2020. Technologically speaking, all-electric public bus, significantly propped up by policies, will be the main orientation of future development.
Besides public bus, light business-purpose bus and touring bus markets will be next market spotlights for electric bus. New energy commercial bus rating had been completed in the first quarter of 2015, and 3,000 vehicles are expected to be sold in 2015. With advances in battery technology, improvement in charging infrastructure along expressways, long-distance transportation will become possible, and the triggering point for this market segment is expected to occur around 2018.
Seen from battery, motor and electronic control industry chain, electric bus now adopts mainly LFP power battery and “LFP+ supercapacitor” dual-battery system. Based on the type of battery used by electric bus in the first half of 2015, configuration rate of LFP power battery including “LFP+ supercapacitor” dual-battery system was up to 82%. Rated power of drive motor for electric bus mostly falls into the range of 80 kW to 120kW. Asynchronous motor still holds a dominant position, as it can provide high-power traction; permanent-magnet synchronous motor starts to be massively used in medium-sized and small buses.
In point of competitive landscape among companies, top5 electric bus manufacturers in 2014 were Yutong Bus, Xiamen King Long Motor Group (including three wholly-owned subsidiaries: Higer Bus, Xiamen King Long United Automotive Industry, Xiamen Golden Dragon Bus), BYD, Nanjing Golden Dragon Bus and Zhongtong Bus, together producing 17,011 vehicles, 62.5% of the country’s total.
As electric bus enjoys enormous space for future development and can greatly drive the development of relevant industrial chains, China has ushered in an electric bus investment boom since 2014, with planned investment in electric bus announced by key bus makers nationwide exceeding RMB21 billion according to preliminary statistics and a lot of capacity putting into production in 2016 and 2017. Cities like Shenzhen, Nanjing and Wuhan took a lead in this round of investment and attracted a number of technically leading bus manufacturers to settle in.
1 Overview of Electric Bus
1.1 Significance of Promotion
1.2 Environmental Friendliness & Economy
1.2.1 Environmental Friendliness
1.2.2 Economy
1.3 Status Quo and Trend of Promotion in China
1.3.1 Electric City Bus is the Key Promotion Category
1.3.2 Electric Highway Bus will See Explosive Growth in 2015
1.3.3 Battery Electric Bus will be the Main Direction in Future
1.4 Status Quo and Trend of Promotion Overseas
1.4.1 Status Quo of Electric Public Bus Promotion Overseas
1.4.2 Technology Trend of Electric Public Bus Overseas
2 Industry Chain
2.1 Technology Roadmap
2.2 Battery
2.3 Motor & Controller
3 Key Policies on the Industry
3.1 Policy of Purchase Tax Deduction and Exemption
3.2 Policy of Fiscal Subsidies
3.2.1 Subsidies for Electric Bus during 2014-2015
3.2.2 Subsidies for Electric Bus during 2016-2020
3.2.3 Subsidies for Fuel Cell Bus
3.3“Oil Reduction & Electricity Compensation” Policy
3.4 Electric Vehicle Promotion Policy
4 China Electric Bus Market
4.1 Electric Bus Market
4.1.1 Overall Market
4.1.2 Competition among Enterprises
4.1.3 Investment and Production Capacity
4.2 All Bus Market
4.2.1 Overall Market
4.2.2 Competition among Enterprises
5 Chinese Electric Bus Manufacturers
5.1 Zhengzhou Yutong Group
5.1.1 Profile
5.1.2 Operating Data
5.1.3 Electric Bus Business
5.1.4 All Bus Business
5.1.5 Bus Production Capacity
5.2 BYD
5.2.1 Profile
5.2.2 Operating Data
5.2.3 Electric Bus Business
5.2.4 Battery Business
5.2.5 All Bus Business
5.3 Xiamen King Long Motor Group
5.3.1 Profile
5.3.2 Operating Data
5.3.3 Electric Bus Business
5.3.4 All Bus Business
5.3.5 Bus Production Capacity
5.4 Nanjing Golden Dragon Bus Co., Ltd
5.4.1 Profile
5.4.2 Electric Bus Business
5.5 Zhongtong Bus Holding Co., Ltd
5.5.1 Profile
5.5.2 Operating Data
5.5.3 Electric Bus Business
5.5.4 All Bus Business
5.5.5 Bus Production Capacity
5.6 Foton Motor Group
5.6.1 Profile
5.6.2 Operating Data
5.6.3 Electric Bus Business
5.6.4 All Bus Business
5.6.5 Bus Production Capacity
5.7 Shanghai Sunwin Bus Corporation
5.7.1 Profile
5.7.2 Electric Bus Business
5.7.3 All Bus Business
5.7.4 Production Capacity
5.8 Hunan CSR Times Electric Vehicle Co., Ltd.
5.8.1 Profile
5.8.2 Operating Data
5.8.3 Electric Bus Business
5.8.4 Bus Production Capacity
5.9 Anhui Ankai Automobile Company Ltd.
5.9.1 Profile
5.9.2 Operating Data
5.9.3 Electric Bus Business
5.9.4 All Bus Business
5.9.5 Bus Production Capacity
5.10 China Youngman Automobile Group
5.10.1 Profile
5.10.2 Electric Bus Business
5.10.3 All Bus Business
5.10.4 Bus Production Capacity
5.11 Chongqing Hengtong Bus Co., Ltd
5.11.1 Profile
5.11.2 Operating Data
5.11.3 Electric Bus Business
5.11.4 All Bus Business
5.11.5 Bus Production Capacity
5.12 Shenzhen Wuzhulong Motors Co., Ltd.
5.12.1 Profile
5.12.2 Operating Data
5.12.3 Electric Bus Business
Ownership of Urban Public Buses in China, 2008-2014
Proportion of Urban Passenger Traffic in China
Pollutant Emission of Vehicle
CO2 Emissions Per km of Buses of Varied Types (g/km, vehicle)
Pollutant Emissions inside City of Buses of Varied Types (Kg/year, Vehicle)
Pollutant Emissions outside City of Buses of Varied Types (Kg/year, Vehicle)
Overall Pollutant Emission of Different Types of Bus (Kg/year, vehicle)
Total Costs (before Subsidies) in Full Lifespan of Different Types of Bus
Total Costs (Subsidies Received after Purchase) in Full Lifespan of Different Types of Bus
Total Costs (After Purchase and Fuel Subsidies) in Full Lifespan of Different Types of Bus
Results of Comprehensive Comparison of Different Technology Roadmaps
Global Electric Public Bus Promotion (as of 2014)
Wireless Charging Public Bus Technology Sketch Map
Online Fast-charging Electric Bus Network Planning in London, 2020
Common Sharing of Vehicle Charging Facilities for Bus and Private Car
Technical Parameters of Electric Bus with Different Technical Routes
Battery, Motor and Electric Control Industry Chains of Electric Vehicle
Requirements of Electric Vehicle on Performance of Battery and Battery System
Rate of Power Battery (by Technical Route) Installation in Electric Bus, 2015H1
Motor and Controller Supply Relation of Key Electric Bus Enterprises
Statistics on Vehicle Models in the Purchase Tax Exemption Catalog in the First Three Batches Issued by MIIT
Standards of Subsidies (Central Finance) for Electric Bus in China, 2014-2015
Standards of Subsidies (Central Finance) for Electric Bus in China, 2016
Standards of Subsidies for Fuel Cell Vehicle in China, 2016
Electric Vehicle Promotion Program and Progress in Cities (Cluster) in China, 2013-2015
Electric Vehicle Promotion Program (Public Traffic and Personal Consumption) in China, 2014-2015
Electric Vehicle Promotion Quantity in Cities (Cluster) in China, 2014
Electric Bus Output of China, 2012-2020E
Proportion of Electric Bus (by Power Type) Output in China, 2014
Electric Bus (by Power Type) Output in China, 2015H1
Proportion of Electric Bus (by Power Type) Output in China, 2015H1
Electric Bus (by Application) Output in China, 2012-2020E
Electric City Bus Sales Volume and Electric Rate in China, 2009-2017E
Output and Market Share of Top 15 Electric Bus Enterprises, 2014
Output and Market Share of Top 15 Electric Bus Enterprises, 2015H1
Output and Market Share of Top 10 Battery Electric Bus Enterprises, 2014
Output and Market Share of Top 14 Battery Electric Bus Enterprises, 2015H1
Output and Market Share of Top 10 Hybrid Bus Enterprises, 2014
Output and Market Share of Top 10 Hybrid Bus Enterprises, 2015H1
Sales Volume of Leading Electric Bus Enterprises, 2012-2017E
Electric Bus Investments in China, 2009-2014
China’s Bus (Excluding Incomplete Vehicle) Sales Volume, 2009-2017E
Bus (by Length) Sales Volume in China, 2009-2017E
Ranking of Top 10 Large Bus Enterprises by Sales Volume, 2014
Ranking of Top 10 Medium Bus Enterprises by Sales Volume, 2014
Ranking of Top 10 Light Bus Enterprises by Sales Volume, 2014
Equity Structure of Zhengzhou Yutong Group, 2014
Business Performance of Zhengzhou Yutong Group, 2010-2015Q1
Revenue of Zhengzhou Yutong Group by Regions, 2010-2014
Electric Bus Sales Volume of Zhengzhou Yutong Group, 2011-2015
Electric Bus Sales Volume as Percent of Total of Zhengzhou Yutong Group, 2011-2015
Output of Zhengzhou Yutong Group by Vehicle Model, 2009-2015H1
Sales Volume of Zhengzhou Yutong Group by Vehicle Model, 2009-2015H1
Sales Volume of Zhengzhou Yutong Group by Application, 2011-2015
Proportion of Yutong Bus’ Sales Volume by Application, 2011-2015
Capacity Layout of Zhengzhou Yutong Group (Including Electric Bus), 2014
Business Performance of BYD, 2010-2015Q1
Revenue Structure of BYD by Business, 2012-2014
Gross Margin of BYD by Business, 2009-2014
Electric Bus Sales Volume of BYD, 2012-2017E
Cost Breakdown of BYD K9 Battery Electric Bus
Power & Energy Storage Battery Business Scale of BYD, 2011-2017E
Technical Parameters of LFMP Battery
Capacity, Weight and Cost of BYD’s Power Battery Pack
Electric Vehicle Sales Volume of BYD, 2011-2017E
Equity Structure of King Long Motor Group, 2014
Selected Financial Indicators of King Long, 2010-2015Q1
Revenue of King Long by Regions, 2009-2014
Electric Bus Sales Volume of King Long, 2011-2015
Proportion of King Long’s Electric Bus Sales Volume, 2011-2015
Parallel-serial Hybrid Power System of Golden Dragon
Output (by Model) of King Long, 2009-2015H1
Sales Volume (by Model) of King Long, 2009-2015H1
Capacity Layout (Including Electric Bus) of King Long, 2014
Electric Bus Investment Plan of King Long
Electric Bus Sales Volume of Nanjing Golden Dragon Bus, 2013-2017E
Equity Structure of Zhong Tong Bus, 2014
Business Performance of Zhong Tong Bus, 2009-2015Q1
Revenue and Gross Margin of Zhong Tong Bus by Regions, 2009-2014
Electric Bus Sales Volume of Zhong Tong Bus, 2011-2015
Proportion of Zhong Tong Bus’ Electric Bus Sales Volume, 2011-2015
Core Suppliers for Electric Bus of Zhong Tong Bus
Medium and Large Bus Output of Zhong Tong Bus, 2009-2015H1
Medium and Large Bus Sales Volume of Zhong Tong Bus, 2009-2015H1
Electric Bus Projects under Construction of Zhong Tong Bus
Equity Structure of Foton
Selected Financial Indicators of Foton, 2009-2015Q1
Revenue of Foton by Products, 2009-2014
Revenue of Foton by Regions, 2009-2014
Electric Bus Sales Volume of Foton, 2013-2017E
Core Supplies for Electric Bus of Foton
Light Bus Revenue, Sales Volume and Price of Foton, 2011-2016E
Medium and Large Bus Revenue, Sales Volume and Price of Foton, 2011-2016E
Bus (Including Electric Bus) Capacity Layout of Foton
Equity Structure of Shanghai Sunwin Bus, 2014
Electric Bus Sales Volume of Shanghai Sunwin Bus, 2013-2017E
Output (by Model) of Shanghai Sunwin Bus, 2009-2015H1
Sale Volume (by Model) of Shanghai Sunwin Bus, 2009-2015H1
Bus (Including Electric Bus) Production Capacity Layout of Shanghai Sunwin Bus, 2014
Investment Plan of Shanghai Sunwin Bus
Business Performance of CSR Times, 2011-2014
Electric Bus Sales Volume of CSR Times, 2012-2017E
Core Suppliers for Electric Bus of CSR Times
Electric Bus Capacity Layout of CSR Times, 2014
Equity Structure of Ankai, 2014
Selected Financial Indicators of Ankai, 2009-2015Q1
Revenue of Ankai by Products, 2009-2014
Revenue of Ankai by Regions, 2009-2014
Electric Bus Sales Volume of Ankai, 2012-2017E
Core Suppliers for Electric Bus of Ankai
Output (by Model) of Ankai, 2009-2015H1
Sales Volume (by Model) of Ankai, 2009-2015H1
Capacity Layout (Including Electric Bus) of Ankai
Core Suppliers for Electric Bus of Youngman
Output (by Model) of Youngman, 2009-2015H1
Sales Volume (by Model) of Youngman, 2009-2015H1
Capacity Layout of Youngman, 2014
Equity Structure of Chongqing Hengtong Bus
Business Performance of Chongqing Hengtong Bus, 2012-2014
Electric Bus Sales Volume of Chongqing Hengtong Bus, 2012-2014
Electric Bus Business Performance of Chongqing Hengtong Bus, 2012-2014
Output (by Model) of Chongqing Hengtong Bus, 2011-2015H1
Sales Volume (by Model) of Chongqing Hengtong Bus, 2011-2015H1
Business Performance of Shenzhen Wuzhoulong Motors, 2012-2014
China Automotive Lighting and Ambient Lighting System Research Report, 2025
Automotive Lighting System Research: In 2025H1, Autonomous Driving System (ADS) Marker Lamps Saw an 11-Fold Year-on-Year Growth and the Installation Rate of Automotive LED Lighting Approached 90...
Ecological Domain and Automotive Hardware Expansion Research Report, 2025
ResearchInChina has released the Ecological Domain and Automotive Hardware Expansion Research Report, 2025, which delves into the application of various automotive extended hardware, supplier ecologic...
Automotive Seating Innovation Technology Trend Research Report, 2025
Automotive Seating Research: With Popularization of Comfort Functions, How to Properly "Stack Functions" for Seating?
This report studies the status quo of seating technologies and functions in aspe...
Research Report on Chinese Suppliers’ Overseas Layout of Intelligent Driving, 2025
Research on Overseas Layout of Intelligent Driving: There Are Multiple Challenges in Overseas Layout, and Light-Asset Cooperation with Foreign Suppliers Emerges as the Optimal Solution at Present
20...
High-Voltage Power Supply in New Energy Vehicle (BMS, BDU, Relay, Integrated Battery Box) Research Report, 2025
The high-voltage power supply system is a core component of new energy vehicles. The battery pack serves as the central energy source, with the capacity of power battery affecting the vehicle's range,...
Automotive Radio Frequency System-on-Chip (RF SoC) and Module Research Report, 2025
Automotive RF SoC Research: The Pace of Introducing "Nerve Endings" such as UWB, NTN Satellite Communication, NearLink, and WIFI into Intelligent Vehicles Quickens
RF SoC (Radio Frequency Syst...
Automotive Power Management ICs and Signal Chain Chips Industry Research Report, 2025
Analog chips are used to process continuous analog signals from the natural world, such as light, sound, electricity/magnetism, position/speed/acceleration, and temperature. They are mainly composed o...
Global and China Electronic Rearview Mirror Industry Report, 2025
Based on the installation location, electronic rearview mirrors can be divided into electronic interior rearview mirrors (i.e., streaming media rearview mirrors) and electronic exterior rearview mirro...
Intelligent Cockpit Tier 1 Supplier Research Report, 2025 (Chinese Companies)
Intelligent Cockpit Tier1 Suppliers Research: Emerging AI Cockpit Products Fuel Layout of Full-Scenario Cockpit Ecosystem
This report mainly analyzes the current layout, innovative products, and deve...
Next-generation Central and Zonal Communication Network Topology and Chip Industry Research Report, 2025
The automotive E/E architecture is evolving towards a "central computing + zonal control" architecture, where the central computing platform is responsible for high-computing-power tasks, and zonal co...
Vehicle-road-cloud Integration and C-V2X Industry Research Report, 2025
Vehicle-side C-V2X Application Scenarios: Transition from R16 to R17, Providing a Communication Base for High-level Autonomous Driving, with the C-V2X On-board Explosion Period Approaching
In 2024, t...
Intelligent Cockpit Patent Analysis Report, 2025
Patent Trend: Three Major Directions of Intelligent Cockpits in 2025
This report explores the development trends of cutting-edge intelligent cockpits from the perspective of patents. The research sco...
Smart Car Information Security (Cybersecurity and Data Security) Research Report, 2025
Research on Automotive Information Security: AI Fusion Intelligent Protection and Ecological Collaboration Ensure Cybersecurity and Data Security
At present, what are the security risks faced by inte...
New Energy Vehicle 800-1000V High-Voltage Architecture and Supply Chain Research Report, 2025
Research on 800-1000V Architecture: to be installed in over 7 million vehicles in 2030, marking the arrival of the era of full-domain high voltage and megawatt supercharging.
In 2025, the 800-1000V h...
Foreign Tier 1 ADAS Suppliers Industry Research Report 2025
Research on Overseas Tier 1 ADAS Suppliers: Three Paths for Foreign Enterprises to Transfer to NOA
Foreign Tier 1 ADAS suppliers are obviously lagging behind in the field of NOA.
In 2024, Aptiv (2.6...
VLA Large Model Applications in Automotive and Robotics Research Report, 2025
ResearchInChina releases "VLA Large Model Applications in Automotive and Robotics Research Report, 2025": The report summarizes and analyzes the technical origin, development stages, application cases...
OEMs’ Next-generation In-vehicle Infotainment (IVI) System Trends Report, 2025
ResearchInChina releases the "OEMs’ Next-generation In-vehicle Infotainment (IVI) System Trends Report, 2025", which sorts out iterative development context of mainstream automakers in terms of infota...
Autonomous Driving SoC Research Report, 2025
High-level intelligent driving penetration continues to increase, with large-scale upgrading of intelligent driving SoC in 2025
In 2024, the total sales volume of domestic passenger cars in China was...