China Independent Clinical Laboratory Industry Report, 2019-2025
-
Apr.2019
- Hard Copy
- USD
$3,200
-
- Pages:140
- Single User License
(PDF Unprintable)
- USD
$3,000
-
- Code:
ZLC077
- Enterprise-wide License
(PDF Printable & Editable)
- USD
$4,500
-
- Hard Copy + Single User License
- USD
$3,400
-
China's independent clinical laboratory industry is still in its infancy. In 2018, it only saw the penetration rate of about 5%, far below 40% or more in Europe, the United States and Japan. The main reason is that the laboratory and pathology departments of public hospitals occupy the leading position in the industry in China.
In China, large independent clinical laboratories can provide more than 2,000 test items, while first-class AAA hospitals can only offer over 300-500 test items. With the acceleration of population aging, higher incidence of various chronic diseases and favorable policies, the penetration rate and scale of China's independent clinical laboratory industry will increase year by year.
China's independent clinical laboratory market size presented the CAGR of 40.9% during 2010-2018, and approximated RMB18.6 billion in 2018, a year-on-year increase of 37.8%. By 2025, it is expected to reach RMB96.7 billion with the growth rate of above 20%.
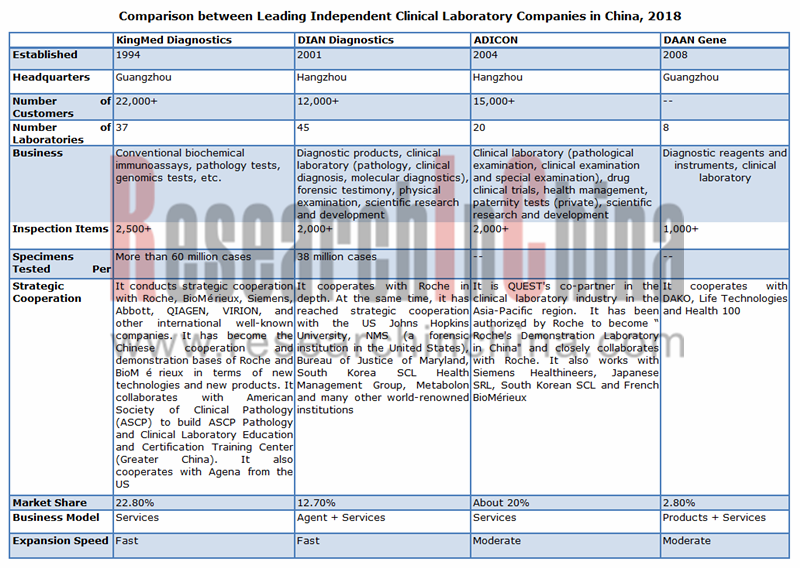
As of September 2018, there had been 1,271 independent clinical laboratories in China, indicating gradually intensified competition in the industry. At present, major players in China include KingMed Diagnostics, ADICON, DIAN Diagnostics, DAAN Gene, MedicalSystem Biotechnology and so forth. Particularly, KingMed Diagnostics is the industry’s leader with a 22.8% market share in 2018.
As the competition intensifies, the market share of the giant KingMed Diagnostics has reduced from 32.9% in 2014 to 22.8% in 2018. In the future, small ICL companies without competitive advantages are likely to be phased out and the industry will be more concentrated.
China Independent Clinical Laboratory Industry Report, 2019-2025 highlights the following:
 Overview of China’s independent clinical laboratory industry, covering development environment, status quo, market size, competitive landscape and development trend;
Upstream and downstream sectors of China’s independent clinical laboratory industry;
Operation, gross margin, R&D investment, independent clinical laboratory business and development strategy of 21 companies in China.
1. Overview of Independent Clinical Laboratory
1.1 Definition
1.2 Industry Chain
2. Overview of China Independent Clinical Laboratory Industry
2.1 Policy Environment
2.1.1 Access Policy
2.1.2 Industry Policy
2.2 International Environment
2.2.1 Status Quo
2.2.2 Benchmarking Enterprises
2.3 Status Quo
2.4 Market size
2.5 Competitive Landscape
2.6 Development Trends
2.6.1 Industry Scale Expands Constantly
2.6.2 Hierarchical Medical System Will Boost the Rapid Development of the Industry
2.6.3 The Laboratory Outsourcing Proportion of Public Hospitals Will Rise due to Cost Control
2.6.4 High-end Test Items Will Make More Revenue Contribution
2.6.5 The Rapid Development of Private Hospitals Will Stimulate the Demand in the Independent Clinical Laboratory Market
2.6.6 Independent Clinical Laboratory Institutions Will Become Technical Leaders amid Quick Technological Upgrades
2.6.7 The Aging Population Balloons and the Demand for Medical Laboratory Will Soar
2.6.8 Internet Will Stimulate the Business Model Upgrade of Independent Clinical Laboratory Industry
2.6.9 Intensified industry competition Forced Small Capacity to Withdraw
3. Upstream and Downstream Sectors of China Independent Clinical Laboratory Industry
3.1 Upstream Sector
3.1.1 Status Quo
3.1.2 Market Size
3.1.3 Competitive Landscape
3.1.4 Development Trend
3.2 Downstream Sector
3.2.1 Quantity
3.2.2 Medical Services
3.2.3 Revenue
3.2.4 Health Costs
4. Key Players
4.1 KingMed Diagnostics
4.1.1 Profile
4.1.2 Operation
4.1.3 Revenue Structure
4.1.4 Gross Margin
4.1.5 R&D and Investment
4.1.6 Major Customers
4.1.7 Independent Clinical Laboratory Business
4.1.8 Development Strategy
4.2 DIAN Diagnostics
4.2.1 Profile
4.2.2 Operation
4.2.3 Revenue Structure
4.2.4 Gross Margin
4.2.5 R&D and Investment
4.2.6 Independent Clinical Laboratory Business
4.2.7 Development Strategy
4.3 Shanghai Labway Clinical Laboratory
4.3.1 Profile
4.3.2 Operation
4.3.3 Revenue Structure
4.3.4 Gross Margin
4.3.5 R&D and Investment
4.3.6 Independent Clinical Laboratory Business
4.4 DAAN Gene
4.4.1 Profile
4.4.2 Operation
4.4.3 Revenue Structure
4.4.4 R&D and Investment
4.4.5 Major Customers
4.4.6 Independent Clinical Laboratory Business
4.4.7 Development Strategy
4.5 ADICON Clinical Laboratories
4.5.1 Profile
4.5.2 Independent Clinical Laboratory Business
4.5.3 Developments
4.6 NYMPHAVN Biotechnology
4.6.1 Profile
4.6.2 Operation
4.6.3 Revenue Structure
4.6.4 Gross Margin
4.6.5 R&D and Investment
4.6.6 Independent Clinical Laboratory Business
4.6.7 Development Strategy
4.7 SurExam Biotechnology
4.7.1 Profile
4.7.2 Operation
4.7.3 Revenue Structure
4.7.4 Gross Margin
4.7.5 Independent Clinical Laboratory Business
4.8 MedicalSystem Biotechnology
4.8.1 Profile
4.8.2 Operation
4.8.3 Revenue Structure
4.8.4 Gross Margin
4.8.5 R&D and Investment
4.8.6 Independent Clinical Laboratory Business
4.8.7 Development Strategy
4.9 Beijing Lawke Health Laboratory
4.9.1 Profile
4.9.2 Operation
4.9.3 Revenue Structure
4.9.4 Gross Margin
4.9.5 R&D and Investment
4.10 Beijing Lepu Gene Technology
4.10.1 Profile
4.10.2 Operation
4.10.3 Revenue Structure
4.10.4 Gross Margin
4.10.5 R&D and Investment
4.10.6 Major Customers
4.11 Shanghai Biotecan Pharmaceuticals
4.11.1 Profile
4.11.2 Operation
4.11.3 Revenue Structure
4.11.4 Gross Margin
4.11.5 Independent Clinical Laboratory Business
4.12 Jiangsu Superbio Life Science
4.12.1 Profile
4.12.2 Operation
4.12.3 Revenue Structure
4.12.4 Gross Margin
4.12.5 Financing
4.13 Amoy Diagnostics
4.13.1 Profile
4.13.2 Operation
4.13.3 Revenue Structure
4.13.4 Gross Margin
4.13.5 Independent Clinical Laboratory Business
4.13.6 Development Strategy
4.14 Guangdong Hybribio Biotech
4.14.1 Profile
4.14.2 Operation
4.14.3 Revenue Structure
4.14.4 Gross Margin
4.14.5 R&D
4.14.6 Independent Clinical Laboratory Business
4.14.7 Development Strategy
4.15 Other Enterprises
4.15.1 Kindstar Global
4.15.2 CapitalBio Corporation
4.15.3 Beijing Adinovo Gene Technology Co., Ltd.
4.15.4 Deyi Diagnostics
4.15.5 IPE Center for Clinical Laboratory
4.15.6 Centre Testing International Group Co., Ltd. (CTI)
4.15.7 SinoPath Diagnosis
Independent Clinical Laboratory Industry Chain
Comparison of Independent Clinical Laboratory Undertakers between China and USA
Policies Concerning Independent Clinical Laboratory Industry in China, 2010-2018
Development History of U.S. Independent Clinical Laboratory Industry
U.S. Independent Clinical Laboratory Market Share by Test Item
U.S. Clinical Laboratory Market Share by Demand Side
Comparison of Independent Clinical Laboratory Market Penetration among Europe, Americas and Japan, 2018
Revenue and Net Income of Quest Diagnostics, 2009-2018
Revenue of Quest Diagnostics by Business, 2014-2018
Major M&As of Quest Diagnostics, 2006-2018
Revenue and Operating Income of LabCorp, 2010-2018
Revenue Breakdown of LabCorp by Division, 2013-2018
Revenue Structure of LabCorp by Division, 2013-2018
Major M&As of LabCorp, 2007-2017
Comparison of Independent Clinical Laboratory Market Penetration between China, and Europe, Americas and Japan, 2018
Comparison of Number of Diagnostic Items among Various Medical Institutions
Independent Clinical Laboratory Market Size in China, 2010-2018
Number of Independent Clinical Laboratories in China, 2007-2018
Independent Clinical Laboratory Revenue of Main Independent Clinical Laboratory Enterprises in China, 2014-2018
Marker Share of Independent Clinical Laboratory Enterprises in China, 2018
Independent Clinical Laboratory Market Size and YoY Growth in China, 2018-2025E
Policies Concerning Public Hospital Reform in China, 2015-2019
Number of Private Hospitals and YoY Growth in China, 2009-2018
Clinic Visits of Private Hospitals in China, 2012-2018
Population Aged over 60 in China, 2009-2018
Market Share of KingMed Diagnostics, 2014-2018
Classification of In Vitro Diagnosis
Development History of In Vitro Diagnostic Industry in China
In Vitro Diagnosis Market Size in China, 2009-2018
In Vitro Diagnosis Market Size in China, 2018-2025E
In Vitro Diagnosis Market Structure in China, 2018
Comparison of Diagnostic Instrument Varieties between Domestic and Foreign Enterprises
Competition Pattern of Diagnostic Reagent Industry in China
IVD Revenue of Major Diagnostic Reagent Enterprises in China, 2014-2018
IVD Market Share of Major Diagnostic Reagent Enterprises in China, 2014-2018
Population Aged over 60 in China, 2009-2018
Policies Concerning In Vitro Diagnosis in China
Comparison of Prospects between In Vitro Diagnosis Segments in China
Number of Medical and Health Institutions in China, 2015-2018
Number of Hospitals in China, 2009-2018
Number of Hospitals in China by Economic Type, 2009-2018
Clinic Visits of Medical Institutions in China, 2015-2018
Clinic Visits of Hospitals in China, 2009-2018
Clinic Visits of Hospitals in China by Economic Type, 2012-2018
Total Revenue of Medical and Health Institutions in China, 2010-2018
Total Revenue of Medical and Health Institutions in China, 2018-2025E
Total Revenue of Hospitals in China, 2009-2018
Public Hospitals’ Inspection Revenue and % of Total Inspection Revenue in China, 2010-2018
Total Health Expenditure in China, 2010-2018
Revenue and Net Income of KingMed Diagnostics, 2014-2018
Revenue Breakdown of KingMed Diagnostics by Product, 2014-2018
Revenue Breakdown of KingMed Diagnostics by Region, 2014-2018
Gross Margin of KingMed Diagnostics by Product, 2014-2018
KingMed Diagnostics’ R&D Costs and % of Total Revenue, 2014-2018
KingMed Diagnostics’ Revenue from Top5 Clients and % of Total Revenue, 2014-2018
Independent Clinical Laboratory Subsidiaries of KingMed Diagnostics
Operating Results of Main Companies KingMed Diagnostics Controls or Has a Stake in, 2017-2018 (Unit: RMB mln)
Output, Capacity and Capacity Utilization of KingMed Diagnostics, 2014-2016
Unit Prices of Main Services of KingMed Diagnostics, 2014-2016
Revenue and Net Income of DIAN Diagnostics, 2013-2018
Revenue Breakdown of DIAN Diagnostics by Product, 2013-2018
Revenue Breakdown of DIAN Diagnostics by Region, 2013-2018
Gross Margin of DIAN Diagnostics by Business, 2013-2018
DIAN Diagnostics’ R&D Costs and % of Total Revenue, 2013-2018
DIAN Diagnostics’ Revenue from Independent Clinical Laboratory and % of Total Revenue, 2013-2018
Independent Clinical Laboratory Subsidiaries of DIAN Diagnostics
Regional Layout of Shanghai Labway Clinical Laboratory
Revenue and Net Income of Shanghai Labway Clinical Laboratory, 2013-2017
Operating Revenue Breakdown of Shanghai Labway Clinical Laboratory by Business, 2013-2017
Gross Margin of Shanghai Labway Clinical Laboratory by Business, 2013-2016
Shanghai Labway Clinical Laboratory’s R&D Costs and % of Total Revenue, 2013-2017
Independent Clinical Laboratory Subsidiaries of Shanghai Labway Clinical Laboratory
Main Diagnostic Items of Shanghai Labway Clinical Laboratory
Shanghai Labway Clinical Laboratory’s Revenue from Independent Clinical Laboratory and % of Total Revenue, 2013-2017
Revenue and Net Income of DAAN Gene, 2013-2018
Revenue Breakdown of DAAN Gene by Product, 2013-2018
Revenue Breakdown of DAAN Gene by Region, 2013-2018
DAAN Gene’s R&D Costs and % of Total Revenue, 2013-2018
DAAN Gene’s Revenue from Top 5 Clients and % in Total Revenue, 2015-2018
DAAN Gene’s Revenue from Independent Clinical Laboratory and % of Total Revenue, 2013-2018
Independent Clinical Laboratory Subsidiaries of DAAN Gene
Development Course of ADICON Clinical Laboratories
Revenue and Net Income of Nymphavn Biotechnology, 2013-2018
Revenue Breakdown of Nymphavn Biotechnology by Business, 2014-2018
Gross Margin of Nymphavn Biotechnology, 2013-2018
Nymphavn Biotechnology’s R&D Costs and % of Total Revenue, 2013-2018
Nymphavn Biotechnology’s Revenue from Independent Clinical Laboratory and % of Total Revenue, 2013-2018
Subsidiaries and Main Businesses of Surexam Biotechnology
Revenue and Net Income of SurExam Biotechnology, 2013-2018
Operating Revenue Breakdown of SurExam Biotechnology by Business, 2013-2018
Gross Margin of SurExam Biotechnology, 2013-2018
SurExam Biotechnology’s Revenue from Independent Clinical Laboratory and % of Total Revenue, 2013-2017
Revenue and Net Income of Medicalsystem Biotechnology, 2013-2018
Revenue Breakdown of Medicalsystem Biotechnology by Business, 2013-2018
Gross Margin of Medicalsystem Biotechnology by Business, 2013-2018
Medicalsystem Biotechnology’s R&D Costs and % of Total Revenue, 2013-2018
Investment Progress of Fundraising Projects of Medicalsystem Biotechnology by the end of 2018
Medicalsystem Biotechnology’s Revenue from Independent Clinical Laboratory and % of Total Revenue, 2013-2018
Financial Data of Main Independent Clinical Laboratory Subsidiaries of Medicalsystem Biotechnology, 2016-2018
Newly-established Independent Clinical Laboratory Subsidiaries of Medicalsystem Biotechnology, 2016-2018
Revenue and Net Income of Beijing Lawke Health Laboratory, 2013-2017
Revenue Breakdown of Beijing Lawke Health Laboratory by Region, 2014-2017
Gross Margin of Beijing Lawke Health Laboratory, 2013-2017
Beijing Lawke Health Laboratory’s R&D Costs and % of Total Revenue, 2013-2017
Revenue and Net Income of Beijing Lepu Gene Technology, 2013-2018
Revenue Breakdown of Beijing Lepu Gene Technology by Business, 2014-2018
Gross Margin of Beijing Lepu Gene Technology, 2013-2018
Beijing Lepu Gene Technology’s R&D Costs and % of Total Revenue, 2014-2018
Beijing Lepu Gene Technology’s Revenue from Top 5 Clients and % in Total Revenue, 2015-2018
Revenue and Net Income of Shanghai Biotecan Pharmaceuticals, 2013-2017
Revenue Breakdown of Shanghai Biotecan Pharmaceuticals by Business, 2014-2017
Gross Margin of Shanghai Biotecan Pharmaceuticals, 2013-2017
Shanghai Biotecan Pharmaceuticals’ Revenue from Independent Clinical Laboratory and % of Total Revenue, 2014-2017
Subsidiaries of Jiangsu Superbio Life Science as of Apr 2019
Revenue and Net Income of Jiangsu Superbio Life Science, 2014-2017s
Revenue Breakdown of Jiangsu Superbio Life Science by Business, 2014-2017
Gross Margin of Jiangsu Superbio Life Science, 2014-2017
Revenue and Net Income of Amoy Diagnostics, 2014-2018
Operating Revenue Breakdown of Amoy Diagnostics by Business, 2014-2018
Gross Margin of Amoy Diagnostics, 2014-2018
Gross Margin of Amoy Diagnostics by Business, 2014-2018
Clinical Laboratory Testing Service Process of Amoy Diagnostics
Main Bioassay Service Partners of Amoy Diagnostics
Amoy Diagnostics’ Revenue from Independent Clinical Laboratory and % of Total Revenue, 2014-2018
Revenue and Net Income of Guangdong Hybribio Biotech, 2014-2018
Operating Revenue Breakdown of Guangdong Hybribio Biotech by Product, 2014-2018
Gross Margin of Guangdong Hybribio Biotech by Business, 2014-2018
Guangdong Hybribio Biotech’s R&D Costs and % of Total Revenue, 2017-2018
Progress of Committed Fundraising Projects of Guangdong Hybribio Biotech by the end of 2018
Guangdong Hybribio Biotech’s Revenue from Independent Clinical Laboratory and % of Total Revenue, 2014-2018
Milestones of Kindstar Global
Some Strategic Partners of ADINOVO