Global and China Mobile Phone (Cell Phone) Assembly Industry Report, 2012-2013
-
May.2013
- Hard Copy
- USD
$2,400
-
- Pages:112
- Single User License
(PDF Unprintable)
- USD
$2,300
-
- Code:
ZYW148
- Enterprise-wide License
(PDF Printable & Editable)
- USD
$3,600
-
- Hard Copy + Single User License
- USD
$2,600
-
The report highlights: 1. Global Mobile Phone Market and Industry
2. China Mobile Phone Market and Industry
3. China Mobile Phone Export
4. 29 Mobile Phone Vendors
In 2012, the mobile phone shipment worldwide approximated 1.606 billion, a meager rise of 1.9% compared to 2011. Against the backdrop of sluggish emerging economies as well as the tenuous economic growth in Europe in 2013, the global mobile phone market is not optimistic, with the expected shipment slightly surging by 2.0% to 1.638 billion sets. Despite the fact that the growth dynamic of smartphone cannot compete with that in 2012, the smartphone shipment in 2013 is expected to exceed that of normal phones for the first time. Looking into 2014, emerging markets are still sluggish and, are greatly likely to see further downward mobility. By contrast, developed economies such as Japan and America are projected to witness stable growth momentum. And it is the same case for Europe whose mobile phone shipment is estimated to hit 1.688 billion sets by 2014.
In 2012, the smartphone shipment worldwide approximated 787 million sets, up 51.3% over 2011. The estimate shows that the figure in 2013 will be 950 million sets, up 20.7% over 2012. In 2013, smartphone is expected to make up 58% of the overall mobile phone market.
In 2012, the mobile phone output on Chinese mainland claimed around 1.210 billion, up 9.2% over 2011. Worldwide, 75% mobile phones are made in the mainland China, in 2011, the figure recorded 70%. It is projected that China’s mobile phone output in 2013 will reach 1.28 billion sets, up 5.8% over 2012. In 2012, the mobile phone export volume on Chinese mainland amounted to 1.015 billion sets, of which, at least 10% were resold to mainland China. In China, mobile phone export destinations concentrate in Hong Kong, South Korea, America, EU, ASEAN, India and Mexico. In 2012, the export to Japan came out top in terms of growth, rising by 63%, followed by South Korea (by 39%), Hong Kong (by 30%), and America (by 25%). In particular, China’s mobile phone export to the EU grew by 3.6%, while the export to India dived by 18%.
Shipment of Top 18 Mobile Phone Companies in China, 2013Q1(Unit: 1,000 sets)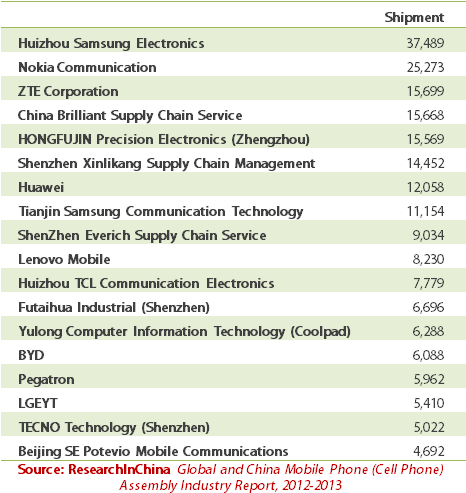
Supply chain companies maintained robust growth momentum, with the export volume in 2012 increased by around 90% over 2011 to 192 million. And the export volume of China Brilliant Supply Chain Service, ShenZhen Everich Supply Chain Service, First Flag, Shenzhen Xinlikang Supply Chain Management and Shenzhen Prolto Supply Chain Management all exceeded 10 million sets. In particular, Shenzhen Xinlikang Supply Chain Management realized the export volume as high as 62.25 million sets in 2012, compared to 4.24 million sets in 2011.
1. Global Mobile Phone Market
1.1 Global Mobile Phone Market Scale
1.2 Mobile Phone Market Occupancy by Brand
1.3 Smartphone Market and Industry
2. China Mobile Phone Industry
2.1 China Mobile Phone Industry by Region
2.2 Ranking of Chinese Mobile Phone Companies by Output
2.3 Business Model of Chinese Mobile Phone Vendors
2.4 Mobile Phone Manufacturing Under the Supply Chain Outsourcing Model
2.4.1 China Brilliant Supply Chain Service Co., Ltd.
2.4.2 First Flag
3. China Mobile Phone Export
3.1 China Mobile Phone Export Scale
3.2 China Mobile Phone Export Features
3.3 China Mobile Phone Export by Region
4. Mobile Phone Vendors
4.1 Nokia
4.2 Motorola
4.3 Samsung
4.4 Sony
4.5 LG
4.6 RIM
4.7 Apple
4.8 HTC
4.9 TCL Communication Technology
4.10 Compal Communications Inc
4.11 Arima Communications
4.12 FIH
4.13 BYD
4.14 Flextronics
4.15 ZTE
4.16 Huawei
4.17 Lianchengwen Technology
4.18 Dongguan Inflight Electronic
4.19 CK Telecom
4.20 G’Five International
4.21 Beny Wave
4.22 Longcheer
4.23 Konka
4.24 Huabel Electronic & Technology (HuaQin Photoelectric Technology)
4.25 Z-OBEE
4.26 Shenzhen Newchabridge Communication
4.27 Yulong Computer Telecommunication Scientific
4.28 Shenzhen Zhenhua Communication Equipment
4.29 TINNO Corporation
Global Mobile Phone Shipment, 2007-2014
Global CDMA/WCDMA Mobile Phone Shipment by Region, 2010-2013
Quarterly Mobile Phone Shipment by Brand, 2010-2011
Shipment of Major Mobile Phone Vendors Worldwide, 2011-2012
Global Smartphone Operating System, 2012Q4
Shipment of Major Smartphone Vendors in China, 2011-2012
China Mobile Phone Output by Region, 2012
Ranking of 25 Chinese Mobile Phone Companies by Output, 2010-2012
China’s Top 50 Mobile Phone Companies by Export, 2013Q1
Mobile Phone Shipment of Supply Chain Outsourcing Companies, 2010-2012
Organization of China Brilliant Supply Chain Service Co., Ltd
Major Clients of China Brilliant Supply Chain Service Co., Ltd
Mobile Phone Export Volume and Growth Rate in China, 2000-2012
Mobile Phone Export Value and Growth Rate in China, 2002-2012
Mobile Phone Export Volume and ASP in China, 2002-2012
Mobile Phone Export Volume and Average Price in China, Jan.2010-Dec.2011
China’s Top 10 Mobile Phone Export Destinations by Shipment, 2011-2012
Mobile Phone Shipment and Growth Rate of Nokia, 2003-2013
Quarterly Mobile Phone Shipment of Nokia by Region, 2010Q1-2011Q4
Quarterly Smartphone Shipment of Nokia, 2010Q1-2013Q1
Sales and Operating Margin of Nokia, 2011Q1-2013Q1
Shipment and ASP of Nokia, 2011Q1-2013Q1
Smartphone Shipment and ASP of Nokia, 2011Q1-2013Q1
Normal Phone Shipment and ASP of Nokia, 2011Q1-2013Q1
Mobile Phone Shipment of Nokia by Region, 2011Q1-2013Q1
Sales of Nokia Mobile Phone by Region, 2011Q1-2013Q1
Mobile Phone Output of Nokia by Region, 2010-2011
Quarterly Sales and Operating Margin of Motorola Mobile Phone, 2010Q1-2013Q1
Quarterly Sales and Shipment of Motorola Mobile Phone, 2010Q1-2013Q1
Quarterly Shipment and Operating Margin of Motorola Mobile Phone, 2010Q1-2011Q4
Output of Motorola Mobile Phone by Region, 2010-2012
Shipment and Annual Growth Rate of Samsung Mobile Phone, 2001-2013
Shipment and Operating Margin of Samsung Mobile Phone, 2010Q1-2013Q1
ASP and Shipment of Samsung Mobile Phone, 2010Q1-2013Q1
Output of Samsung Mobile Phone by Region, 2010-2012
Shipment of Sony Mobile Phone, 2010Q1-2012Q4
Shipment and Average Selling Price of Sony Ericsson Mobile Phone, 2010Q1-2011Q4
Sales and Operating Margin of Sony Ericsson, 2010Q1-2011Q4
Shipment and Gross Margin of Sony Ericsson, 2009Q3-2011Q4
Output of Sony Ericsson Mobile Phone by Plant, 2010-2012
Shipment and Annual Growth Rate of LG Mobile Phone, 2002-2013
Sales and Operating Margin of LG Mobile Phone, 2010Q1-2013Q1
Shipment and Operating Margin of LG Mobile Phone, 2010Q1-2013Q1
LG Mobile Phone Output by Region, 2010-2012
Revenue, Gross Margin and Operating Margin of RIM, FY2004-FY2013
Revenue of RIM by Business, FY2005-FY2013
Shipment of RIM Mobile Phone, FY2005-FY2013
Shipment of RIM Mobile Phone , FY2010Q2-FY2013Q4
Revenue of RIM by Region, FY2010-FY2011
Revenue of RIM by Region, FY2013
OEM Structure of RIM, 2010-2012
Revenue and Net Profit Margin of APPLE, FY2004-FY2013
Revenue of APPLE by Region, FY2004-FY2012
Revenue of APPLE by Product, FY2007-FY2012
Sales Volume of IPOD, IPAD and IPHONE, FY2004-FY2011
IPHONE Shipment of Apple, 2008Q1-2011Q4
Revenue and Gross Margin of HTC, 2003-2013
Shipment and Average Price of HTC, 2004-2013
Quarterly Shipment of HTC, 2009Q1-2013Q1
Revenue of HTC by Region, 2006-2011
Ownership of TCL Communication
Organization of TCL Communication
Global Distribution of TCL
Revenue and Gross Margin of TCL Communication, 2002-2012
Monthly Mobile Phone Shipment of TCL Communication, Jan.2008-Mar.2013
Revenue of TCL by Product, 2010Q1-2012Q4
Sales Volume of Smartphone of TCL Communication, 2011Q1-2012Q4
Mobile Phone Shipment of TCL Communication, 2006-2012
Mobile Phone Shipment of TCL Communication by Region, 2006-2012
Revenue of TCL Communication by Region
Revenue and Gross Margin of Compal Communications, 2004-2013
Monthly Revenue and Growth Rate of Compal Communications, Mar.2011-Mar.2013
Mobile Phone Shipment and Average Selling Price of Compal Communications, 2004-2013
Global Layout of Arima Communications
Revenue and Gross Margin of Arima Communications, 2005-2013
Monthly Revenue and YoY Growth Rate of Arima Communications, Mar.2011-Mar.2013
Mobile Phone Shipment and Growth Rate of Arima Communications, 2003-2013
Investment of Arima Communications on Chinese Mainland
Revenue and Operating Margin of FIH, 2003-2011
Revenue of FIH by Region, 2005-2012
Customers of FIH, 2012
Shipment of Major Subsidiaries under FOXCONN (Hon Hai), 2010-2012
Revenue and Gross Margin of BYD Electronic, 2004-2013
Revenue of BYD Electronic by Region, 2006-2012
Revenue of BYD Electronic by Business, 2006-2012
Revenue of BYD Electronic by Client, 2009-2011
Revenue of Flextronics, FY1995-FY2013
Revenue of Flextronics by Business, 2010Q4-2012Q4
Employees of Flextronics by Region, FY2012
Zhuhai Doumen Industrial Park
Customer Structure of Flextronics, FY2010
Terminal Revenue and Gross Margin of ZTE, 2006-2011
Mobile Phone Shipment of ZTE, 2006-2013
OEM Distribution of ZTE, 2012
Mobile Phone Shipment and Growth Rate of Huawei, 2006-2013
OEM Distribution of Huawei, 2011
Organization of Longcheer
Revenue and Operating Margin of Longcheer, FY2006-FY2013
Revenue of Longcheer by Region, FY2010-FY2012
Revenue and Gross Margin of KONKA Mobile Phone, 2006-2012
Revenue and Operating Income of ZOBEE, FY2008-FY2013
Revenue of Z-OBEE by Business, FY2008-FY2012
Revenue and Net Profit Margin of Yulong Computer Telecommunication Scientific, 2004-2013
Mobile Phone Shipment and ASP of Coolpad, 2009-2013
Revenue and Operating Margin of Shenzhen Zhenhua Communication Equipment, 2005-2011
Ownership Structure of TINNO Corporation
Revenue and Operating Income of TINNO Corporation, 2009-2012
Mobile Phone Shipment of TINNO Corporation by Region, 2012
Major Clients of TINNO Corporation
Market Occupancy of TINNO Corporation’s Clients in their Localities
Global and China RF Coaxial Cable Industry Report, 2019-2025
Global market:As the rapid application of 5G to areas from internet of things (IoT) to wireless communications across the world fuels demand for RF coaxial cables (especially for fine/ultrafine produc...
Global and China RF Coaxial Cable Industry Report, 2018-2022
Benefitted from fast development of downstream sectors, and constant increase of category and technology requirement of RF coaxial cable from high-end equipment, the market size of RF coaxial cable sw...
Global and China RF Coaxial Cable Industry Report, 2015-2018
RF coaxial cable, a general term for coaxial cables that transmit electrical signal or energy within radio frequency range, is mainly used in communications equipment, communications terminals, aerosp...
Global and China RF Coaxial Cable Industry Report, 2014-2017
Benefiting from a surge in mobile phone users and gradual replacement of 2G by 3G and 4G in developing countries, global RF coaxial cable market size has been growing, registering an average annual gr...
Global and China Mobile Phone (Cell Phone) Assembly Industry Report, 2012-2013
The report highlights: 1. Global Mobile Phone Market and Industry 2. China Mobile Phone Market and Industry 3. China Mobile Phone Export &...
Global and China Mobile (Cell) Phone Assembly Industry Report, 2011-2012
In 2011, the mobile phone output in China increased by 15.5% over 2010 to 1.172 billion sets, among which, the export volume rose by 13.9% over 2010 to 885 million sets, with the export value climbed ...
Latin America Telecommunication Market Report, 2010-2011
Latin America is a potential market with a population and GNP over 580 million and USD2.3 trillion respectively. Telecommunication industry has started reformation since 1980s and gradually realized p...