China Automotive Distribution Industry and Automotive Aftermarket Report,2014-2017
-
Mar./2014
- Hard Copy
- USD
$2,600
-
- Pages:169
- Single User License
(PDF Unprintable)
- USD
$2,400
-
- Code:
WLQ011
- Enterprise-wide License
(PDF Printable & Editable)
- USD
$3,800
-
- Hard Copy + Single User License
- USD
$2,800
-
In 2013, the sales volume of automobiles in China reached 21.9841 million units, up 13.89% year on year compared with 2.72% in 2011 and 4.15% in 2012. Of all, the sales volume of passenger cars was 17.9289 million units, up 15.72% from a year earlier, and with its proportion in vehicle sales further raised to 81.55%.
In 2013, the trading volume of second-hand vehicle in China amounted to 5.2033 million units, up 8.6% year on year; the turnover of second-hand vehicle trading was RMB291.649 billion, rising 10.6% from a year earlier. Over the same period, the ratio of second-hand vehicle to new cars in sales volume was 0.24, and the sales volume of second-hand vehicle made up 19.1%, compared with 72.4% in the US, where the ratio of second-hand vehicle to new cars in sales volume stood at 2.6.
In 2013, China’s automotive distribution industry characterizes the followings:
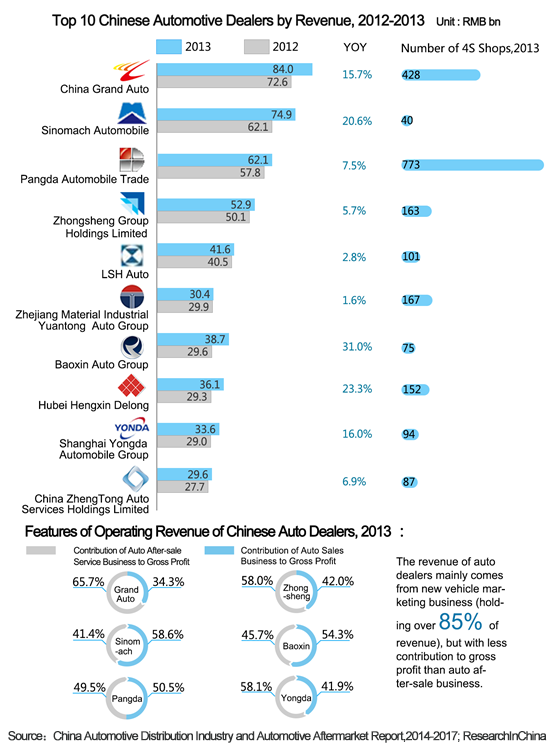
(1) Revenue of car dealers mainly comes from the sales of new cars.
In 2013, the sales volume of new cars in China accounted for 80.9% of the total sales (including new cars and second-hand vehicle); the new car sales of dealers occupied more than 85% of their total revenue, while in America over the same period, the sales volume of new cars made up 27.6% of the total, and the new car sales of dealers accounted for 57.1% of the total revenue.
(2) Dealers have a long way to go in expanding second-hand vehicles business.
In 2013, the dealers’ revenue from second-hand vehicles accounted for less than 3% of their total revenue, and this proportion in the U.S stood at 31.3% for the same period. Therefore, contribution of second-hand vehicles to gross profit of Chinese dealers was obviously inadequate, with gross profit of Chinese dealers from second-hand vehicles in 2013 accounting for 7%; and this figure in America during the same period came to as high as 26%.
(3) With higher gross margin in automotive aftermarket, dealers speed up transformation.
In 2013, China's revenue in auto after-sales service sector accounted for a small proportion, at less than 12%, but with larger contribution to gross profit (above 45%). Many dealers has accelerated the transition towards aftermarket, these dealers including PANG DA Automobile Trade and Xianglong Borui, which has provided such service items as second-hand vehicles, finance and insurance. In particular, Zhongsheng Group is planning a nationwide establishment of 500 terminal service chains that are independent from 4S system.
In future, with slowdown in growth of automotive market and the declining before-sales profit of vehicles, carmakers and dealers will shift their focus to developing automotive aftermarket. Meanwhile, as private cars surge and car owners’ concept of “car maintenance rather than repairing” gains popularity, automotive aftermarket has shown great potential, which implies that it is beginning to step into a golden period of development.
China Automotive Distribution Industry and Automotive Aftermarket Report, 2014-2017 involves the following:
 Market overview of automotive distribution and automotive aftermarket (including development course, distribution mode, market situation and development tendency)
Sales market of new vehicle in China (including overall market, passenger cars and market segments, commercial vehicles and market segments, price trends, etc)
Second-hand car market in China (including market situation, distribution pattern, overall market, market segments and regional market trade, deal structure, and development outlook, etc.)
China automotive aftermarket (including automotive supplies market, car maintenance, auto consumption credit, financing leasing, and car insurance market)
Operation of 11 listed car dealers in China (including profile, revenue, net income, net profit margin, revenue structure, gross profit structure, gross margin, distribution network and auto sales volume, etc.)
1 Automotive Distribution and Automotive Aftermarket
1.1 Development History
1.2 Automotive Distribution Pattern
1.2.1 Automotive Distribution Channel
1.2.2 Distribution Channel Pattern
1.2.3 Imported Car Distribution Pattern
1.3 Automotive Aftermarket
1.3.1 Market Situation
1.3.2 Main Channels
1.4 Development Trend
2 Sales Market of New Cars in China
2.1 Automobile Market
2.1.1 Production and Sales
2.1.2 Imports
2.2 Passenger Vehicle
2.2.1 Overall Market Sales Volume
2.2.2 Market Segments (by Auto Model)
2.2.3 Imports
2.2.4 Premium and Super-luxury Passenger Vehicle
2.3 Commercial Vehicle
2.3.1 Sales Volume in Overall Market
2.3.2 Sales Volume in Market Segments
2.3.3 Imports
2.4 Price Trend
2.4.1 Overall Price
2.4.2 Price for Passenger Vehicle
3 Second-hand Vehicle Market in China
3.1 Market Situation
3.2 Distribution Pattern
3.3 Trading Volume
3.3.1 Overall Market
3.3.2 Market Segments
3.3.3 Regional Market
3.3.4 Deal Structure
3.4 Turnover
3.4.1 Overall Market
3.4.2 Market Segments
3.5 Development Prospects
4 Overview and Competition Pattern of Automobile Dealers in China
4.1 Market Situation
4.2 Distribution Pattern
4.2.1 Passenger Vehicle Distribution Pattern
4.2.2 Commercial Vehicle Distribution Pattern
4.3 Profit Model
4.4 Competition Pattern
4.4.1 Operational Characteristics of Top 100 Enterprises
4.4.2 Enterprise Competition
4.4.3 Regional Competition
5 China Automotive Aftermarket
5.1 Automotive Aftermarket
5.1.1 Profile
5.1.2 Development Prospects
5.2 Auto Supplies Market
5.2.1 Market Situation
5.2.2 Market Size
5.3 Vehicle Maintenance
5.3.1 Business Model
5.3.2 Competitiveness in Maintenance of Car Dealers
5.3.3 Market Demand
5.4 Automobile Consumption Credit
5.5 Financial Leasing
5.6 Automobile Insurance
6 Majors Automotive Dealers in China
6.1 Pangda Automobile
6.1.1 Profile
6.1.2 Business Model and Profit Model
6.1.3 Operating Performance
6.1.4 Revenue Structure
6.1.5 Gross Profit Structure and Gross Margin
6.1.6 Distribution Network and Auto Sales Volume
6.1.7 Performance Expectations
6.2 Sinomach Automobile
6.2.1 Profile
6.2.2 Operating Performance
6.2.3 Revenue Structure
6.2.4 Gross Profit Structure and Gross Margin
6.2.5 Imported Car Business
6.2.6 Performance Expectations
6.3 Zhongsheng Group
6.3.1 Profile
6.3.2 Operating Performance
6.3.3 Revenue Structure
6.3.4 Gross Profit Structure and Gross Margin
6.3.5 Distribution Network and Automobile Sales Volume
6.3.6 Performance Expectations
6.4 DCH
6.4.1 Profile
6.4.2 Operating Performance
6.4.3 Revenue Structure
6.4.4 Gross Profit and Gross Margin
6.4.5 Distribution Network and Auto Sales Volume
6.4.6 Performance Expectations
6.5 Zhongda Yuantong Group
6.5.1 Profile
6.5.2 Operating Performance
6.5.3 Revenue Structure
6.5.4 Gross Profit Structure and Gross Margin
6.5.5 Distribution Network and Auto Sales Volume
6.5.6 Performance Expectations
6.6 ZhengTong Auto
6.6.1 Profile
6.6.2 Operating Performance
6.6.3 Revenue Structure
6.6.4 Gross Profit Structure and Gross Margin
6.6.5 Distribution Network and Auto Sales Volume
6.6.6 Performance Expectations
6.7 Baoxin Auto Group
6.7.1 Profile
6.7.2 Operating Performance
6.7.3 Revenue Structure
6.7.4 Gross Profit Structure and Gross Margin
6.7.5 Distribution Network and Auto Sales Volume
6.7.6 Performance Expectations
6.8 Yongda Auto
6.8.1 Profile
6.8.2 Operating Performance
6.8.3 Revenue Structure
6.8.4 Gross Profit Structure and Gross Margin
6.8.5 Distribution Network and Auto Sales Volume
6.8.6 Performance Expectations
6.9 Grand Orient
6.9.1 Profile
6.9.2 Operating Performance
6.9.3 Revenue Structure
6.9.4 Gross Profit Structure and Gross Margin
6.9.5 Performance Expectations
6.10 Lentuo Group
6.10.1 Profile
6.10.2 Operating Performance
6.10.3 Revenue Structure
6.10.4 Gross Profit Structure and Gross Margin
6.11 Yaxia Automobile
6.11.1 Profile
6.11.2 Operating Performance
6.11.3 Revenue Structure
6.11.4 Gross Profit Structure and Gross Margin
6.11.5 Distribution Network
6.11.6 Performance Expectations
7 Summary and Forecast
7.1 Comparison of Auto Sales Volume
7.1.1 Passenger Vehicle and Commercial Vehicle
7.1.2 New Cars and Second-hand vehicle
7.2 Comparison of Corporate Operation
7.2.1 Revenue
7.2.2 Net Income
7.2.3 Revenue Structure
7.2.4 Gross Profit Structure
7.2.5 Gross Margin
7.2.6 Distribution Network
7.2.7 Auto Sales Volume
Development History of Automotive Distribution in China
Major Means of Automotive Distribution in China
Comparison: Characteristics of Different Automotive Distribution Modes
Comparison: Business Model of Imported Cars and China-made Cars
Automotive Aftermarket Segments
Production and YoY Growth Rate of Vehicles in China, 2007-2017E
Sales Volume and YoY Growth Rate of Vehicles in China, 2007-2017E
Sales Volume Structure of Vehicles in China, 2007-2017E
Import Volume and YoY Growth Rate of Vehicles in China, 2007-2017E
Import Value and YoY Growth Rate of Vehicles in China, 2007-2013
Import Unit Price and YoY Growth Rate of Vehicles in China, 2007-2013
Structure for Import Volume of Vehicles in China, 2007-2013
Structure for Import Value of Vehicles in China, 2007-2013
Sales Volume and YoY Growth Rate of Passenger Vehicle in China, 2007-2017E
Sales Share for Sundry Brands of Passenger Vehicle in China, 2008-2013
Top 10 Carmakers in Sales Volume of Passenger Vehicle in China, 2008-2013
Sales Share for Segmented Products of Passenger Vehicle in China, 2007-2017E
Sales Volume and YoY Growth Rate of Basic Passenger Vehicle in China, 2007-2017E
Sales Volume and YoY Growth Rate of SUVs in China, 2007-2017E
Sales Volume and YoY Growth Rate of MPVs in China, 2007-2017E
Sales Volume and YoY Growth Rate of Cross Passenger Vehicle in China, 2007-2017E
Import Volume and YoY Growth Rate of Passenger Vehicle in China, 2007-2013
Import Value and YoY Growth Rate of Passenger Vehicle in China, 2007-2013
Import Volume and Import Value of Sedans in China, 2007-2013
Import Volume and Import Value of Four-Wheel Drive Off-road Vehicles in China, 2007-2013
Import Shares of Sedans and Four-Wheel Drive Off-road Vehicles in China, 2007-2013
Top 10 Origins in Import Value of Passenger Vehicle by Country and Their Market Shares, 2013
Top 10 Destinations in Import Value of Passenger Vehicles by Province/Municipality and Their Market Shares, 2013
Sales Volume and YoY Growth Rate in China of Premium and Super-luxury Passenger Vehicles, 2007-2013
Sales Volume and YoY Growth Rate in China of Premium Passenger Vehicle by Brand, 2013
Sales Volume and YoY Growth Rate in China of Super-luxury Passenger Vehicles by Brand, 2013
Sales Volume and YoY Growth Rate of Commercial Vehicle in China, 2007-2017E
Sales Share for Segmented Products of Commercial Vehicle in China, 2007-2013
Sales Volume and YoY Growth Rate of Freight Cars in China, 2007-2013
Percentage of Sales Volume of Freight Car Segments in China, 2007-2013
Sales Volume and YoY Growth Rate of Coaches in China, 2007-2013
Percentage of Sales Volume of Coach Segments in China, 2007-2013
Import Volume and YoY Growth Rate of Commercial Vehicle in China, 2007-2013
Import Value and YoY Growth Rate of Commercial Vehicle in China, 2007-2013
Import Unit Price and YoY Growth Rate of Commercial Vehicle in China, 2007-2013
Trend for Price Change of Vehicles in China by Month, 2011-2013
Trend for Price Change of AO0-Class, AO-Class and A-Class Vehicles in China by Month, 2011-2013
Trend for Price Change of B-Class and C-Class Sedan in China by Month, 2011-2013
Trend for Price Change of MPV and SUV in China by Month, 2011-2013
Development Stages of Second-hand Vehicle Market
Main Trade Modes for Second-hand Vehicles in China
Trade Modes for Second-hand Vehicles in Major Countries
Trading Volume and YoY Growth Rate of Second-hand Vehicles in China, 2007-2013
Percentage for Trading Volume of Second-hand Vehicles in China by Model, 2008-2013
Trading Volume of Second-hand Vehicles in China by Region and Province, 2008-2013
Percentage for Trading Volume of Second-hand Vehicles in China by Region and Province, 2008-2013
Percentage for Direct Trading Volume and Appointed Trading Volume of Second-hand Vehicles in China, 2008-2013
Percentage for Locally Trading Volume and Ownership Transferred Trading Volume for Second-hand Vehicles in China, 2008-2013
Percentage for Trading Volume for Private Cars and Public Cars in China’s Second-hand Car Market, 2008-2013
Percentage for Trading Volume for China-made Cars and Imported Cars in China’s Second-hand Car Market, 2008-2013
Percentage for Trading Volume of Second-hand Vehicles with Different Service Life in China, 2008-2013
Trading Value and YoY Growth Rate of Second-hand Vehicles in China, 2007-2013
Average Trading Price and YoY Growth Rate of Second-hand Vehicles in China, 2007-2013
Trading Value and Average Trading Price for Different Models in China’s Second-hand Car Market, 2011-2013
Proportion of Sales Volume of Second-hand Vehicles and New Vehicles in China, 2007-2013
Automotive Ownership and YoY Growth Rate in China, 2007-2013
Ratio of Second-hand Vehicle Sales Volume to Automotive Ownership in China, 2007-2013
Trading Volume and YoY Growth Rate of Second-hand Vehicles in China, 2014-2017E
Number of 4S Shops in China, 2008-2017E
Procedures for Constructing Passenger Car 4S Shops in China
Cost Structure for Constructing 4S Shops
Service Scope of Automotive Distribution in China
Profit Model of New Car Sales of Dealers in China
Comparison of Dealers’ Profitability from Different Car Models
Total Revenue and YoY Growth Rate of Top 100 Dealers in China, 2010-2013
Revenue Structure of Auto Dealers from China and the United States
Profit Structure of Auto Dealers from China and the United States, 2012
Revenue and Net Income of Auto Dealers from the United States, 2007-2013
Revenue Structure of Auto Dealers from the United States, 2007-2013
Gross Margin and Net Profit Margin of Auto Dealers from the United States, 2007-2013
Net Income Structure of Auto Dealers from the United States, 2002-2012
Top 10 China’s Auto Dealers by Turnover, 2009-2012
Auto Sales Volume, Market Share and Sales Unit Price of Top 20 China’s Auto Dealers by Turnover, 2012
Characteristics of Regional Layout of 4S Shops under Major Chinese Auto Dealers
Profit Model of After-sales Service for Autos in China
Market Size and YoY Growth Rate of Auto Supplies in China, 2010-2017
Scale and Shares of Auto Supplies Market Segments in China, 2012-2013
Auto Supplies Market Size by Region in China, 2012-2013
Business Model for Auto Maintenance in China
Cycle for Updating Some Auto Spare Parts
Automobile Consumption Credit Marke Size and YoY Growth Rate, 2007-2012
Penetration Rate of Automobile Consumption Credit in Major Countries, 2013
Penetration Rate of Major Auto Brand Credit, 2013
Major Car Makers and Dealers with Financial Leasing Business
Premium Income and YoY Growth Rate of Motor Vehicles in China, 2007-2012
Premium Income of Major Motor Vehicle Insurance Companies in China, 2007-2012
Auto Procurement Model of 4S Shops of Pangda Automobile
Auto Sales Model of 4S Shops of Pangda Automobile
Profit Model of 4S Shops of Pangda Automobile
Revenue and YoY Growth Rate of Pangda Automobile, 2008-2013
Net Income and YoY Growth Rate of Pangda Automobile, 2008-2013
Net Profit Margin of Pangda Automobile, 2008-2013
Revenue Structure of Pangda Automobile by Business, 2008-2013
Auto Sales Structure of Pangda Automobile by Product, 2008-2013
Gross Profit Structure of Pangda Automobile by Business, 2008-2013
Gross Margin of Pangda Automobile by Business, 2008-2013
Gross Margin of Auto Sales Business of Pangda Automobile by Product, 2008-2013
Number of Auto Sales Outlets, 4S Shops and Auto Markets of Pangda Automobile, 2010-2013
Auto Sales Volume and YoY Growth Rate of Pangda Automobile, 2008-2013
Revenue and YoY Growth Rate of Pangda Automobile, 2013-2017
Revenue and YoY Growth Rate of Sinomach Automobile, 2008-2013
Net Income and YoY Growth Rate of Sinomach Automobile, 2008-2013
Net Profit Margin of Sinomach Automobile, 2008-2013
Revenue Structure of Sinomach Automobile by Business, 2008-2013
Revenue Structure of Sinomach Automobile by Region, 2008-2013
Gross Profit Structure of Sinomach Automobile by Business, 2008-2013
Gross Margin of Sinomach Automobile by Business, 2008-2013
Gross Margin of Sinomach Automobile by Region, 2008-2013
Market Share of Imported Vehicles of Sinomach Automobile, 2008-2013
Revenue and YoY Growth Rate of Sinomach Automobile, 2013-2017
Revenue and YoY Growth Rate of Zhongsheng Group, 2008-2013
Net Income and YoY Growth Rate of Zhongsheng Group, 2008-2013
Net Profit Margin of Zhongsheng Group, 2008-2013
Revenue Structure of Zhongsheng Group by Business, 2008-2013
Gross Profit Structure of Zhongsheng Group by Business, 2008-2013
Gross Margin of Zhongsheng Group by Business, 2008-2013
Regional Distribution of 4S Shops of Zhongsheng Group, 2009-2013
Sales Volume and YoY Growth Rate of New Vehicles of Zhongsheng Group, 2008-2013
Revenue and YoY Growth Rate of Zhongsheng Group, 2013-2017
Revenue and YoY Growth Rate of DCH, 2008-2013
Net Income and YoY Growth Rate of DCH, 2008-2013
Net Profit Margin of DCH, 2008-2013
Revenue Structure of DCH by Business, 2008-2013
Auto Business Revenue of DCH by Region, 2009-2013
Gross Profit and YoY Growth Rate of DCH, 2008-2013
Gross Margin and YoY Growth Rate of DCH, 2008-2013
4S Shops and YoY Growth Rate of DCH in Mainland China, 2008-2013
Auto Sales Volume of DCH in Mainland China, 2008-2013
Revenue and YoY Growth Rate of DCH, 2013-2017E
Revenue and YoY Growth Rate of Zhongda Yuantong Group, 2008-2013
Net Income and YoY Growth Rate of Zhongda Yuantong Group, 2008-2013
Net Profit Margin of Zhongda Yuantong Group, 2008-2013
Revenue Structure of Zhongda Yuantong Group by Business, 2011-2013
Gross Profit Structure of Zhongda Yuantong Group by Business, 2011-2013
Gross Margin of Zhongda Yuantong Group by Business, 2011-2013
Distribution of Auto Sales Network of Zhongda Yuantong Group, 2013
Sales Volume and YoY Growth Rate of New Vehicles of Zhongda Yuantong Group, 2009-2013
Revenue and YoY Growth Rate of Zhongda Yuantong Group, 2013-2016E
Revenue and YoY Growth Rate of ZhengTong Auto, 2008-2013
Net Income and YoY Growth Rate of ZhengTong Auto, 2008-2013
Net Profit Margin of ZhengTong Auto, 2008-2013
Revenue Structure of ZhengTong Auto by Business, 2008-2013
Gross Profit Structure of ZhengTong Auto by Business, 2008-2013
Gross Margin of ZhengTong Auto by Business, 2008-2013
Number of 4S Shops and YoY Growth Rate of ZhengTong Auto, 2009-2013
Number of 4S Shops of ZhengTong Auto by Province and Brand, 2013
Sales Volume of New Vehicles of ZhengTong Auto, 2010-2013
Revenue and YoY Growth Rate of ZhengTong Auto, 2013-2014
Revenue and YoY Growth Rate of Baoxin Auto Group, 2008-2013
Net Income and YoY Growth Rate of Baoxin Auto Group, 2008-2013
Net Profit Margin of Baoxin Auto Group, 2008-2013
Revenue Structure of Baoxin Auto Group by Business, 2008-2013
Gross Profit Structure of Baoxin Auto Group by Business, 2008-2013
Gross Margin of Baoxin Auto Group by Business, 2008-2013
Number of Sales Outlets of Baoxin Auto Group by Brand, 2013
Auto Sales Volume of Baoxin Auto Group by Brand, 2008-2013
Revenue and YoY Growth Rate of Baoxin Auto Group, 2013-2017E
Revenue and YoY Growth Rate of Yongda Auto, 2009-2013
Net Income and YoY Growth Rate of Yongda Auto, 2009-2013
Net Profit Margin and YoY Growth Rate of Yongda Auto, 2009-2013
Revenue Structure of Yongda Auto by Business, 2009-2013
Gross Profit Structure of Yongda Auto by Business, 2009-2013
Gross Margin of Yongda Auto by Business, 2009-2013
Number of Outlets and YoY of Yongda Auto, 2009-2013
Sales Volume and YoY Growth Rate of Passenger Cars of Yongda Auto, 2009-2013
Revenue and YoY of Yongda Auto, 2013-2017
Revenue and YoY Growth Rate of Grand Orient, 2008-2013
Net Income and YoY Growth Rate of Grand Orient, 2008-2013
Net Profit Margin of Grand Orient, 2008-2013
Revenue Structure of Grand Orient by Business, 2008-2013
Auto Business Revenue and YoY Growth Rate of Grand Orient, 2008-2013
Gross Profit Structure of Grand Orient by Business, 2008-2013
Gross Margin of Grand Orient by Business, 2008-2013
Auto Business Revenue and YoY Growth Rate of Grand Orient, 2013-2017E
Revenue and YoY Growth Rate of Lentuo Group, 2008-2013
Net Income and YoY Growth Rate of Lentuo Group, 2008-2013
Net Profit Margin of Lentuo Group, 2008-2013
Revenue Structure of Lentuo Group by Business, 2008-2013
Revenue Structure of Lentuo Group by Auto Brand, 2010-2013
Gross Profit Structure of Lentuo Group by Business, 2008-2012
Gross Margin of Lentuo Group by Business, 2008-2012
Sales Volume, Gross Margin and Sales Unit Price for Different Auto Brands of Lentuo Group, 2010-2012
Revenue and YoY Growth Rate of Yaxia Automobile, 2008-2013
Net Income and YoY Growth Rate of Yaxia Automobile, 2008-2013
Net Profit Margin of Yaxia Automobile, 2008-2013
Revenue Structure of Yaxia Automobile by Business, 2008-2013
Revenue Structure of Yaxia Automobile by region, 2011-2013
Gross Profit Structure of Yaxia Automobile, 2008-2013
Gross Margin of Yaxia Automobile by Business, 2008-2013
Number of 4S Shops and YoY Growth Rate of Yaxia Automobile, 2008-2013
Auto Sales Volume and YoY Growth Rate of Yaxia Automobile, 2008-2013
Revenue and YoY Growth Rate of Yaxia Automobile, 2013-2017E
Comparison: Sales Volume of Passenger Vehicle and Commercial Vehicle in China, 2007-2017E
Comparison: Growth Rates for Sales Volume of Passenger Vehicle and Commercial Vehicle in China, 2008-2017E
Comparison: Sales Volume of New Cars and Second-hand Vehicles in China, 2007-2017E
Comparison: Growth Rates for Sales Volume of New Cars and Second-hand Vehicles in China, 2008-2017E
Comparison: Revenue of Listed Companies in China’s Automotive Distribution Industry, 2008-2013
Comparison: Growth Rates for Revenue of Listed Companies in China’s Automotive Distribution Industry, 2009-2013
Comparison: Net Income of Listed Companies in China’s Automotive Distribution Industry, 2008-2013
Comparison: Growth Rates for Net Income of Listed Companies in China’s Automotive Distribution Industry, 2009-2013
Comparison: Net Profit Margin of Listed Companies in China’s Automotive Distribution Industry, 2008-2013
Percentage of Auto Sales Business Revenue of Listed Companies in China’s Automotive Distribution Industry, 2008-2013
Percentage of Auto After-Sale Service Business Revenue of Listed Companies in China’s Automotive Distribution Industry, 2008-2013
Contribution of Auto Sales Business to Gross Profit of Listed Companies in China’s Automotive Distribution Industry, 2008-2013
Contribution of Auto After-Sale Service Business to Gross Profit of Listed Companies in China’s Automotive Distribution Industry, 2008-2013
Comparison: Integrated Gross Margin of Listed Companies in China’s Automotive Distribution Industry, 2008-2013
Comparison: Gross Margin of Auto Sales Business of Listed Companies in China’s Automotive Distribution Industry, 2008-2013
Comparison: Gross Margin of Auto After-Sale Service Business of Listed Companies in China’s Automotive Distribution Industry, 2008-2013
Comparison: Number of 4S Shops of Listed Companies in China’s Automotive Distribution Industry, 2008-2013
Comparison: Auto Sales Volume of Listed Companies in China’s Automotive Distribution Industry, 2008-2013
Autonomous Driving Domain Controller and Central Computing Unit (CCU) Industry Report, 2025
Research on Autonomous Driving Domain Controllers: Monthly Penetration Rate Exceeded 30% for the First Time, and 700T+ Ultrahigh-compute Domain Controller Products Are Rapidly Installed in Vehicles
L...
China Automotive Lighting and Ambient Lighting System Research Report, 2025
Automotive Lighting System Research: In 2025H1, Autonomous Driving System (ADS) Marker Lamps Saw an 11-Fold Year-on-Year Growth and the Installation Rate of Automotive LED Lighting Approached 90...
Ecological Domain and Automotive Hardware Expansion Research Report, 2025
ResearchInChina has released the Ecological Domain and Automotive Hardware Expansion Research Report, 2025, which delves into the application of various automotive extended hardware, supplier ecologic...
Automotive Seating Innovation Technology Trend Research Report, 2025
Automotive Seating Research: With Popularization of Comfort Functions, How to Properly "Stack Functions" for Seating?
This report studies the status quo of seating technologies and functions in aspe...
Research Report on Chinese Suppliers’ Overseas Layout of Intelligent Driving, 2025
Research on Overseas Layout of Intelligent Driving: There Are Multiple Challenges in Overseas Layout, and Light-Asset Cooperation with Foreign Suppliers Emerges as the Optimal Solution at Present
20...
High-Voltage Power Supply in New Energy Vehicle (BMS, BDU, Relay, Integrated Battery Box) Research Report, 2025
The high-voltage power supply system is a core component of new energy vehicles. The battery pack serves as the central energy source, with the capacity of power battery affecting the vehicle's range,...
Automotive Radio Frequency System-on-Chip (RF SoC) and Module Research Report, 2025
Automotive RF SoC Research: The Pace of Introducing "Nerve Endings" such as UWB, NTN Satellite Communication, NearLink, and WIFI into Intelligent Vehicles Quickens
RF SoC (Radio Frequency Syst...
Automotive Power Management ICs and Signal Chain Chips Industry Research Report, 2025
Analog chips are used to process continuous analog signals from the natural world, such as light, sound, electricity/magnetism, position/speed/acceleration, and temperature. They are mainly composed o...
Global and China Electronic Rearview Mirror Industry Report, 2025
Based on the installation location, electronic rearview mirrors can be divided into electronic interior rearview mirrors (i.e., streaming media rearview mirrors) and electronic exterior rearview mirro...
Intelligent Cockpit Tier 1 Supplier Research Report, 2025 (Chinese Companies)
Intelligent Cockpit Tier1 Suppliers Research: Emerging AI Cockpit Products Fuel Layout of Full-Scenario Cockpit Ecosystem
This report mainly analyzes the current layout, innovative products, and deve...
Next-generation Central and Zonal Communication Network Topology and Chip Industry Research Report, 2025
The automotive E/E architecture is evolving towards a "central computing + zonal control" architecture, where the central computing platform is responsible for high-computing-power tasks, and zonal co...
Vehicle-road-cloud Integration and C-V2X Industry Research Report, 2025
Vehicle-side C-V2X Application Scenarios: Transition from R16 to R17, Providing a Communication Base for High-level Autonomous Driving, with the C-V2X On-board Explosion Period Approaching
In 2024, t...
Intelligent Cockpit Patent Analysis Report, 2025
Patent Trend: Three Major Directions of Intelligent Cockpits in 2025
This report explores the development trends of cutting-edge intelligent cockpits from the perspective of patents. The research sco...
Smart Car Information Security (Cybersecurity and Data Security) Research Report, 2025
Research on Automotive Information Security: AI Fusion Intelligent Protection and Ecological Collaboration Ensure Cybersecurity and Data Security
At present, what are the security risks faced by inte...
New Energy Vehicle 800-1000V High-Voltage Architecture and Supply Chain Research Report, 2025
Research on 800-1000V Architecture: to be installed in over 7 million vehicles in 2030, marking the arrival of the era of full-domain high voltage and megawatt supercharging.
In 2025, the 800-1000V h...
Foreign Tier 1 ADAS Suppliers Industry Research Report 2025
Research on Overseas Tier 1 ADAS Suppliers: Three Paths for Foreign Enterprises to Transfer to NOA
Foreign Tier 1 ADAS suppliers are obviously lagging behind in the field of NOA.
In 2024, Aptiv (2.6...
VLA Large Model Applications in Automotive and Robotics Research Report, 2025
ResearchInChina releases "VLA Large Model Applications in Automotive and Robotics Research Report, 2025": The report summarizes and analyzes the technical origin, development stages, application cases...
OEMs’ Next-generation In-vehicle Infotainment (IVI) System Trends Report, 2025
ResearchInChina releases the "OEMs’ Next-generation In-vehicle Infotainment (IVI) System Trends Report, 2025", which sorts out iterative development context of mainstream automakers in terms of infota...