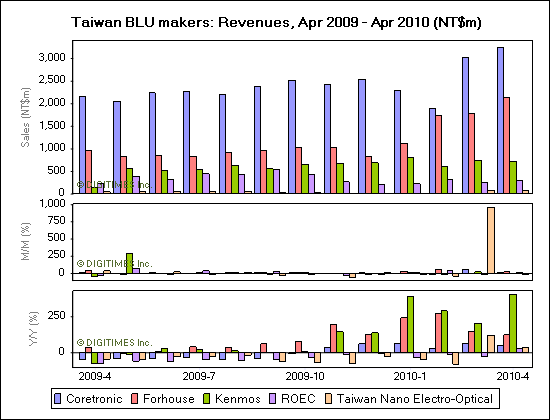
Taiwan-based backlight unit (BLU) makers Coretronic, Forhouse, Kenmos Technology and Taiwan Nano Electro-Optical Technology have all seen on-month growth in their April revenues.
Coretronic has posted consolidated revenues of NT$8.37 billion (US$263.43 million) for April, up 13.14% sequentially and 42.36% on year. Consolidated revenues for the first four months of 2010 totaled NT$29.6 billion, up 54.11% on year.
BLU shipments were about 6.9 million units in April, and consolidated revenues from BLUs reached NT$5.51 billion, increasing 29% sequentially and 52% on year. The BLU revenue growth was mainly driven by shipments for LED-backlit TVs and monitors, which increased by 16% and 118% on month, respectively.
TV BLU shipments totaled 1.08 million units, of which 18% were LED models. Monitor BLU shipments came to 3.2 million units, with LED models accounting for 25%. Shipments of notebook BLUs reached 2.54 million units, 86% of which were LED models, according to the company.
Coretronic's front projector shipments in April amounted to 142,000 units, generating revenues of NT$2 billion, which was down 5% sequentially. Projector shipments for January-April reached 459,000 units, increasing 89% on year.
For May, Coretronic expects projector shipments to drop slightly on month, and BLU shipments to continue to grow.
Forhouse has reported April consolidated revenues of NT$2.18 billion, an increase of 22.36% sequentially and 26.48% on year. Consolidated revenues for January-April totaled NT$7.64 billion, up 63.33% on year.
Kenmos' April consolidated revenues increased 10.48% sequentially and 45.42% on year to NT$733.37 million. Consolidated revenues for January-April were NT$2.72 billion, up 57.92% on year.
Taiwan Nano's April consolidated revenues increased 0.48% sequentially and 30.84% on year to NT$506.86 million. Consolidated revenues for January-April totaled NT$1.9 billion, up 71.42% on year.

|
Taiwan BLU makers: Revenues, Apr 2009 - Apr 2010 (NT$m) |
|
Month |
Coretronic |
Forhouse |
ROEC |
Taiwan Nano Electro-Optical |
Kenmos |
|
Sales |
Y/Y |
Sales |
Y/Y |
Sales |
Y/Y |
Sales |
Y/Y |
Sales |
Y/Y |
|
Apr-10 |
3,239 |
49.9% |
2,139 |
123.7% |
299 |
27.6% |
72 |
38.1% |
726 |
405.5% |
|
Mar-10 |
3,027 |
64.1% |
1,792 |
149.7% |
261 |
(27.6%) |
84 |
121.4% |
739 |
203.4% |
|
Feb-10 |
1,893 |
29.5% |
1,742 |
272.1% |
321 |
(9.6%) |
8 |
(79.4%) |
610 |
289.6% |
|
Jan-10 |
2,289 |
61.5% |
1,115 |
242.1% |
221 |
(32.2%) |
14 |
(46.5%) |
810 |
392.6% |
|
Dec-09 |
2,537 |
60.7% |
840 |
124.9% |
205 |
(4.2%) |
17 |
(29.2%) |
692 |
137.1% |
|
Nov-09 |
2,431 |
34.3% |
1,022 |
198.2% |
266 |
(10.5%) |
14 |
(74.2%) |
681 |
144.7% |
|
Oct-09 |
2,519 |
(5.5%) |
1,029 |
76.1% |
427 |
(32%) |
34 |
(71.5%) |
657 |
5.2% |
|
Sep-09 |
2,374 |
(42%) |
957 |
62.3% |
546 |
(49.5%) |
37 |
(61.1%) |
556 |
2.7% |
|
Aug-09 |
2,203 |
(47%) |
915 |
35.3% |
435 |
(54.1%) |
59 |
(17.9%) |
633 |
12.7% |
|
Jul-09 |
2,276 |
(34.2%) |
827 |
40.1% |
444 |
(47%) |
51 |
(28.4%) |
551 |
24.8% |
|
Jun-09 |
2,238 |
(41.3%) |
853 |
7.5% |
330 |
(64.7%) |
63 |
(29.1%) |
521 |
27.2% |
|
May-09 |
2,058 |
(41.3%) |
835 |
(4.9%) |
391 |
(57.9%) |
52 |
(46.8%) |
564 |
(11.6%) |
|
Apr-09 |
2,161 |
(45.2%) |
956 |
36.1% |
234 |
(74.7%) |
52 |
(46.4%) |
144 |
(76.8%) |
*Figures are not consolidated
Source: TSE, compiled by Digitimes, May 2010