| |
|
 |
Polysilicon is the base for global electronic industry and PV industry, and 100% of the semiconductor chip and 95% of solar battery chip are made of silicon (including the silicon and polysilicon). The polysilicon is divided into two grades by silicon content, one is solar grade silicon (SG) with the silicon content of 99.9999%, which is mainly used for the production and manufacturing of the solar battery chip; the other is electronic grade silicon (EG) with the silicon content of 99.999999999%, which is used for the manufacturing of semiconductor chips.
The EG and SG output accounted for 55% and 45% in the polysilicon output in the world in 2006 respectively. With the rapid development of solar PV industry, the growth pace of the polysilicon demand by the solar battery chip was far higher than the development of semiconductor polysilicon, and it is forecasted that the demand of the solar polysilicon will exceed the EG soon. Currently, the crystalline silicon is key PV materials, accounting more than 90% in the market; in addition, it will be the main raw materials for the solar battery for a long time in the future. The total output of solar polysilicon in the world amounted to 21 thousand tons in 2006, while the global market demand amount was 28 thousand tons, so the price rose sharply from USD 9 per kilo in 2000 to USD 70-80 per kilo in Dec, 2006. Meanwhile, the production and supply of SG restrict the development of solar battery in the world.
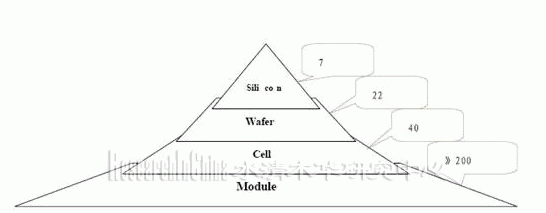
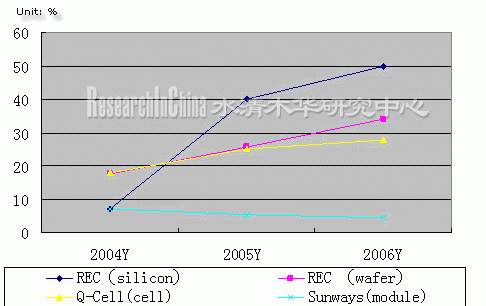
Divided from silicon material to solar battery industry, solar PV generating industry structure shows a pyramid structure, with the upstream industry the smallest and the downstream the utmost. Also the profit distribution appears some kind of imbalance, the profit rate of the solar battery industry decreases gradually from upstream to downstream.
Pyramid Structure of Solar PV Generating Industry

Profit Change of Solar by Section

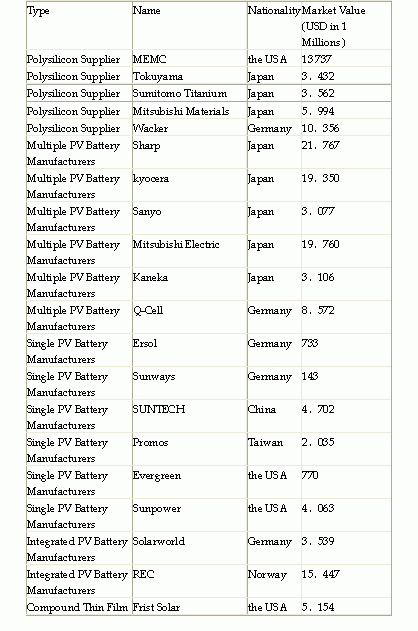
There are two types of enterprises which have the advantages in the future competition in the current new solar industry chain, one is the ultra large enterprises, which can lower down the cost and form core competitiveness; and the other is with the special advantages in the segmented market.
Evaluated Value of International / China PV Enterprises by Type

Source: bioomberg
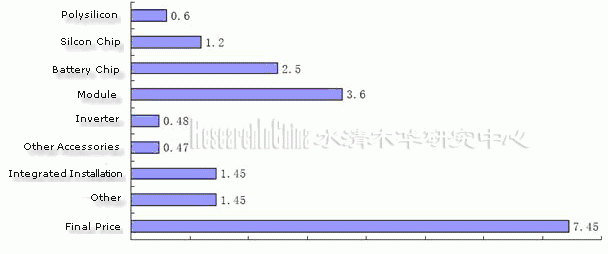
Solar Battery System Cost Structure, 2005 Unit: S/Wp

The demand in China polysilicon market is brisk, and the quartz reserved is rich as well. The annual industry silicon output in China has amounted to more than 400 thousand tons since 2000, accounting for 1/3 in the total output of industry silicon in the world, and the annual export amount has exceeded 300 thousand tons. Currently, the industry silicon output capability, output, and export amount all ranked the first place in the world. Although the industry silicon export has been large for many years in China, the performance was low. As Renewable Energy Law of People's Republic of China took effect on Jan 1, 2006, which provided the legal guaranty for the utilization and development of the renewable energy in China, in addition, the opportunity brought by the development of renewable energy in China has drawn wide attention of the world. The polysilicon industry is known for its high input, high consumption as well as high risk and long payback period. In a long period in the future it is still profitable. However, the problems followed shall be paid with more attention:
Firstly, irrational investment in the domestic PV industry, low-level and repeated construction have caused serious shortage of polysilicon raw materials and price increase in the international market, as well as the vicious competition among the enterprises. However, bottleneck for the development of PV industry is not technology and raw materials, but that the market in China has not started up so far. Presently, dramatic increase of the market price has attracted many investors. But we herein suggest rational investment, or profit expected will not be earned.
Secondly, there are many defects of the polysilicon technology in China behind the polysilicon investment wave. Although many domestic enterprises have entered the field, or expanded the output capability, due to the backward technology, developing the polysilicon is also faced with many problems. The polysilicon production countries in the world are seeking for new technique, new equipment and new technology, which signify that a new leap in the global polysilicon industrialization production technology will come soon, so if China wants to seize this opportunity, it should make breakthrough in technology.
In the next five to ten years, China would solve the supply of electric power in remote areas, and PV generation system shall be largely used and small PV power station shall be built; In addition, Chinese cities shall refer to foreign roof systems to wildly use PV power in lighting public places like roads, parks and bus stops.
|
|
|
|
|
If this report could not still meet your requirement, or
you have any comments or suggestions on it, please leave a
message to us.
|
2005-2008 www.researchinchina.com All Rights Reserved
| |
|
 |
| |
|
Polysilicon is the base for global electronic industry and PV industry, and 100% of the semiconductor chip and 95% of solar battery chip are made of silicon (including the silicon and polysilicon). The polysilicon is divided into two grades by silicon content, one is solar grade silicon (SG) with the silicon content of 99.9999%, which is mainly used for the production and manufacturing of the solar battery chip; the other is electronic grade silicon (EG) with the silicon content of 99.999999999%, which is used for the manufacturing of semiconductor chips.
The EG and SG output accounted for 55% and 45% in the polysilicon output in the world in 2006 respectively. With the rapid development of solar PV industry, the growth pace of the polysilicon demand by the solar battery chip was far higher than the development of semiconductor polysilicon, and it is forecasted that the demand of the solar polysilicon will exceed the EG soon. Currently, the crystalline silicon is key PV materials, accounting more than 90% in the market; in addition, it will be the main raw materials for the solar battery for a long time in the future. The total output of solar polysilicon in the world amounted to 21 thousand tons in 2006, while the global market demand amount was 28 thousand tons, so the price rose sharply from USD 9 per kilo in 2000 to USD 70-80 per kilo in Dec, 2006. Meanwhile, the production and supply of SG restrict the development of solar battery in the world.
Divided from silicon material to solar battery industry, solar PV generating industry structure shows a pyramid structure, with the upstream industry the smallest and the downstream the utmost. Also the profit distribution appears some kind of imbalance, the profit rate of the solar battery industry decreases gradually from upstream to downstream.
Pyramid Structure of Solar PV Generating Industry

Profit Change of Solar by Section

There are two types of enterprises which have the advantages in the future competition in the current new solar industry chain, one is the ultra large enterprises, which can lower down the cost and form core competitiveness; and the other is with the special advantages in the segmented market.
Evaluated Value of International / China PV Enterprises by Type

Source: bioomberg
Solar Battery System Cost Structure, 2005 Unit: S/Wp

The demand in China polysilicon market is brisk, and the quartz reserved is rich as well. The annual industry silicon output in China has amounted to more than 400 thousand tons since 2000, accounting for 1/3 in the total output of industry silicon in the world, and the annual export amount has exceeded 300 thousand tons. Currently, the industry silicon output capability, output, and export amount all ranked the first place in the world. Although the industry silicon export has been large for many years in China, the performance was low. As Renewable Energy Law of People's Republic of China took effect on Jan 1, 2006, which provided the legal guaranty for the utilization and development of the renewable energy in China, in addition, the opportunity brought by the development of renewable energy in China has drawn wide attention of the world. The polysilicon industry is known for its high input, high consumption as well as high risk and long payback period. In a long period in the future it is still profitable. However, the problems followed shall be paid with more attention:
Firstly, irrational investment in the domestic PV industry, low-level and repeated construction have caused serious shortage of polysilicon raw materials and price increase in the international market, as well as the vicious competition among the enterprises. However, bottleneck for the development of PV industry is not technology and raw materials, but that the market in China has not started up so far. Presently, dramatic increase of the market price has attracted many investors. But we herein suggest rational investment, or profit expected will not be earned.
Secondly, there are many defects of the polysilicon technology in China behind the polysilicon investment wave. Although many domestic enterprises have entered the field, or expanded the output capability, due to the backward technology, developing the polysilicon is also faced with many problems. The polysilicon production countries in the world are seeking for new technique, new equipment and new technology, which signify that a new leap in the global polysilicon industrialization production technology will come soon, so if China wants to seize this opportunity, it should make breakthrough in technology.
In the next five to ten years, China would solve the supply of electric power in remote areas, and PV generation system shall be largely used and small PV power station shall be built; In addition, Chinese cities shall refer to foreign roof systems to wildly use PV power in lighting public places like roads, parks and bus stops.
|
|
|
|
|
2005-2006 www.researchinchina.com All Rights Reserved |
|
| |
|
 |
| |
|
1 Polysilicon Industry
1.1 Definition & Application
1.2 Brief Introduction
1.2.1 Industry Chain
1.2.2 Characteristics
1.2.3 Characteristics of Advantageous Enterprises
1.2.4 Cost Structure 2 Status Quo of Polysilicon Market
2.1 International Market
2.1.1 Market Layout
2.1.2 Supply and Demand
2.1.3 Forecast
2.2 Domestic Market
2.2.1 Market Layout
2.2.2 Supply and Demand
2.2.3 Forecast
2.3 Conclusion 3 Status Quo of Polysilicon Technology
3.1 Technology
3.2 Technology Bottleneck
3.3 Technology Trend
3.4 Organizations
3.5 Conclusion 4 Core Manufacturers of Polysilicon
4.1 Brief Introduction
4.2 HEMLOCK SEMICONDUCTOR
4.2.1 Company Profile and Organization Structure
4.2.2 Production and Distribution, 2002-2006
4.2.3 Output Forecast 2007-2010
4.2.4 Operation Revenue and Profit Rate, 2004-2006
4.2.5 Main Clients and Supply Relation
4.2.6 Development Strategy and Conclusion
4.3 WACKER CHEMIE
4.4 TOKUYAMA
4.4.1 Company Profile and Organization Structure
4.5 MEMC ELECTRONIC MATERIALS
4.6 REC ASIMI
4.7 MITSUBISHI MATERIALS & MITSUBISHI POLYCRYSTALLINE MATERIALS(US)
4.8 REC SGS
4.9 SUMITOMO
4.10 Luoyang China Silicon High-tech Co., Ltd
4.11 Sichuan Emei Semiconductor Materials Factory
4.12 Other Domestic and International Projects to be Constructed
4.12.1 Japan Nippon Steel Group
4.12.2 DC Chemical Co., Ltd
4.12.3 ENDESA Generacion、 Isofoton etc
4.12.4 Sichuan Leshan Xinguang Silicon Industry
4.12.5 Ningxia Shizuishan City
4.12.6 Jiangsu Shunda Semiconductor Development Co., Ltd
4.12.7 Yunnan Aixin Silicon Technology Co., Ltd
4.12.8 Liaoning Linghai
4.12.9 Polysilicon Project of Inner Mongolia Wuhai
4.12.10 Sichuan Chaolei Industry
4.13 Conclusion 5 Core Manufacturers of SG Silicon Ingot/ Wafer Silicon
5.1 Brief Introduction
5.2 SCANWAFER(REC)
5.3 DEUTSCHE SOLAR
5.4 M.SETEK
5.5 KYOCERA
5.6 BP SOLAR
5.7 PV CRYSTALOX
5.8 SHELL SOLAR
5.9 SANYO
5.10 JFE STEEL
5.11 SUMCO
5.12 RWE SCHOTT SOLAR
5.13 SHARP
5.14 YINGLI SOLAR
5.15 Jiangxi Saiwei LDK Solar High-tech Co., Ltd
5.16 ERSOL SOLAR ENERGY AG (ASI INDUSTRIES GMBH)
5.17 PHOTOWATT INTERNATIONAL SAS
5.18 Hebei Jinglong Group
5.19 SPACE ENERGY
5.20 SWISS WAFER
5.21 TOPSIL SEMICONDUCTOR MATERIALS A/S
5.22 Other
5.22.1 Wafer World
5.22.2 IB Vogt GmbH
5.22.3 LG Siltron
5.22.4 Maharishi Solar Technology Pvt. Ltd.
5.22.5 Renesola
5.22.6 JSC Pillar
5.23 Conclusion 6 Solar Cell, Module and System
6.1 Solar Cell Market
6.2 Solar Module Market
6.3 Solar System Market
6.4 Sharp
6.4.1 Company Profile and Organization
6.4.2 Production and Distribution, 2002-2006
6.4.3 Operating Revenue and Profit Rate, 2004-2006
6.4.4 Main Clients and Supply Relation
6.5 Q-CELL
6.6 KYOCERA
6.7 Sanyo
6.8 Mitsubishi
6.9 RWE SCHOTT SOLAR
6.10 BP SOLAR
6.11 SUNTECH
6.12Taiwan Motech
6.13 SHELL SOLAR
6.14 ISOFOTON
6.15 DEUTSCHE CELL
6.16 PHOTOWATT
6.17 ERSOL
6.18 GE ENERGY
6.19 UNITED SOLAR
6.20 SUNWAYS
6.21 E-TON SOLAR
6.22 Baoding Tianwei Yingli
6.23 Nanjing China Power PV
6.24 Other
6.24.1 Shenzhen Topray Solar Co., Ltd
6.24.2 Yunnan Tianda Photovoltaic Co., Ltd
6.24.3 Ningbo Solar Energy Power Source Co., Ltd
6.24.4 Shanghai Solar Energy S&T Co., Ltd
6.24.5 SHANGHAI TOPSOLAR GREEN ENERGY CO., LTD
6.24.6 Wuxi Shangpin Solar Energy Science & Technology Co.,Ltd
6.24.7 Taiwan E-Ton
6.24.8 Jiangsu Linyang Solarfun Co., Ltd
6.25 Conclusion 7 Solar Cell Consumption Market
7.1 Brief Introduction
7.1.1 Brief Introduction to Solar PV Generating
7.1.2 Government Policy on Solar
7.2 Germany
7.2.1 National Policy and Plan
7.2.2 Solar Cell Consumption Retrospect and Forecast
7.2.3 Development Strategy and Conclusion
7.3 Japan
7.4 the USA
7.5 China
7.6 Spain
7.7 Italy
7.8 France
7.9 Australia
7.10 UK
7.11 Greece
7.12 Other Countries and Regions
7.12.1 India
7.12.2 Austria
7.12.3 Finland
7.12.4 Denmark
7.12.5 Norway
7.12.6 Sweden
7.12.7 Holland, Belgium and Luxemburg
7.12.8 New Members of EU
7.12.9 South Korea
7.12.10 China Taiwan
7.13 Conclusion 8 Development Trend of Solar Polysilicon Industry, 2006-2010
8.1 Demand Trend
8.2 Production Trend 9 Feasibility of Polysilicion Production Line Investment
9.1 Market Feasibility
9.2 Technology Feasibility
9.3 Comprehensive Feasibility 10 Research Conclusions
|
|
|
|
|
2005-2008 www.researchinchina.com All Rights Reserved |
|
| |
|
 |
| |
|
Global Polysilicon Industry Chain Structure, 2007
Solar Polysilicon Solar System Industry Chain
Product Processing Flow of Solar Polysilicon Industry Chain
Related Industries of PV Industry
Crystal Silicon Solar Battery Industry Chain
Solar PV Generating Pyramid Industry
Profit Change of Solar by Process
Development Course of Q-cell
Solar Battery System Cost Structure, 2005 Unit: S/Wp
7 Global Polysilicon Manufacturers, Output and Market Share, 2005
Polysilicon Price Trend of International Long-term PO and Domestic Bulk Cargo, 2004-2010
Forecast of Main Polysilicon Project Output in China, 2005-2008
High-purity Silicon Growth Process of Modified Siemens
SG Silicon Technology Flow Ⅰ by JFE Steel Metallurgy
SG Silicon Technology Flow Ⅱ by JFE Steel Metallurgy
Three Largest Shareholders and Equity Distribution of Hemlock
Upstream Raw Materials, Midstream Product and Downstream Client Distribution of Hemlock
Shareholders and Equity Distribution of Wacker
Operating Revenue and Profit Rate of Wacker, 2004-2006
Polysilicon Product Application Field of Wacker (Electronics and Solar)
Wacker Polysilicon / Single Silicon Chip Electronic Field Application and Potential Clients
Wacker Forecasts Growth Pace and Competition of Global 300mm and below Silicon Chip
Statistics and Forecast of Global Polysilicon Supply and Demand, 2005-2010
Polysilicon and Single Silicon Chip Output of Wacker, 2005-2010
Product Advantages of Wacker
Regional Distribution of Wacker Revenue
Silicon Dioxide Strategy of Wacker
Main Operating Revenue of Tokuyama, 2005-2006
Finance of Tokuyama, 2002-2006
Ratio of Sales Share by Division, 2006
Sales by Division, 2006
Revenue and Growth Ratio of Silicon Materials and Advanced Materials, 2002-2006
MEMC Operating Revenue, 2003-2005
Shareholders and Equity Distribution of REC
REC Revenue and Output Capability of Solar Products, 2001-2005
Output Capability of REC by Industry Chain, 2005
Sales Share and Main Products of Mitsubishi Electronic Materials Division
Main Operating Revenue of Mitsubishi Materials, 2002-2006
REC Development History Era
Equity Relation between REC Group and Subordinate Subsidiaries
Sumitomo Polysilicon Production Flow
Sales of Sumitomo, Mar 2002-Mar 2006
Main Business Output of Sumitomo, Mar, 2004-Mar, 2006
Net Profitability of Polysilicon of Sumitomo, Mar, 2004-Mar, 2006
Sumitomo Polysilicon Business Development Trend
Sumitomo Polysilicon Production Technology Flow
Shareholders and Equity Distribution of Xinguang Silicon Company
Shareholders and Equity Distribution of Ningxia Shizuishan Sunshine Silicon Co., Ltd
Market Share of 12 Global Silicon Chip Manufactures, 2007
Operating Flow from Silicon to Wafer
Change of Silicon Chip Thickness and Solar Battery Efficiency, 2003-2010
Representative Enterprises of Solar Polysilicon –Silicon Ingot / Silicon Chip-Battery-Modules Industry Chain, 2004
Market Share of Solar Battery Silicon Chip Manufacturers in the World, 2005
Finance of REC Wafer Silicon Chip, 2005
Company Distribution of Solar World in the Solar Industry Chain by Process
M.Setek Silicon Chip Product Growth Technique Process
Main Statistics of Kyocera, 2002-2006
Profit Ratio and Main Products of Solar Industry Division, 2005
Operating Revenue of Kyocera, 2005-2006
Operating Revenue of Kyocera by Division, 2005-2006
Main Operating Revenue of BP, 2003-2005
Organization Structure of Ersol Group
Outlay of Ersol by Division, 2006-2007
Forecast of Output Capability of Ersol, 2005-2008
Operating of Ersol, 2002-2006
Development Strategy of Ersol
Ersol Clients and Objective Market
Ersol Technology Strategies
Monthly Output of Silicon Chip, Jul 2004-Jan, 2006
Practical Output of Large Global PV Solar Battery Manufacturers, 2004-2006
Output Capability of Main Solar Battery Companies, 2006
Ratio Relation of Solar Batteries
Specific Classification of Solar Battery
Polysilicon Solar Battery Manufacturing Technique Proces
Installation Amount and Growth Rate of Global Solar Battery, 1996-2006 Unit: MW
Output and Growth Rate of Global Solar Battery, 1996-2006 Unit: MW
Output of Japan, the USA and Europe Solar Battery Production Regions, 2001-2005
Historic Output of Top Ten Solar Battery Manufacturers in the World, 2003-2005
Market Shares of Main Solar Battery Manufactures in the World, 2006 (Total Amount: 1982 Mw)
Statistics and Forecast of Output of Japan, the USA and Europe Solar Battery Production Regions, 2004-2010
Country and Regional Market Share of Solar Battery Output, 2006
Solar Battery Manufacturers and Output in China, 2005
Price Trend of Solar Module in Europe and America, 2000-2006
Output Forecast of Main Module Manufacturers in China, 2007
Annual Installation Amount of Solar Market by Country, 2000-2006 Unit: MW
Global Solar Module Installation Share by Region, 2005
Sharp Solar Battery Output, 2000-2006
Sharp Solar Battery Output Growth Rate, 2001-2006
Development of Q-cells, 2001-2005
Battery Development of Q-cells, 2001-2006
Output of Q-cells, 2001-2005
Operating Revenue of Q-cells, 2001-2005
Solar Battery Output of Kyocera, 2000-2006
Main Electronic Products and Ratio to Total Share of Kyocera, and Operating Revenue, 2003-2005
Solar Battery Output Growth Rate of Sanyo, 2001-2005
Solar Battery Market Share by Region
Net Sales Share by Division, 2005
Main Operating Revenue of Mitsubishi Electric, 2002-2006
Operating Revenue of Resource and Electronic System of Mitsubishi Electric, 2002-2006
Main Operating Revenue, 2002-2005
BP Solar Battery Output, 2002-2006
Share Structure of Wuxi Shangde
Battery Output of Wuxi Shangde, 2002-2006
Forecast of Solar Battery Output of Wuxi Shangde, 2007-2010
Shell Solar Battery Output, 2000-2006
Operating Revenue of Isofoton, 2000-2005
Main Events of Deutsche Cell, 2001-2006
Finance Revenue Share of Photowatt by Division, 2005
Operating Revenue of Photowatt of Solar Division, 2003-2005FY
Objective of Finance, 2006
Single Silicon Battery Exchange Rate and Battery Thickness Change, Jan, 2005-Jan, 2006
Equity and Ratio of Sunways
Sales of Sunways, 2001-2006
Profitability of Sunways, 2001-2006
Operating Revenue, 2004-2005
Sales of Sunways by Division, 2005-2006
Solar Battery Output Capability and Output of Tianwei Yingli, 2004-2005
Output Expansion Plan of Nanjing Chinese Power, 2006-2008
Sales Network Distribution of SHANGHAI TOPSOLAR GREEN ENERGY CO., LTD
Ratio of Solar Energy to Resource Structure, 2000-2010
Resource Generating Amount and Generating Cost of Coal, Nuclear, Hydro-power, Solar etc
Reason of Rapid Growth of Solar Battery Industry
Installation of Global Solar PV Market, 2001-2006
Installation and Forecast of PV Generating System in Main European Countries, 2004-2010
PV System Installation and Forecast in China, 1985-2010
Solar PV in the USA, 2003-2050
Production and Expansion of Main Global Polysilicon Manufacturers, 2006-2010
Resource Development Trend in the World, 2000-2005
|
2005-2008 www.researchinchina.com All Rights Reserved
|


