Global and China Aluminum Heat Transfer Composites Industry Report, 2014-2017
-
Mar.2015
- Hard Copy
- USD
$2,300
-
- Pages:95
- Single User License
(PDF Unprintable)
- USD
$2,200
-
- Code:
CYH033
- Enterprise-wide License
(PDF Printable & Editable)
- USD
$3,300
-
- Hard Copy + Single User License
- USD
$2,500
-
Aluminum heat transfer composites (aluminum sheet, strip, and foil, etc.) are mainly used in heat exchange systems of automobiles, home appliances, and machinery and equipment as well as air-cooling systems of thermal power stations. Fuelled by the downstream sectors, the global output of aluminum heat transfer compositespresented an AAGR of 6.1% during 2006-2014, and reached 1.38 million tons in 2014, up 4.5% year on year, a drop of 1.1 percentage points from 2013.
As one of the world's major consumers of aluminum heat transfer composites, China had a demand of approximately 591.9 kt in 2014, which was mainly attributed to the growth in demand from industries like automotive lightweightas well as machinery and equipment. It is predicated that by 2017 China’s demand for aluminum heat transfer composites will reach 850 kt.
At present, aluminum heat transfer composites manufacturers in China are mainly the foreign-funded companies or joint-ventures, which contributed more than 60% of the total capacity in China. By contrast, the Chinese enterprises, restricted by some factors like technology, have a small scale, thereby making them less competitive.
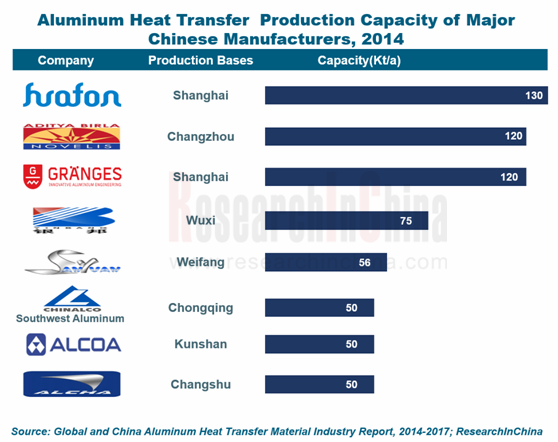
Granges, Orkla's wholly-owned subsidiary that specializes in aluminum heat transfer composites business, now has achieved the capacity of 210 kt/a aluminum heat transfer composites. Gr?nges Aluminum Heat Transfer (Shanghai) Co., Ltd., a production base of Gr?nges in China, has the annual capacity of 120kt; in future, the company will plan to construct its second factory in China.
Novelis is a majoraluminum heat transfer composites manufacturer in the United States. In October 2014, the company's first automotive aluminum heat treatmentmanufactory in China was completed and put into operation, with its capacity of 120 kt/a.
Huafon Nikkei, a Sino-Japanese joint venture, is so far the largest aluminum heat transfer composites manufacturer by capacity in China. In late 2014, the company's 50 kt/a civilair-conditioning aluminum alloy composites project (phase II) went into operation, which helped raise its total capacity of aluminum heat transfer composites to 130 kt/a.
As the largest aluminum-based multi-metal composites manufacturer in China, Yinbang boasts the capacity of 20 kt/a aluminum-based multi-metal composites. The company’s 200 kt/a aluminum-based laminated metal composites expansion project will be put into production in September 2015, when its aluminum-based multi-metal composites capacity will amount to 50 kt/a.
The report is primarily concerned with the following:
 Market supply & demand and competitive landscape, etc. of the global aluminum heat transfer composites industry;
Policies about development, supply and demand, competitive landscape, etc. of China aluminum heat transfer composites industry;
Main downstream demand for China's aluminum heat transfer composites;
Operation, aluminum heat transfer composites business, and development in China, etc. of 7 global aluminum heat transfer composites manufacturers;
Operation, aluminum heat transfer composites business, and development, etc. of 14 Chinese aluminum heat transfer composites manufacturers;
Development prospects, etc. of global and China aluminum heat transfer composites industry in 2015-2017.
1 Overview of Aluminum Heat Transfer Composites
1.1 Definition
1.2 Classification
1.3 Industry Chain
1.4 Production Technology
2 Status Quo of Global Aluminum Heat Transfer Composites Industry
2.1 Overview
2.2 Supply
2.3 Demand
2.4 Competition among Companies
3 Status Quo of China's Aluminum Heat Transfer Composites Industry
3.1 Policy
3.2 Industry Environment
3.3 Supply
3.4 Demand
4 Major Downstream Demand for Aluminum Heat Transfer Composites in China
4.1 Automobile Industry
4.2 Machinery and Equipment
4.3 Air Cooling Systems of Power Plants
4.4 Household Appliances
5 Global Aluminum Heat Transfer Composites Manufacturers
5.1 ALCOA
5.1.1 Profile
5.1.2 Operation
5.1.3 Revenue Structure
5.1.4 R&D
5.1.5 Aluminum Heat Transfer Composites Business
5.1.6 Business in China
5.1.7 Alcoa Kunshan Aluminum Products Co., Ltd.
5.2 Wickeder
5.2.1 Profile
5.2.2 Aluminum Heat Transfer Composites Business
5.2.3 Business in China
5.3 Granges(Sapa Heat Transfer)
5.3.1 Profile
5.3.2 Operation
5.3.3 Revenue Structure
5.3.4 Business in China
5.3.5 Granges Aluminum Heat Transfer (Shanghai) Co., Ltd. (formerly known as Sapa Heat Transfer (Shanghai) Ltd.)
5.4 Norsk Hydro
5.4.1 Profile
5.4.2 Operation
5.4.3 Revenue Structure
5.4.4 R&D
5.4.5 Aluminum Heat Transfer Composites Business
5.4.6 Business in China
5.5 Aleris
5.5.1 Profile
5.5.2 Operation
5.5.3 Revenue Structure
5.5.4 Aluminum Heat Transfer Composites Business
5.5.5 Business in China
5.6 Novelis
5.6.1 Profile
5.6.2 Operation
5.6.3 Aluminum Heat Transfer Composites Business
5.6.4 Business in China
5.7 Kobe Steel
5.7.1 Profile
5.7.2 Operation
5.7.3 Revenue Structure
5.7.4 Aluminum Heat Transfer Composites Business
5.7.5 Business in China
6 Aluminum Heat Transfer Composites Manufacturers in China
6.1 Yinbang Clad Material (300337)
6.1.1 Profile
6.1.2 Operation
6.1.3 Revenue Structure
6.1.4 Gross Margin
6.1.5 Capacity, Output, and Sales Volume
6.1.6 Customers and Suppliers
6.1.7 R&D and Projects under Construction
6.1.8 Business Expansion
6.1.9 Development Prospects
6.2 Jiangsu ALCHA Aluminium Co., Ltd. (002160)
6.2.1 Profile
6.2.2 Operation
6.2.3 Revenue Structure
6.2.4 Output and Sales Volume
6.2.5 Projects under Construction
6.2.6 Development Prospects
6.3 Northeast Light Alloy Co., Ltd.
6.3.1 Profile
6.3.2 Operation
6.3.3 Revenue Structure
6.3.4 Gross Margin
6.3.5 Aluminum Alloy Output and Sales Volume
6.3.6 Projects under Construction
6.3.7 Development Prospects
6.4 Southwest Aluminum (Group) Co., Ltd.
6.4.1 Profile
6.4.2 Operation
6.5 Huafon Nikkei Aluminium Corporation
6.5.1 Profile
6.5.2 Aluminum Heat Transfer Composites Business
6.6 Nantong Hua Te Aluminum Heat Transfer Co., Ltd.
6.6.1 Profile
6.6.2 Capacity
6.6.3 R&D
6.7 Jiangsu Caifa Aluminum Co., Ltd.
6.7.1 Profile
6.7.2 Operation
6.8 Weifang Sanyuan Aluminum Co., Ltd.
6.9 Nantong Hengxiu Aluminum Heat Transfer Material Co., Ltd.
6.9.1 Profile
6.9.2 Operation
6.10 Harbin Song Run Metal Products Co., Ltd.
6.10.1 Profile
6.10.2 Aluminum Heat Transfer Composites Business
6.11 Changsha Zhongxing New Material Co., Ltd.
6.12 Others
6.12.1 Shanghai Saxin Automotive Heat Transfer Material Co., Ltd.
6.12.2 Wuxi Guanyun Aluminum Co., Ltd.
6.12.3 Zhenjiang Yuanlong Aluminum Co., Ltd.
7 Conclusion and Forecast
7.1 Enterprises
7.2 Forecast
7.2.1 Global Market
7.2.2 Chinese Market
Structure and Properties of Aluminum Alloy Composites
Structure of Aluminum-based Multi-metal Composites
Industrial Chain of Aluminum-based Laminated Metal Composites
Global Output of Aluminum Heat Transfer Composites, 2006-2014
Global Demand for Aluminum Heat Transfer Composites, 2006-2014
Revenue of Major global Aluminum Heat Transfer Composites Manufacturers and from the Related Business, 2014
Policies on Aluminum Heat Transfer Composites in China, 2006-2014
China's Aluminum Output and YoY Growth, 2006-2014
China's Aluminum Alloy Output and YoY Growth, 2006-2014
Capacity of Aluminum Heat Transfer Composites in China, 2006-2014
Capacity of Aluminum Heat Transfer Composites in China (by Product), 2006-2014
Demand for Aluminum Heat Transfer Composites in China, 2006-2014
Demand for Aluminum Heat Transfer Composites in China (by Product), 2006-2014
Quantity of Aluminum Heat Transfer Composites Used in Automotive Parts
Automobile Output & Ownership and Demand for Aluminum Alloy Composites in China, 2000-2017E
Machinery & Equipment Output and Demand for Aluminum Heat Transfer Composites in China, 2010-2017E
Newly Installed Capacity of Thermal Power Stations and Demand for Aluminum Heat Transfer Composites in China, 2011-2017E
China’s Air-conditioner Output and Demand for Aluminum Heat Transfer Composites, 2011-2017E
Alcoa’s Revenue and Net Income, 2007-2014
Alcoa’s Operating Revenue (by Business), 2012-2014
Alcoa’s Revenue Structure (by Country/Region), 2010-2013
Alcoa’s R&D Expenditure and Structure, 2007-2014
Alcoa’s Revenue and Profit of Rolled Products, 2009-2014
Alcoa’s Aluminum Rolled Product Subsidiaries and Products (by Country/Region), 2014
Alcoa’s Net Revenue in China and % of Total Revenue, 2009-2013
Main Products and Applications of Wickeder's EMS Division, 2014
Granges' Development History, 1896-2013
Granges' Geographical Distribution and Market Share, 2014
Granges' Revenue and Operating Income, 2011-2014
Granges' Sales Volume, 2013-2014
Granges' Net Income (by Region), 2011-2014
Heat Exchanger Material Capacity of Gr?nges Aluminum Heat Transfer (Shanghai), 1999-2014
Revenue and Net Income of Norsk Hydro, 2009-2014
Revenue Breakdown of Norsk Hydro (by Business), 2011-2014
Revenue Structure of Norsk Hydro (by Country/Region), 2013
Norsk Hydro's R&D Costs and % of Total Revenue, 2011-2013
Rolling Products and Capacity of Norsk Hydro (by Factory), 2014
Norsk Hydro's Aluminum Heat Transfer Business Distribution, 2012-2013
Rolled Product Revenue and Profit of Norsk Hydro, 2010-2014
Norsk Hydro's Rolled Product Sales Volume (by Application), 2011-2014
Norsk Hydro's Rolled Product Output for External Markets (by Factory), 2011-2013
Aleris’ Revenue and Net Income, 2008-2014
Aleris’ Revenue Structure (by Business), 2010-2014
Aleris’ Revenue Structure (by Region), 2010-2013
Aleris’ Aluminum Rolled Product Revenue (by Business), 2010-2014
Aleris’ Aluminum Rolled Product Sales Volume (by Business), 2010-2014
Aleris’ Subsidiaries in China, 2014
Revenue and Net Income of Novelis, FY2007-FY2014
Novelis' Total Shipments of Rolled Products (by Region), FY2013-FY2014
Novelis' Shipment Structure of Rolled Products (by Application), FY2014 & FY2020
Business Structure of Kobe Steel, 2014
Revenue and Net Income of Kobe Steel, FY2008-FY2014
Kobe Steel's Revenue Structure (by Business), FY2013-FY2014
Kobe Steel's Revenue Structure (by Region), FY2013
Kobe Steel's Revenue in China and % of Total Revenue, FY2011-FY2013
Kobe Steel's Subsidiaries and Businesses in China, 2015
Yinbang’s Revenue and Net Income, 2008-2014
Yinbang’s Operating Revenue (by Business), 2008-2014
Yinbang’s Operating Revenue (by Region), 2008-2014
Yinbang’s Gross Margin (by Business), 2008-2014
Yinbang’s Capacity (by Product), 2013-2017E
Yinbang’s Output and Sales Volume (by Application), 2011-2013
Name List and Revenue Contribution of Yinbang’s Top 5 Clients, 2014H1
Yinbang’s R&D Costs and % of Total Revenue, 2009-2014
Yinbang’s Major Projects under Construction, 2015
Yinbang’s Revenue and Net Income, 2012-2017E
ALCHA’s Revenue and Net Income, 2008-2014
ALCHA’s Operating Revenue (by Product), 2008-2014
ALCHA’s Operating Revenue (by Region), 2008-2014
ALCHA’s Projects under Construction, 2015
ALCHA’s Revenue and Net Income, 2012-2017E
Northeast Light Alloy's Subsidiaries and Their Businesses, 2014
Revenue and Net Income of Northeast Light Alloy, 2010-2014
Production Lines of Northeast Light Alloy, by the end of Sep. 2014
Aluminum Alloy Operating Revenue Structure of Northeast Light Alloy (by Product), 2010-2013
Gross Margin of Northeast Light Alloy (by Product), 2010-2013
Aluminum Alloy Capacity and Output of Northeast Light Alloy (by Product), 2010-2013
Aluminum Alloy Sales Volume, Sales-Output Ratio and Prices of Northeast Light Alloy (by Product), 2010-2013
Northeast Light Alloy's Major Projects under Construction, by the end of Sep. 2014
Revenue and Net Income of Northeast Light Alloy, 2013-2017E
Revenue and Net Income of Southwest Aluminum, 2012-2014
Revenue Structure of Southwest Aluminum (by Product), 2011
Huafon’s Key Aluminum Heat Transfer Composites Projects, 2010-2014
Capacity of Aluminum Heat Transfer Composites of Nantong Hua Te, 2005-2014
CAIFA Aluminum's Revenue and Net Income, 2011-2014
Key Projects of Sanyuan Aluminum, 2013
Major Clients of Nantong Hengxiu
Major Products and Applications of Guanyun Aluminum, 2014
Capacity of Aluminum Heat Transfer Products of Zhenjiang Yuanlong Aluminum, 2013
Revenue of Main Global and Chinese Aluminum Heat Transfer Composites Manufacturers, 2013-2014
Capacity of Major Aluminum Heat Transfer Composites Enterprises in China, 2014
Global Aluminum Heat Transfer Composites Output and Demand, 2013-2017E
China’s Aluminum Heat Transfer Composites Capacity and Demand, 2013-2017E
Global and China Optical Fiber Preform Industry Report, 2021-2026
Optical fiber preforms play a key role in the optical fiber communication industry chain. The global construction of 4G and FTTH requires less optical fiber and cable, which has dragged down the deman...
Global and China Photoresist Industry Report, 2021-2026
Since its invention in 1959, photoresist has been the most crucial process material for the semiconductor industry. Photoresist was improved as a key material used in the manufacturing process of prin...
Global and China Needle Coke Industry Report, 2021-2026
Needle coke is an important carbon material, featuring a low thermal expansion coefficient, a low electrical resistivity, and strong thermal shock resistance and oxidation resistance. It is suitable f...
Global and China 3D Glass Industry Report, 2021-2026
3D curved glass is light and thin, transparent and clean, anti-fingerprint, anti-glare, hard and scratch-resistant, and performs well in weather resistance. It is applicable to terminals such as high-...
Global and China Graphene Industry Report, 2020-2026
Graphene, a kind of 2D carbon nanomaterial, features excellent properties such as mechanical property and super electrical conductivity and thermal conductivity. Its downstream application ranges from...
Global and China Optical Fiber Preform Industry Report, 2020-2026
Optical fiber preform as a hi-tech product and a crucial link in the optical fiber industry chain contributes to 70% or so of profit margin. Global 4G and FTTH construction at dusk leads to the shrink...
Global and China 3D Glass Industry Report, 2020-2026
Global 3D glass market has been enlarging over the recent years amid demetallization of smartphone back covers and popularity of smart wearables, to approximately $2.86 billion in 2019 and to an estim...
Global and China Photoresist Industry Report, 2020-2026
In 2019, global photoresist market was valued at $8.3 billion, growing at a compound annual rate of 5.1% or so since 2010, and it will outnumber $12.7 billion in 2026 with advances in electronic techn...
Global and China Synthetic Diamond Industry Report, 2020-2026
While its mechanical property is given full play in fields like grinding and cutting, diamond with acoustic, optical, magnetic, thermal and other special properties, as superconducting material, intel...
Global and China Needle Coke Industry Report, 2020-2026
With the merits like small resistivity, excellent resistance to impact and good anti-oxidation property, needle coke has been widely used in ultra-high power graphite electrodes, nuclear reactor decel...
Global and China Optical Fiber Preform Industry Report, 2019-2025
Optical fiber preform, playing an important role in the optical fiber and cable industry chain, seizes about 70% profits of optical fiber. Global demand for optical fiber preform stood at 16.2kt in 20...
China Silicon Carbide Industry Report, 2019-2025
Silicon carbide (SiC) is the most mature and the most widely used among third-generation wide band gap semiconductor materials. Over the past two years, global SiC market capacity, however, hovered ar...
Global and China Photoresist Industry Report, 2019-2025
Photoresist, a sort of material indispensable to PCB, flat panel display, optoelectronic devices, among others, keeps expanding in market size amid the robust demand from downstream sectors. In 2018, ...
Global and China Graphene Industry Report, 2019-2025
Graphene is featured with excellent performance and enjoys a rosy prospect. The global graphene market was worth more than $100 million in 2018, with an anticipated CAGR of virtually 45% between 2019 ...
Global and China 3D Glass Industry Chain Report, 2019-2025
The evolution of AMOLED conduces to the steady development of 3D curved glass market. In 2018, the global 3D glass market expanded 37.7% on an annualized basis and reached $1.9 billion, a figure proje...
China Wood Flooring Industry Report, 2019-2025
With the better standard of living and the people’s desire for an elegant life, wood flooring sees a rising share in the flooring industry of China, up from 33.9% in 2009 to 38.9% in 2018, just behind...
Global and China Photovoltaic Glass Industry Report, 2019-2025
In China, PV installed capacity has ramped up since the issuance of photovoltaic (PV) subsidy policies, reaching 53GW in 2017, or over 50% of global total. However, the domestic PV demand was hit by t...
Global and China ITO Targets Industry Chain Report, 2019-2025
Featured by good electrical conductivity and transparency, ITO targets are widely applied to fields of LCD, flat-panel display, plasma display, touch screen, electronic paper, OLED, solar cell, antist...