Global and China Lithium Battery Electrolyte Industry Report, 2016-2020
-
Jan.2016
- Hard Copy
- USD
$2,300
-
- Pages:105
- Single User License
(PDF Unprintable)
- USD
$2,150
-
- Code:
ZHP033
- Enterprise-wide License
(PDF Printable & Editable)
- USD
$3,300
-
- Hard Copy + Single User License
- USD
$2,500
-
Driven by emerging application markets such as new energy vehicles and industrial energy storage, the global lithium battery electrolyte market has been growing steadily. In 2015, the sales volume jumped by 42.1% year on year to 117,000 tons; and it is expected to exceed 600,000 tons in 2020.
As the world's largest consumer of lithium battery electrolyte, China sold 63,000 tons of lithium battery electrolyte in 2015, up 48.9% year on year; the output value amounted to RMB2.86 billion, a year-on-year surge of 52.2%. The output value grew faster than the sales volume mainly because: First, functional electrolyte which is expensive than conventional electrolytic accounted for a rising proportion of the sales volume. Second, the soaring raw material prices pushed up the electrolyte price from RMB90,000/ton in early 2015 to over RMB200,000/ton at the end of the year. The uptrend is expected to continue in 2016.
By applications, electric vehicle and energy storage will become major growth engines of lithium batteries. The global shipment of electric vehicle power lithium battery surged beyond 110% year on year to 20.8GWh in 2015, and will grow at the CAGR of above 50% in 2016-2020. However, the shipment of small lithium batteries used for consumer electronics represented by smart phones and tablet PCs will see sharp slowdown with an expected growth rate of 5% -10% in the future.
Concerning the development trend, high voltage and temperature-resistant electrolyte will be the focus, mainly because: First, high voltage electrolyte (above 4.35V) makes up about 70% in the consumer electronics field, and the proportion will rise further in future. Second, high-voltage cathode materials are developing rapidly in the field of power and energy storage batteries, but the high-voltage resistant electrolyte is relatively backward now; only a small number of Japanese and American companies master high-voltage 5V electrolyte production technology, and the majority of Chinese enterprises have embarked on R & D of high-voltage electrolyte, but lagging behind the international level.
In terms of competitive landscape, the global lithium battery electrolyte market is highly concentrated. In 2015, the world's top ten electrolyte companies seized the combined market share of approximately 62.2%. Capchem replaced Panax-Etec to become the world's largest manufacturer of lithium battery electrolyte with the market share of 9.2%, and Panax-Etec ranked second with 8.8%. Over the same period, China's top ten electrolyte manufacturers occupied the combined market share of over 85%.
Panax-Etec sells 55% of its products to its biggest lithium electrolyte client -- Samsung SDI. In addition, the company shares some of its electrolyte patents with Samsung SDI.
Being optimistic about Chinese new energy vehicle market, Mitsubishi Chemical has set up lithium battery electrolyte production base (Changshu city) and anode material production base (Qingdao city) in China, with the lithium battery electrolyte capacity of 10,000 t/a.
Capchem acquired 76% stake in Zhangjiagang Hicomer Chemical Co., Ltd. (a producer of lithium battery additives) in 2014 to get involved in the upstream electrolyte industry chain. In 2015, it raised the lithium battery electrolyte capacity to 20,000 t/a, but its capacity utilization desired to be improved.
Guotai Huarong put its 5,000 t/a lithium battery electrolyte project into operation formally in 2015, so that the company’s lithium battery electrolyte capacity was expanded to 10,000 t/a. In addition, the company has also established South Korea Guotai Huarong to cooperate with South Korean customers in R & D of lithium battery electrolyte.
Global and China Lithium Battery Electrolyte Industry Report, 2016-2020 by ResearchInChina highlights the followings:
 Development history, market size, competition pattern, development trend, etc. of lithium battery electrolyte worldwide;
Market size, market price, competitive landscape, etc. of lithium battery electrolyte industry in China;
Market size, competition, etc. of main upstream and downstream lithium battery electrolyte industries;
Operation, customers, production, marketing, etc. of six foreign and ten Chinese lithium battery electrolyte manufacturers.
1 Overview of Lithium Battery Electrolyte Industry
1.1 Definition
1.2 Classification
1.3 Industry Chain
2 Status Quo of Global Lithium Battery Electrolyte Market
2.1 Development History
2.2 Market Size
2.3 Market Structure
2.4 Major Producers
2.4.1 Japan
2.4.2 South Korea
2.5 Development Trend
3 Status Quo of China Lithium Battery Electrolyte Market
3.1 Current Situation
3.2 Market Size
3.3 Price
3.4 Enterprise Competition
3.5 Development Trend
4 Upstream and Downstream Segments of Lithium Battery Electrolyte Industry
4.1 Upstream Segments
4.1.1 Lithium Hexafluorophosphate
4.1.2 Lithium Carbonate
4.1.3 Solvent
4.1.4 Additives
4.2 Downstream Applications
4.2.1 Consumer Electronics (3C)
4.2.2 Electric Vehicle
4.2.3 Industrial Energy-storage Market
5 Status Quo of Lithium Battery Market
5.1 Market Size
5.1.1 Global
5.1.2 China
5.2 Market Structure
5.2.1 Global
5.2.2 China
5.3 Competition Pattern
5.3.1 Global
5.3.2 China
6 Key Players in the World
6.1 Mitsubishi Chemical Corporation
6.1.1 Profile
6.1.2 Development History and Prospects
6.1.3 Production Base
6.1.4 Lithium Battery Electrolyte Business
6.1.5 Layout in China
6.1.6 Core Competitiveness
6.1.7 Operating Data
6.2 UBE Industries, Ltd.
6.2.1 Profile
6.2.2 Affiliates
6.2.3 Development History and Prospects
6.2.4 Main Products
6.2.5 Lithium Battery Electrolyte Business
6.2.6 Core Competitiveness
6.2.7 Operating Data
6.3 Panax-Etec Co., Ltd.
6.3.1 Profile
6.3.2 Development History
6.3.3 Lithium Battery Electrolyte Business
6.4 LG Chem
6.4.1 Profile
6.4.2 Development History and Prospects
6.4.3 Lithium Battery Electrolyte Business
6.4.4 Core Competitiveness
6.4.5 Operating Data
6.5 Others
6.5.1 BSF
6.5.2 Mitsui Chemicals, Inc.
7 Key Players in China
7.1 Shenzhen Capchem Technology Co., Ltd.
7.1.1 Profile
7.1.2 Affiliates
7.1.3 Development History and Prospects
7.1.4 Products, Technologies, and Solutions
7.1.5 Customers
7.1.6 Capacity and Base Layout
7.1.7 Output, Sales Volume and Revenue
7.1.8 Core Competitiveness
7.1.9 Operating Data
7.2 Zhangjiagang Guotai Huarong Chemical New Material Co., Ltd.
7.2.1 Profile
7.2.2 Affiliates
7.2.3 Development History and Prospects
7.2.4 Products, Technologies, and Solutions
7.2.5 Customers
7.2.6 Output, Sales Volume, Revenue and Price
7.2.7 Core Competitiveness
7.2.8 Operating Data
7.3 Guangzhou Tinci Materials Technology Co., Ltd.
7.3.1 Profile
7.3.2 Affiliates
7.3.3 Development History and Prospects
7.3.4 Products, Technologies, and Solutions
7.3.5 Customers
7.3.6 Marketing Network
7.3.7 Output and Sales Volume
7.3.8 Core Competitiveness
7.3.9 Operating Data
7.4 Tianjin Jinniu Power Sources Material Co., Ltd.
7.4.1 Profile
7.4.2 Affiliates
7.4.3 Development History and Prospects
7.4.4 Customers
7.4.5 Output and Sales Volume
7.4.6 Core Competitiveness
7.5 Dongguan Shanshan Battery Materials Co., Ltd.
7.5.1 Profile
7.5.2 Affiliates
7.5.3 Development History and Prospects
7.5.4 Products, Technologies, and Solutions
7.5.5 Customers
7.5.6 Supply System
7.5.7 Output and Sales Volume
7.5.8 Core Competitiveness
7.5.9 Operating Data
7.6 Others
7.6.1 Zhuhai Smoothway Electronic Materials Co., Ltd.
7.6.2 Beijing Institute of Chemical Reagents
7.6.3 Shantou Jinguang High-Tech Co., Ltd.
7.6.4 Huzhou Chuangya Power Battery Materials Co., Ltd.
7.6.5 Xianghe Kunlun Chemical Co., Ltd.
8 Summary and Forecast
8.1 Market
8.2 Enterprises
Key Composition of Lithium ion Battery
Electrolyte Composition
Classification of Lithium Battery Electrolyte
Lithium Battery Industry Chain
Global Lithium Battery Electrolyte Development History
Global Lithium Battery Electrolyte Market Size and Growth Rate, 2012-2020E
Sales Volume and Growth Rate of Global Lithium Battery Electrolyte, 2011-2020E
Sales Structure of Global Lithium Battery Electrolyte by Region, 2011-2016
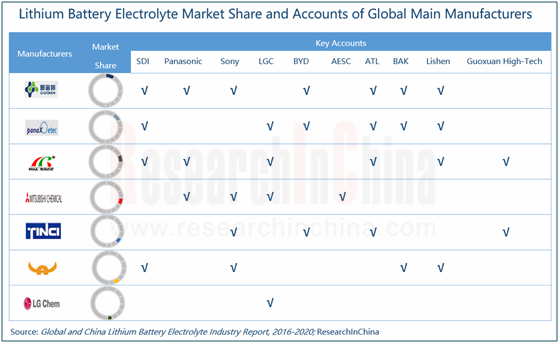
Sales Volume of Key Global Lithium Battery Electrolyte Manufacturers and Their Major Customers, 2015
Market Share of Global Electrolyte Manufacturers, 2014
Market Share of Global Electrolyte Manufacturers, 2015
Sales Volume of Lithium Battery Electrolyte in Japan, 2011-2016E
Sales Volume of Lithium Battery Electrolyte in South Korea, 2011-2016E
Proportion of China’s Lithium Battery Electrolyte in Global Total by Sales Volume, 2011-2020E
Lithium Battery Electrolyte Market Size and Growth Rate in China, 2012-2020E
Sales Volume and Growth Rate of Lithium Battery Electrolyte in China, 2011-2020E
Conventional Electrolyte Price Trend in China, 2011-2016E
Functional Electrolyte Price Trend in China, 2011-2016E
Revenue and Capacity of Lithium Battery Electrolyte Manufacturers in China, 2015
Market Share of Lithium Battery Electrolyte Manufacturers in China, 2015
Production Process of LiFP6
Differences between Domestic and Foreign LiFP6 Technologies
Cost Structure of Electrolyte, 2015
LiFP6 Output in China, 2011-2020E
Competitive Landscape of Global LiFP6 Enterprises, 2014
Competitive Landscape of Chinese LiFP6 Enterprises, 2014
Capacity of Major Global LiFP6 Manufacturers, 2015
LiFP6 Projects of Major Chinese Manufacturers, 2015
LiFP6 Production Cost Structure, 2015
Global LiFP6 Price Trend, 2009-2016E
Global and China’s Lithium Carbonate Output, 2010-2020E
Global Lithium Carbonate Demand Structure, 2014-2015
Lithium Carbonate Apparent Consumption in China, 2010-2020E
Competitive Landscape of Global Lithium Carbonate Market, 2014
Competitive Landscape of Chinese Lithium Carbonate Market, 2014
High Purity Lithium Carbonate Capacity of Some Chinese Companies
Battery Lithium Carbonate Price in China, 2013-2015
Global Lithium Battery Electrolyte Solvent Output, 2011-2020E
Status Quo of Domestic and Foreign Carbonate Solvent Industries
Global Lithium Battery Electrolyte Additive Market Size, 2014-2020E
Demand Structure of Global Lithium Batteries, 2012-2020E
Demand and Growth Rate of Global Consumer Electronics Lithium-ion Batteries, 2013-2020E
Global Mobile Phone Sales Volume and Lithium Battery Demand, 2012-2020E
Global Tablet PC Sales Volume and Lithium Battery Demand, 2012-2020E
Competitive Landscape of Global Tablet PC Market, 2013-2015
Global Laptop Sales Volume and Lithium Battery Demand, 2012-2020E
Global Electronic Cigarette Sales Volume and % of Total, 2012-2020E
Global Electric Passenger Car (EV&PHEV) Sales Volume, 2011-2020E
Global Electric Vehicle Sales Volume, 2010-2050E
Battery Capacity and Endurance of Global Major Electric Vehicles
Battery Capacity of a Single Electric Passenger Car Worldwide, 2011-2020E
Demand of Global Electric Passenger Cars for Power Batteries, 2011-2020E
Demand of Global Electric Vehicles for Power Batteries (by Type), 2011-2020E
China’s Electric Passenger Car (EV&PHEV) Sales Volume, 2011-2020E
Proportion of China’s Electric Passenger Cars in Global Total by Sales Volume, 2011-2020E
China’s Demand for Power Lithium Battery (by Type), 2011-2020E
Scale and Share of Chinese Power Lithium Battery Industry, 2010-2016E
Number of Chinese Mobile Base Stations, 2009-2016E
China’s Demand for Energy Storage Lithium Battery, 2015/2020E
Energy Storage Lithium Battery Demand Structure in China (by Sector), 2020E
Energy Storage Demand (by Application), 2014-2020E (MWh)
Energy Storage Battery Manufacturers in China
Lithium Battery Structure
Global Battery Product Structure, 2014
Global Lithium Battery Market Demand and Scale, 2011-2020E
Lithium Battery Sales Volume and Market Size in China, 2011-2020E
Lithium Battery Export Volume and Value in China, 2007-2016E
Global Lithium Battery Sales Structure (by Country), 2011-2015
Sales Structure of Lithium Batteries in China (by Province/Municipality), 2013-2015
Division of Global Lithium Battery Manufacturers
Competitive Landscape of Global Small Lithium Battery Manufacturers, 2014
Share of Global New Energy Passenger Car-use Battery Manufacturers, 2014
Global New Energy Passenger Car-use Power Lithium Battery Shipment and Share, 2013-2014
Competitive Landscape of Chinese Lithium Battery Market, 2014
Major Lithium Battery Manufacturers in China
Power Lithium Battery Supply System in China
New Energy Passenger Car-use Power Battery Supply Structure in China (by Technology), 2015H1
Market Share of Major Battery Manufacturers, 2015H1
Shipment of Major Battery Manufacturers, 2015H1 (MWh)
Global Marketing Network of Mitsubishi Chemical
Development History of Mitsubishi Chemical
Distribution of Mitsubishi Chemical’s Major Production Bases
Distribution of Mitsubishi Chemical’s Lithium Battery Electrolyte Production Bases and Capacity
Lithium Battery Electrolyte Sales Volume of Mitsubishi Chemical, FY2010-FY2016E
Main Layout of Mitsubishi Chemical in China
Revenue and Operating Income of Mitsubishi Chemical, FY2008-FY2015
Main Affiliates of UBE Industries
Development History of UBE Industries
Main Products of UBE Industries
Lithium Battery Electrolyte Sales Volume of UBE Industries, FY2010-FY2016E
Electrolyte Production Bases of UBE Industries
Revenue and Operating Income of UBE Industries, FY2009-FY2015
Panax-Etec’s Global layout
Panax-Etec’s Development History
Panax-Etec’s Lithium Battery Electrolyte Sales Volume, 2011-2016
LGC’s Global Marketing Network
LGC’s Equity Structure, 2015
LGC’s Development History
LGC’s Information Electronic Materials Business
LGC’s Electrolyte Sales Volume, 2012-2016E
LGC’s Lithium Battery Electrolyte Sales Structure (by Product)
LGC’s Operation, 2013-2014
LGC’s Revenue Structure (by Product), 2014
LGC Revenue Structure (by Region), 2013-2014
LGC’s Output (by Region), 2011-2013
BSF’s Layout in Asia-Pacific
BSF’s Lithium Battery Material Production Bases
Global Layout of Mitsui Chemicals
Capchem’s Global Industrial Distribution
Capchem’s Affiliates
Capchem’s Development History
Capchem’s Main Lithium Battery Electrolyte Products
Capchem’s R&D Investment, 2011-2014
Capchem’s Lithium Battery Electrolyte Clients
Capchem’s Lithium Battery Electrolyte Capacity, 2011-2015
Capchem’s Production Bases and Marketing Network
Capchem’s Lithium Battery Electrolyte Sales Volume and Growth Rate, 2006-2016E
Capchem’s Lithium Battery Electrolyte Revenue, 2011-2015
Capchem’s Core Competitiveness
Capchem’s Revenue and Net Income, 2009-2015
Affiliates of Guotai Huarong
Development History of Guotai Huarong, 2000-2014
Main Products of Guotai Huarong
Guotai Huarong’s Products to be Developed
Lithium Battery Electrolyte Clients of Guotai Huarong
Lithium Battery Electrolyte Sales Volume and Revenue of Guotai Huarong, 2011-2015
Core Competitiveness of Guotai Huarong
Revenue and Net Income of Guotai Huarong, 2008-2015
Tinci’s Affiliates
Tinci’s Development History
Tinci’s Main Products
Tinci’s Lithium Battery Electrolyte Customers
Tinci’s Marketing Network in China
Tinci’s Lithium Battery Electrolyte Capacity
Tinci's Lithium Battery Electrolyte Sales Volume and Gross Margin, 2010-2016E
Tinci's Core Competitiveness
Tinci's Revenue and Net Income, 2009-2015
Jinniu's Affiliates
Jinniu's Development History
Jinniu's Lithium Battery Electrolyte Customers
Jinniu's Lithium Battery Electrolyte Sales Volume, 2011-2016E
Jinniu's Core Competitiveness
Shanshan's Affiliates
Shanshan's Development History
Shanshan's Main Electrolyte Products
Shanshan's Lithium Battery Electrolyte Customers
Shanshan's Suppliers
Shanshan's Lithium Battery Electrolyte Sales Volume, 2009-2016E
Shanshan's Revenue and Net Income, 2009-2015
Smoothway Main Products Capacity, 2015
Smoothway Electrolyte Sales Volume, 2013-2016E
Electrolyte Sales Volume of Beijing Institute of Chemical Reagents, 2013-2016E
Electrolyte Sales Volume of Jinguang High-Tech, 2013-2016E
Revenue and Net Income of Chuangya Power Battery Materials, 2012-2015
Growth Rate of Global and China's Lithium Battery Electrolyte Sales Volume, 2012-2020E
Global Lithium Battery Electrolyte Sales Structure, 2015
Growth Rate of Global Lithium Battery Demand, 2014-2020E
Revenue Growth Rate of Global Major Lithium Battery Electrolyte Manufacturers, 2009-2015
Competitive Landscape of Global Lithium Battery Electrolyte Market, 2014
Global and China Optical Fiber Preform Industry Report, 2021-2026
Optical fiber preforms play a key role in the optical fiber communication industry chain. The global construction of 4G and FTTH requires less optical fiber and cable, which has dragged down the deman...
Global and China Photoresist Industry Report, 2021-2026
Since its invention in 1959, photoresist has been the most crucial process material for the semiconductor industry. Photoresist was improved as a key material used in the manufacturing process of prin...
Global and China Needle Coke Industry Report, 2021-2026
Needle coke is an important carbon material, featuring a low thermal expansion coefficient, a low electrical resistivity, and strong thermal shock resistance and oxidation resistance. It is suitable f...
Global and China 3D Glass Industry Report, 2021-2026
3D curved glass is light and thin, transparent and clean, anti-fingerprint, anti-glare, hard and scratch-resistant, and performs well in weather resistance. It is applicable to terminals such as high-...
Global and China Graphene Industry Report, 2020-2026
Graphene, a kind of 2D carbon nanomaterial, features excellent properties such as mechanical property and super electrical conductivity and thermal conductivity. Its downstream application ranges from...
Global and China Optical Fiber Preform Industry Report, 2020-2026
Optical fiber preform as a hi-tech product and a crucial link in the optical fiber industry chain contributes to 70% or so of profit margin. Global 4G and FTTH construction at dusk leads to the shrink...
Global and China 3D Glass Industry Report, 2020-2026
Global 3D glass market has been enlarging over the recent years amid demetallization of smartphone back covers and popularity of smart wearables, to approximately $2.86 billion in 2019 and to an estim...
Global and China Photoresist Industry Report, 2020-2026
In 2019, global photoresist market was valued at $8.3 billion, growing at a compound annual rate of 5.1% or so since 2010, and it will outnumber $12.7 billion in 2026 with advances in electronic techn...
Global and China Synthetic Diamond Industry Report, 2020-2026
While its mechanical property is given full play in fields like grinding and cutting, diamond with acoustic, optical, magnetic, thermal and other special properties, as superconducting material, intel...
Global and China Needle Coke Industry Report, 2020-2026
With the merits like small resistivity, excellent resistance to impact and good anti-oxidation property, needle coke has been widely used in ultra-high power graphite electrodes, nuclear reactor decel...
Global and China Optical Fiber Preform Industry Report, 2019-2025
Optical fiber preform, playing an important role in the optical fiber and cable industry chain, seizes about 70% profits of optical fiber. Global demand for optical fiber preform stood at 16.2kt in 20...
China Silicon Carbide Industry Report, 2019-2025
Silicon carbide (SiC) is the most mature and the most widely used among third-generation wide band gap semiconductor materials. Over the past two years, global SiC market capacity, however, hovered ar...
Global and China Photoresist Industry Report, 2019-2025
Photoresist, a sort of material indispensable to PCB, flat panel display, optoelectronic devices, among others, keeps expanding in market size amid the robust demand from downstream sectors. In 2018, ...
Global and China Graphene Industry Report, 2019-2025
Graphene is featured with excellent performance and enjoys a rosy prospect. The global graphene market was worth more than $100 million in 2018, with an anticipated CAGR of virtually 45% between 2019 ...
Global and China 3D Glass Industry Chain Report, 2019-2025
The evolution of AMOLED conduces to the steady development of 3D curved glass market. In 2018, the global 3D glass market expanded 37.7% on an annualized basis and reached $1.9 billion, a figure proje...
China Wood Flooring Industry Report, 2019-2025
With the better standard of living and the people’s desire for an elegant life, wood flooring sees a rising share in the flooring industry of China, up from 33.9% in 2009 to 38.9% in 2018, just behind...
Global and China Photovoltaic Glass Industry Report, 2019-2025
In China, PV installed capacity has ramped up since the issuance of photovoltaic (PV) subsidy policies, reaching 53GW in 2017, or over 50% of global total. However, the domestic PV demand was hit by t...
Global and China ITO Targets Industry Chain Report, 2019-2025
Featured by good electrical conductivity and transparency, ITO targets are widely applied to fields of LCD, flat-panel display, plasma display, touch screen, electronic paper, OLED, solar cell, antist...