Global and China MO Source Industry Report, 2016-2020
-
July 2016
- Hard Copy
- USD
$1,950
-
- Pages:88
- Single User License
(PDF Unprintable)
- USD
$1,800
-
- Code:
ZHP041
- Enterprise-wide License
(PDF Printable & Editable)
- USD
$2,700
-
- Hard Copy + Single User License
- USD
$2,150
-
MO source (also known as high-purity metal organic compound) is one of the core materials for manufacturing LED, new generation of solar cells, phase change memory, semiconductor laser, RFIC (radio frequency integrated circuit) chip, etc.
In 2015, global MO source demand attained 56.2 tons, edging down 3.3% YoY, mainly because: first, LED product penetration had been close to saturation in the field of large-screen TV backlight and LED TV backlight market demand started to shrink; second, flip-chip LED technology squeezed the market space of LED backlight.
In 2015, output value of Chinese LED upstream epitaxial chips, midstream packaging and downstream application rose 8.3%, 13.0% and 15.8% respectively, thus driving Chinese MO source demand to go up by 15.3% YoY to 27.1 tons. In 2016, stimulated by favorable factors such as “Made in China 2025” and “One Belt and One Road”, China’s LED industry will continue to enjoy steady development and see MO source demand growing to 29.9 tons.
Due to high technical barriers, the whole MO source industry is now in oligopoly and monopolistic competition. In 2015, global MO source market CR5 reached 94.5%.
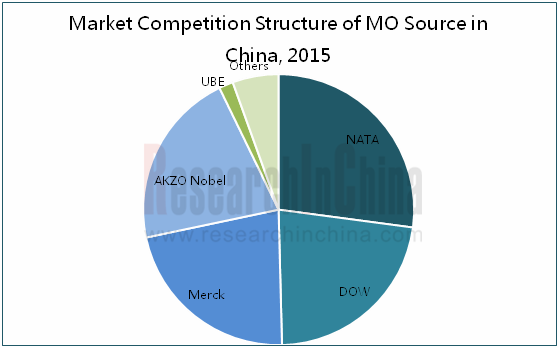
Jiangsu Nata Opto-electronic Material Co., Ltd.boasting MO source capacity of 27.5t/a is the biggest MO source manufacturer in China. In June 2016, it put a 2.5t/a trimethylindium production line and two trimethylindium purification lines into production.
Dow, one of the world’s leading MO source suppliers, entered the field of MO source through the acquisition of Rohm & Haas in 2009. In November 2015, it announced the forthcoming merger with DuPont. Currently, matters relating to the merger are steadily advancing.
Suzhou Pure Opto-electronic Material Co., Ltd. is a newcomer in the field of MO source. In 2016, it has formed an annual production capacity including 10 tons of trimethylgallium, 2.5 tons of triethylgallium and 800 kilograms of trimethylindium. Along with the ongoing research and development of triethylindium, magnesium, trimethylaluminum and more, the company is expected to achieve the production of MO source series in years to come.
The report highlights the following:
 General development situation, supply, demand, competition pattern, etc of global MO source industry;
Development environment, supply, demand, market price trend, etc. of Chinese MO source industry;
Market overview, market size, market structure, market price, etc. of main upstream industries (gallium, indium, etc.) and downstream application industries (LED, new solar cell, phase change memory, semiconductor laser, RFIC chip, etc.) of MO source;
Operation, layout-in-China, revenue structure, MO source business, etc. of 9 global MO source manufacturers.
1. Overview of MO Source Industry
1.1 Introduction
1.2 Classification and Application
1.3 Industry Chain
1.4 Industry Characteristics
1.4.1 High Concentration
1.4.2 Slowing Growth
2. Development of Global MO Source Industry
2.1 Overview
2.2 Supply
2.3 Demand
2.3.1 Quantity Demanded
2.3.2 Demand Structure
2.3.3 Factors Influencing Demand
2.4 Competition Pattern
2.5 America
2.6 Taiwan
2.7 South Korea
2.8 Europe
2.9 Japan
3. Development of MO Source Industry in China
3.1 Development Environment
3.1.1 Policy Environment
3.1.2 Trade Environment
3.1.3 Technical Environment
3.2 Supply
3.2.1 Production Capacity
3.2.2 Capacity Structure
3.3 Demand
3.4 Price Trend
4. Upstream and Downstream Sectors of MO Source
4.1 Upstream Sectors
4.1.1 Gallium
4.1.2 Indium
4.2 LED Industry
4.2.1 LED Market Scale
4.2.2 MOCVD and LED Chip Market
4.2.3 LED Encapsulation Market
4.2.4 LED Application Market
4.2.5 Competition Pattern
4.3 Other Downstream Sectors
4.3.1 New Solar Cell
4.3.2 Phase Change Memory
4.3.3 Semiconductor Laser
4.3.4 RFIC Chip
5. Key Enterprises Worldwide
5.1 DOW
5.1.1 Profile
5.1.2 Operation
5.1.3 Revenue Structure
5.1.4 MO Source Business
5.1.5 Business in China
5.2 Merck
5.2.1 Profile
5.2.2 Operation
5.2.3 MO Source Business-SAFC Hitech
5.2.4 Business in China
5.3 AKZO Nobel
5.3.1 Profile
5.3.2 Operation
5.3.3 Revenue Structure
5.3.4 MO Source Business
5.3.5 Business in China
5.4 Sumitomo Chemical
5.4.1 Profile
5.4.2 Operation
5.4.3 Revenue Structure
5.4.4 MO Source Business
5.4.5 Business in China
5.5 Albemarle
5.5.1 Profile
5.5.2 Operation
5.5.3 Revenue Structure
5.5.4 MO Source Business
5.5.5 Business in China
5.6 Chemtura
5.6.1 Profile
5.6.2 Operation
5.6.3 Revenue Structure
5.6.4 MO Source Business
5.6.5 Business in China
5.7 Lake LED Materials
5.7.1 Profile
5.7.2 MO Source Business
5.8 UBE
5.8.1 Profile
5.8.2 Operation
5.8.3 Revenue Structure
5.8.4 MO Source Business
5.9 Nata Opto-electronic
5.9.1 Profile
5.9.2 Operation
5.9.3 Revenue Structure
5.9.4 Gross Margin
5.9.5 Production and Sales
5.9.6 Key Projects
6. Summary and Forecast
6.1 Market
6.2 Enterprises
Application of MO Source
Industrial Chain of MO Source
Proportion of MO Source in LED Production Process
Global MO Source Supply, 2010-2020
Demand of MOCVD Standalone for MO Source
Global MO Source Demand, 2010-2020E
Global MO Source Demand by Industry, 2010-2016
Global LED Backlight Penetration Rate by Field, 2008-2015
Global LED TV Backlight Output Value, 2012-2016
Output Value and Growth Rate of Global HB-LED Products, 2010-2016
Number of Newly Added MOCVD Machines and Ownership Worldwide, 2010-2020E
Global MOCVD Ownership by Region, 2015
Global MO Source Capacity by Region, 2016
Number of Newly Added MOCVD Machines in Taiwan, 2009-2016
Number of Newly Added MOCVD Machines in South Korea, 2009-2016
Production Bases and Major Customers of MO Source in Japan
Distribution of Japanese LED Industry
Policies about MO Source Industry in China, 2011-2016
Capacity of MO Source in China, 2010-2020E
Capacity of MO Source in China by Product, 2010-2016
Competition Pattern of Chinese MO Source Companies, 2016
MOCVD Purchase Plan of China's Local Governments, 2010-2015
Demand for MO Source in China, 2010-2020E
Average Price of MO Source Products in China, 2009-2016
Output of Gallium in China, 2015
Price of Gallium (Purity ≥99.99%) in China, 2010-2015
Global Indium Consumption Structure, 2015
Output and Sales Volume of Indium in China, 2009-2016
Market Price of Indium (Purity ≥99.99%) in China, 2010-2015
LED Industry Chain
Driving Factors of LED Industry, 2005-2015
Global LED Output Value and Growth Rate,2007-201
Total Output Value and Growth Rate of LED Industry in China, 2010-2016
Major Mergers of LED Industry, 2015
Ownership and Growth Rate of MOCVD Machines in China, 2010-2016E
MOCVD Capacity Utilization and Operating Rate in China, 2012-2015
Output Value and Growth Rate of LED Epitaxial Chip in China, 2010-2016
Major LED Epitaxial Chip Companies in China
Output Value and Growth Rate of LED Encapsulation Industry in China, 2010-2016
Output Value and Growth Rate of LED Application Industries in China, 2011-2016
LED Output Value by Application, 2013-2015
Business of Key LED Companies in China
Classification of Solar Photovoltaic Cell
Performance Comparison between Thin-Film Solar Cells and Crystalline-Silicon Solar Cells
Global Solar Cell Output and Growth Rate, 2010-2020E
Global Solar Cell Output Structure (by Product), 2003-2016
China’s Solar Cell Output and Growth Rate, 2011-2020E
China’s Solar Cell Output Structure (by Region), 2015
China’s Solar Cell Export Value Structure (by Country), 2015
China’s Solar Cell Export Volume Structure (by Country), 2015
Performance Comparison of Different Types of Solar Cells
Output of GaAs Solar Cell in China, 2010/2015/2020
Development Process of Memory
Sales and Net Income of Dow, 2010-2016
Revenue Structure of Dow by Business, 2015
Production Bases of Dow Electronic Materials
Revenue of Dow's Electronic Materials Division by Region, 2015
Revenue of Dow's Electronic Materials Division by Business, 2015
Merck’s Sales and Profits, 2009-2015
Merck’s Revenue Structure (by Business), 2014-2015
Merck’s Revenue Structure (by Region), 2015
Revenue of MerckPerformance Materials, 2014-2015
Revenue Structure of MerckPerformance Materials (by Region), 2015
Distribution of SAFC’s MO Source Production Bases
Revenue and Net Income of AKZO Nobel, 2009-2016
Revenue Structure of AKZO Nobel by Business, 2012-2016
Revenue Structure of AKZO Nobel by Region, 2015
Revenue of AKZO Nobel's Functional Chemicals, 2012-2015
Revenue Structure of AKZO Nobel's Functional Chemicals by Region, 2015
Revenue and Growth Rate of AKZO Nobel in China, 2010-2015
Production Bases of Functional Chemical Products of AKZO Nobel in China
Revenue and Net Income of Sumitomo Chemical, FY2009- FY2015
Revenue of Sumitomo Chemical by Business, FY2015
Branch Companies of Sumitomo Chemical and Their Primary Business
Albemarle’s Global Layout
Revenue and Net Income of Albemarle, 2010-2016
Revenue of Albemarle by Business, 2015
Albemarle’s Layout in China
Chemtura’s Global Layout
Sales and Net Income of Chemtura, 2009-2016
Revenue of Chemtura by Business, 2015
Revenue Structure of Chemtura by Region, 2015
Main MO Source Products of Lake LED Materials
Main Affiliated Companies of Ube
Revenue and Operating Income of Ube, FY2009-FY2015
Revenue Breakdown of Ube (By Business), FY2015
Revenue Breakdown of Ube (By Region), FY2015
Operation of Ube Chemicals, FY2014-FY2015
Equity Structure of Nata Opto-electronic, 2015
Revenue and Net Income of Nata Opto-electronic, 2009-2016
Revenue of Nata Opto-electronic by Product, 2009-2015
Revenue of Nata Opto-electronic by Region, 2009-2015
Gross Margin of Nata Opto-electronic by Product, 2009-2015
Sales Volume and Unit Price of Nata Opto-electronic, 2010-2015
Key Projects of Nata Opto-electronic, 2015
Capacity of Nata Opto-electronic, 2010-2016
Global and Chinese MO Source Demand Growth Rate, 2010-2020E
Growth Rate of LED Chip and Encapsulation Output Value in China, 2010-2016
Revenue Growth Rate of Major Global MO Source Companies, 2010-2015
Competition Pattern of Global MO Source Companies, 2015
Global and China Optical Fiber Preform Industry Report, 2021-2026
Optical fiber preforms play a key role in the optical fiber communication industry chain. The global construction of 4G and FTTH requires less optical fiber and cable, which has dragged down the deman...
Global and China Photoresist Industry Report, 2021-2026
Since its invention in 1959, photoresist has been the most crucial process material for the semiconductor industry. Photoresist was improved as a key material used in the manufacturing process of prin...
Global and China Needle Coke Industry Report, 2021-2026
Needle coke is an important carbon material, featuring a low thermal expansion coefficient, a low electrical resistivity, and strong thermal shock resistance and oxidation resistance. It is suitable f...
Global and China 3D Glass Industry Report, 2021-2026
3D curved glass is light and thin, transparent and clean, anti-fingerprint, anti-glare, hard and scratch-resistant, and performs well in weather resistance. It is applicable to terminals such as high-...
Global and China Graphene Industry Report, 2020-2026
Graphene, a kind of 2D carbon nanomaterial, features excellent properties such as mechanical property and super electrical conductivity and thermal conductivity. Its downstream application ranges from...
Global and China Optical Fiber Preform Industry Report, 2020-2026
Optical fiber preform as a hi-tech product and a crucial link in the optical fiber industry chain contributes to 70% or so of profit margin. Global 4G and FTTH construction at dusk leads to the shrink...
Global and China 3D Glass Industry Report, 2020-2026
Global 3D glass market has been enlarging over the recent years amid demetallization of smartphone back covers and popularity of smart wearables, to approximately $2.86 billion in 2019 and to an estim...
Global and China Photoresist Industry Report, 2020-2026
In 2019, global photoresist market was valued at $8.3 billion, growing at a compound annual rate of 5.1% or so since 2010, and it will outnumber $12.7 billion in 2026 with advances in electronic techn...
Global and China Synthetic Diamond Industry Report, 2020-2026
While its mechanical property is given full play in fields like grinding and cutting, diamond with acoustic, optical, magnetic, thermal and other special properties, as superconducting material, intel...
Global and China Needle Coke Industry Report, 2020-2026
With the merits like small resistivity, excellent resistance to impact and good anti-oxidation property, needle coke has been widely used in ultra-high power graphite electrodes, nuclear reactor decel...
Global and China Optical Fiber Preform Industry Report, 2019-2025
Optical fiber preform, playing an important role in the optical fiber and cable industry chain, seizes about 70% profits of optical fiber. Global demand for optical fiber preform stood at 16.2kt in 20...
China Silicon Carbide Industry Report, 2019-2025
Silicon carbide (SiC) is the most mature and the most widely used among third-generation wide band gap semiconductor materials. Over the past two years, global SiC market capacity, however, hovered ar...
Global and China Photoresist Industry Report, 2019-2025
Photoresist, a sort of material indispensable to PCB, flat panel display, optoelectronic devices, among others, keeps expanding in market size amid the robust demand from downstream sectors. In 2018, ...
Global and China Graphene Industry Report, 2019-2025
Graphene is featured with excellent performance and enjoys a rosy prospect. The global graphene market was worth more than $100 million in 2018, with an anticipated CAGR of virtually 45% between 2019 ...
Global and China 3D Glass Industry Chain Report, 2019-2025
The evolution of AMOLED conduces to the steady development of 3D curved glass market. In 2018, the global 3D glass market expanded 37.7% on an annualized basis and reached $1.9 billion, a figure proje...
China Wood Flooring Industry Report, 2019-2025
With the better standard of living and the people’s desire for an elegant life, wood flooring sees a rising share in the flooring industry of China, up from 33.9% in 2009 to 38.9% in 2018, just behind...
Global and China Photovoltaic Glass Industry Report, 2019-2025
In China, PV installed capacity has ramped up since the issuance of photovoltaic (PV) subsidy policies, reaching 53GW in 2017, or over 50% of global total. However, the domestic PV demand was hit by t...
Global and China ITO Targets Industry Chain Report, 2019-2025
Featured by good electrical conductivity and transparency, ITO targets are widely applied to fields of LCD, flat-panel display, plasma display, touch screen, electronic paper, OLED, solar cell, antist...