Global and China Superabsorbent Polymers (SAPs) Industry Report, 2016-2020
-
Aug.2016
- Hard Copy
- USD
$2,200
-
- Pages:113
- Single User License
(PDF Unprintable)
- USD
$2,000
-
- Code:
CHY050
- Enterprise-wide License
(PDF Printable & Editable)
- USD
$3,000
-
- Hard Copy + Single User License
- USD
$2,400
-
Super absorbent resin (SAP) is the key raw material with which to produce disposable hygiene products like baby diapers, feminine hygiene products, and adult incontinence products. SAP has super water absorbing capacity. At present, the global paper diaper market is experiencing rapid development, with an AAGR of over 15%. In 2015, the global SAP consumption increased by 8.0% year on year to 2.3 million tons. It is expected that in 2016~2020 the consumption would grow at a compound annual rate of some 7.8%, to an estimated 3.48 million tons by 2020.
At the end of 2015, the global SAP capacity reached 3.489 million tons per year, up 12.0% from a year earlier. And China contributed the largest portion of the global capacity, at 30.5% of the total.
China's SAP has developed at an astonishing paceover the past two years, with 2015’s consumption rising 21.3% to 382 kilotons. However, with the introduction of Two-child Policy, and particularly driven by the rapid development of disposable hygiene products market, the SAP consumption in China is expected to grow at an average annual rate of 20% in 2016-2020, to 1.02 million tons by 2020.
Competitive Landscape of SAP:
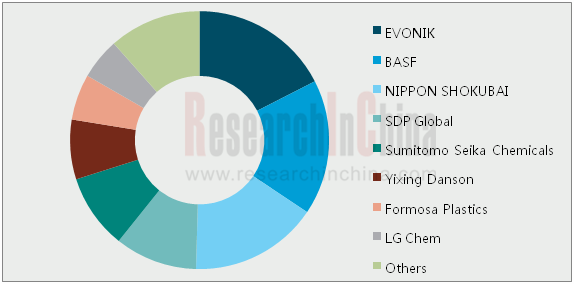
Form the corporate perspective, the global SAP market is monopolized by Japanese and German manufacturers. In 2015, the top five global producers—Evonik, Nippon Shokubai, BASF, Sumitomo Seika Chemicals, and SDP Global accounted for an aggregate of 70.1% of the global total capacity.
At present, there are more than 20 SAP producers in China, which are mainly wholly foreign-owned companies or joint ventures. In 2015, Yixing Danson Technology, San-Dia Polymers (Nantong), Formosa Industries (Ningbo), BASF-YPC Company Limited, and Nisshoku Chemical Industry (Zhangjiagang) occupied a combined 63.0% of the total capacity in China.
Prices of SAP:
In 2013-2016, affected by economic slowdown, rapid growth of SAP capacity, and overcapacity of upstream raw materials, the average prices for SAP declined year by year, to RMB15,500/ton at the end of 2013. But the price dropped to RMB9,150/ton through 2015. In 2016, the price fluctuated at around RMB9,000. The quoted prices of major producers stood at about RMB10,000, but the actual prices were still highly flexible.
The prices for overseas SAP products have also showed downward trend. This has been particularly true in the past two years, with the prices for Japanese SAP products falling from RMB16,000/ton in 2014 to RMB12,000/ton in 2016. Nevertheless, the Chinese SAP products have a certain gap in price with foreign products, which is mainly related to the fact that the Chinese SAP products have a certain gap in technology and quality with foreign products.
Market Share of Major Global Manufacturers by SAP Capacity, 2015
 ?
?
Source: ResearchInChina
Global and China Superabsorbent Polymers (SAP) Industry Report, 2016-2020 mainly focuses on the following:
 Supply and demand, regional structure, and competitive landscape of the global SAP market;
Supply and demand, regional structure, and competitive landscape of China’s SAP market;
Supply and demand and development trend of acrylic acid in China;
Market size, SAP demand, and development trend of China’s major SAP downstream sectors including baby diaper pads, adult incontinence products , and feminine hygiene products;
Operation and development in China of 6 global SAP companies;
Operation and development strategy of 12 key Chinese SAP companies;
Prediction of development trend in global and China SAP market, 2016-2020.
1 Overview
1.1 Definition
1.2 Classification
1.3 Production Technology
1.4 Industry Chain
2 Development of Global SAP Industry
2.1 Market Supply
2.2 Market Demand
2.3 Regional Structure
2.4 Competitive Landscape
3 Development of China’s SAP Industry
3.1 Market Supply
3.1.1 Capacity
3.1.2 Output
3.2 Market Demand
3.2.1 Consumption
3.2.2 Consumption Structure
3.3 Regional Structure
3.4 Import and Export
3.5 Price
3.6 Competitive Landscape
4 China’s Acrylic Acid Market
4.1 Development
4.2 Supply and Demand
4.2.1 Capacity
4.2.2 Output
4.2.3 Consumption
4.3 Import and Export
4.4 Price
4.5 Competitive Landscape
5 Downstream Sectors of China’s SAP Industry
5.1 Disposable Baby Diapers
5.1.1 Market Size
5.1.2 Competitive Landscape
5.1.3 SAP Demand
5.1.4 Development Trend
5.2 Adult Incontinence Products
5.2.1 Market Size
5.2.2 Corporate Landscape
5.2.3 SAP Demand
5.2.4 Development Trend
5.3 Feminine Hygiene Products
5.3.1 Market Size
5.3.2 SAP Demand
6. Major Global SAP Manufacturers
6.1 EVONIK
6.1.1 Profile
6.1.2 Operation
6.1.3 Revenue Structure
6.1.4 SAP Business
6.1.5 Development in China
6.2 Nippon Shokubai
6.2.1 Profile
6.2.2 Operation
6.2.3 Revenue Structure
6.2.4 SAP Business
6.2.5 Nisshoku Chemical Industry (Zhangjiagang) Co., Ltd.,
6.2.6 Development Strategy
6.3 BASF
6.3.1 Profile
6.3.2 Operation
6.3.3 Revenue Structure
6.3.4 R&D
6.3.5 SAP BUSINESS
6.3.6 Development in China
6.4 Sumitomo Seika Chemicals
6.4.1 Profile
6.4.2 Operation
6.4.3 Revenue Structure
6.4.4 SAP BUSINESS
6.4.5 Development in China
6.5 SDP Global
6.5.1 Profile
6.5.2 San-Dia Polymers (Nantong) Co., Ltd.
6.6 Kao Corporation
6.6.1 Profile
6.6.2 Operation
6.6.3 Revenue Structure
6.6.4 SAP Business
6.6.5 Development in China
7. Major Chinese SAP Manufacturers
7.1 Formosa Plastics Corporation
7.1.1 Profile
7.1.2 Operation
7.1.3 Revenue Structure
7.1.4 Gross Profit
7.1.5 R&D
7.1.6 SAP BUSINESS
7.1.7 Formosa Super Absorbent Polymer (Ningbo) Co., Ltd.
7.2 Zhejiang Satellite Petrochemical Co., Ltd (002648)
7.2.1 Profile
7.2.2 Operation
7.2.3 Revenue Structure
7.2.4 Gross Margin
7.2.5 R&D and Ongoing Projects
7.2.6 SAP Business
7.2.7 Development Prospects
7.3 Yixing Danson Technology
7.3.1 Profile
7.3.2 Operation
7.3.3 Clients and Suppliers
7.3.4 Capacity
7.4 BASF-YPC Company Limited
7.4.1 Profile
7.4.2 Operation
7.4.3 SAP BUSINESS
7.5 Shandong Nuoer Bio-Tech Co., Ltd.
7.5.1 Profile
7.5.2 Capacity
7.6 Quanzhou Banglida Technology Industry Co., Ltd.
7.7 Zhejiang Weilong Polymer Material Co., Ltd.
7.8 Shanghai Huayi Acrylic Acid Co., Ltd.
7.8.1 Profile
7.8.2 Operation
7.8.3 Project Planning
7.9 Shandong ZhongkeBoyuan New Material Technology Co., Ltd.
7.10 Tangshan Boya Resin Co., Ltd.
7.11 Jinan Haoyue Absorbent Materials Co., Ltd.
7.11.1 Profile
7.11.2 Operation
7.12 Wanhua Chemical Group Co., Ltd. (600309)
7.12.1 Profile
7.12.2 Operation
7.12.3 Revenue Structure
7.12.4 Gross Margin
7.12.5 SAP Business
8 Conclusion and Prediction
8.1 Enterprise
8.2 Market
8.2.1 Global
8.2.2 China
Classification of Superabsorbent Polymers
Production Process of SAP (by Polymerization Method)
SAP’s Counter-phase Suspension Polymerization and Water Solution Polymerization
SAP Industry Chain
Global SAP Capacity and YoY Growth, 2008-2016
Global SAP Consumption and YoY Growth,2009-2016
Global SAP Consumption Structure by Application, 2016
Global SAP Capacity by Region/Country, 2013-2016
Global SAP Capacity Structure by Region/Country, 2014-2016
Capacity of Major Global SAP Enterprises by Region/Country,, 2013-2016
Capacity and YoY Growth of SAP in China, 2009-2016
Capacity and YoY Growth of SAP in China, 2009-2016
SAP Capacity Utilization in China, 2009-2016
SAP Consumption and YoY Growth of SAP in China, 2010-2016
SAP Consumption Structure in China by Product, 2015-2016
SAP Capacity in China by Region, 2013-2016
Import Volume, Import Value, and Import Price of SAP Products in China, 2013-2016
Export Volume, Export Value, and Export Price of SAP Products in China, 2013-2016
Price Trend for SAP in China, 2013-2016
SAP Product Quotation of Major Chinese Manufacturers, 2016
Capacity of SAP in China by Enterprise, 2013-2016
Capacity and YoY Growth of Acrylic Acid in China, 2006-2016
Major Acrylic Acid Projects (under Construction) in China 2016-2017
Output of Acrylic Acid in China, 2008-2015
Apparent Consumption of Acrylic Acid in China, 2008-2015
Import and Export Volume of Acrylic Acid in China, 2008-2016
Import Price of Acrylic Acid in China, 2008-2016
Export Price of Acrylic Acid in China, 2008-2016
Average Market Price of Acrylic Acid in China, 2012-2016
China’s Newly-born Population and Fertility Rate, 2008-2015
Market Penetration of Baby Diapers in China, 2009-2016E
Revenue and YoY Growth of Baby Diapers in China, 2009-2015
Consumption of Baby Diapers in China by Product, 2009-2015
Output of Baby Diaper Pads in China by Product, 2009-2015
Market Share of Paper Diapers in China, 2015
Brands and Capacity of Major Chinese Baby Diaper Pads Manufacturers, 2015
Output, Consumption, and Expenditure of Baby Diaper Pads in China, 2013-2020E
Cost Structure of Paper Diapers by Raw Material, 2015
SAP Demand and Market Size of Baby Diaper Pads in China, 2012-2020E
Population and YoY Growth of Over-65s in China, 2008-2015
Market Size and YoY Growth of Adult Incontinence Products in China, 2009-2015
Output of Adult Incontinence Products in China by Product, 2009-2015
Consumption of Adult Incontinence Products in China by Product, 2009-2015
Major Adult Incontinence Products Manufacturers in China, 2016
Output and Consumption of Adult Incontinence Products in China by Product, 2012-2020
SAP Demand and Market Size of Adult Incontinence Products in China, 2012-2020E
Market Size and YoY Growth of Feminine Hygiene Products in China, 2009-2015
Output of Feminine Hygiene Products in China by Product, 2009-2015
Consumption of Feminine Hygiene Products in China by Product, 2009-2015
Output, Consumption, and Market Size of Feminine Hygiene Products in China by Product, 2012-2020E
SAP Demand and Market Size of Feminine Hygiene Products in China, 2012-2020E
EVONIK’s Business Segments
EVONIK’s Revenue and Net Income, 2010-2016
EVONIK’s Revenue by Business, 2010-2016
EVONIK’s Revenue Structure by Region, 2015-2016H1
EVONIK’s SAP Capacity, 2013-2016
EVONIK’s External Sales in China, 2013-2015
Nippon Shokubai’s Product Distribution by Segment
Nippon Shokubai’s Net Sales and Net Income, FY2009-FY2015
Nippon Shokubai’s Revenue by Segment, FY2009-FY2015
Nippon Shokubai’s Revenue Structure by Country/Region, FY2009-FY2015
Nippon Shokubai’s SAP and Acrylic Acid Capacity, 2012-2020E
SAP and Acrylic Acid Capacity and New Projects of Nippon Shokubai by Country, as of the End of March 2016
Nippon Shokubai’s Development Goal, 2020
BASF’s Structure by Business
BASF’s Revenue and Net Income, 2008-2016
BASF’s Revenue by Business, 2012-2016
BASF’s Revenue Structure by Region, 2012-2016
BASF’s R&D Costs and % of Total Revenue, 2008-2015
BASF’s R&D Costs by Segment, 2015
BASF’s SAP and Acrylic Acid Capacity by Region, 2013-2015
BASF’s SAP Capacity, 2009-2016
Completion Time and Capacity of BASF’s SAP-related Acrylic Acid and Esters Project under Construction, 2016
Distribution of BASF’s Production Bases in China, 2016
BASF’s Major Enterprises in China and Their Geographical Distribution, 2016
BASF’s Revenue in China, 2007-2015
BASF’s Major Completed/Ongoing Projects in China, 2016
Revenue and Net Income of Sumitomo Seika Chemicals, FY2010-FY2016E
Revenue Structure of Sumitomo Seika Chemicals by Business, FY2013-FY2015
SAP Revenue and Operating Income of Sumitomo Seika Chemicals, FY2011-FY2016
SAP Capacity of Sumitomo Seika Chemicals by Country, 2014-2016E
SAP Capacity of SDP Global by Country/Region as of the End of 2014-2018E
Kao’s Product Distribution by Business
Kao’s Revenue and Net Income, 2012-2016
Kao’s Revenue Structure by Business, 2012-2016
Kao’s Revenue Structure by Region, 2013-2015
Kao’s Subsidiaries in China, 2016
Capacity of Formosa Plastics Corporation by Product, 2009-2015
Revenue and Net Income of Formosa Plastics Corporation, 2009-2016
Revenue of Formosa Plastics Corporation by Business, 2013-2016
Revenue Structure of Formosa Plastics Corporation by Region, 2012-2015
Gross Profit and Gross Margin of Formosa Plastics Corporation, 2009-2016
R&D Costs and % of Total Revenue of Formosa Plastics Corporation, 2010-2016
SAP Revenue and YoY Growth of Formosa Plastics Corporation, 2010-2015
SAP Revenue of Formosa Plastics Corporation by Region, 2010-2015
SAP Capacity, Output, Sales Volume, Capacity Utilization, and Sales-output Ratio of Formosa Plastics Corporation, 2010-2015
SAP Capacity of Formosa Plastics Corporation by Region, 2010-2016
Revenue and Operating Income of Formosa Super Absorbent Polymer (Ningbo), 2012-2015
Capacity of Zhejiang Satellite Petro-Chemical by Product, 2008-2015
Revenue and Net Income of Zhejiang Satellite Petro-Chemical, 2009-2016
Operating Revenue of Zhejiang Satellite Petro-Chemical by Product, 2009-2016
Operating Revenue of Zhejiang Satellite Petro-Chemical by Region, 2008-2016
Gross Margin of Zhejiang Satellite Petro-Chemical by Product, 2008-2016
R&D Costs and % of Total Revenue of Zhejiang Satellite Petro-Chemical, 2008-2015
Major Proposed Projects of Zhejiang Satellite Petro-Chemical, 2016
SAP Revenue, Revenue Structure, and Operating Costs of Zhejiang Satellite Petro-Chemical, 2014-2016
SAP Capacity of Zhejiang Satellite Petro-Chemical, 2013-2017E
Revenue and Net Income of Zhejiang Satellite Petro-Chemical, 2015-2020E
Revenue and Net Income of Yixing Danson Technology, 2012-2016E
SAP Capacity of Yixing Danson Technology, 2010-2020E
BASF-YPC’s Capacity by Product, 2015
BASF-YPC’s Revenue and Net Income, 2010-2015
SAP Capacity of Shandong Nuoer Bio-Tech, 2013-2016E
Revenue and Net Income of Shanghai Huayi Acrylic Acid, 2009-2015
SAP Capacity of Shandong ZhongkeBoyuan New Material Technology, 2013-2016
SAP Capacity of Tangshan Boya Resin, 2013-2015
Revenue and Net Income of Jinan Haoyue Absorbent Materials, 2013-2015
SAP Revenue Structure of Jinan Haoyue Absorbent Materials by Application, 2013-2015 Revenue and Net Income of Wanhua Chemical Group, 2011-2016
Operating Revenue Structure of Wanhua Chemical Group by Product, 2015
Operating Revenue Structure of Wanhua Chemical Group, 2011-2016
Gross Margin of Wanhua Chemical Group, 2011-2016
Capacity of Wanhua Chemical Group, 2015-2020E
Revenue and SAP Operation of Major Global and Chinese SAP Manufacturers, 2015-2016
Market Share of Major Global Manufacturers by SAP Capacity, 2015-2016
Major Ongoing/Proposed SAP Projects Worldwide, 2016
SAP Capacity, Output, and Demand in China, 2015-2020E
SAP Demand Structure in China by Application, 2014-2020E
Global and China Optical Fiber Preform Industry Report, 2021-2026
Optical fiber preforms play a key role in the optical fiber communication industry chain. The global construction of 4G and FTTH requires less optical fiber and cable, which has dragged down the deman...
Global and China Photoresist Industry Report, 2021-2026
Since its invention in 1959, photoresist has been the most crucial process material for the semiconductor industry. Photoresist was improved as a key material used in the manufacturing process of prin...
Global and China Needle Coke Industry Report, 2021-2026
Needle coke is an important carbon material, featuring a low thermal expansion coefficient, a low electrical resistivity, and strong thermal shock resistance and oxidation resistance. It is suitable f...
Global and China 3D Glass Industry Report, 2021-2026
3D curved glass is light and thin, transparent and clean, anti-fingerprint, anti-glare, hard and scratch-resistant, and performs well in weather resistance. It is applicable to terminals such as high-...
Global and China Graphene Industry Report, 2020-2026
Graphene, a kind of 2D carbon nanomaterial, features excellent properties such as mechanical property and super electrical conductivity and thermal conductivity. Its downstream application ranges from...
Global and China Optical Fiber Preform Industry Report, 2020-2026
Optical fiber preform as a hi-tech product and a crucial link in the optical fiber industry chain contributes to 70% or so of profit margin. Global 4G and FTTH construction at dusk leads to the shrink...
Global and China 3D Glass Industry Report, 2020-2026
Global 3D glass market has been enlarging over the recent years amid demetallization of smartphone back covers and popularity of smart wearables, to approximately $2.86 billion in 2019 and to an estim...
Global and China Photoresist Industry Report, 2020-2026
In 2019, global photoresist market was valued at $8.3 billion, growing at a compound annual rate of 5.1% or so since 2010, and it will outnumber $12.7 billion in 2026 with advances in electronic techn...
Global and China Synthetic Diamond Industry Report, 2020-2026
While its mechanical property is given full play in fields like grinding and cutting, diamond with acoustic, optical, magnetic, thermal and other special properties, as superconducting material, intel...
Global and China Needle Coke Industry Report, 2020-2026
With the merits like small resistivity, excellent resistance to impact and good anti-oxidation property, needle coke has been widely used in ultra-high power graphite electrodes, nuclear reactor decel...
Global and China Optical Fiber Preform Industry Report, 2019-2025
Optical fiber preform, playing an important role in the optical fiber and cable industry chain, seizes about 70% profits of optical fiber. Global demand for optical fiber preform stood at 16.2kt in 20...
China Silicon Carbide Industry Report, 2019-2025
Silicon carbide (SiC) is the most mature and the most widely used among third-generation wide band gap semiconductor materials. Over the past two years, global SiC market capacity, however, hovered ar...
Global and China Photoresist Industry Report, 2019-2025
Photoresist, a sort of material indispensable to PCB, flat panel display, optoelectronic devices, among others, keeps expanding in market size amid the robust demand from downstream sectors. In 2018, ...
Global and China Graphene Industry Report, 2019-2025
Graphene is featured with excellent performance and enjoys a rosy prospect. The global graphene market was worth more than $100 million in 2018, with an anticipated CAGR of virtually 45% between 2019 ...
Global and China 3D Glass Industry Chain Report, 2019-2025
The evolution of AMOLED conduces to the steady development of 3D curved glass market. In 2018, the global 3D glass market expanded 37.7% on an annualized basis and reached $1.9 billion, a figure proje...
China Wood Flooring Industry Report, 2019-2025
With the better standard of living and the people’s desire for an elegant life, wood flooring sees a rising share in the flooring industry of China, up from 33.9% in 2009 to 38.9% in 2018, just behind...
Global and China Photovoltaic Glass Industry Report, 2019-2025
In China, PV installed capacity has ramped up since the issuance of photovoltaic (PV) subsidy policies, reaching 53GW in 2017, or over 50% of global total. However, the domestic PV demand was hit by t...
Global and China ITO Targets Industry Chain Report, 2019-2025
Featured by good electrical conductivity and transparency, ITO targets are widely applied to fields of LCD, flat-panel display, plasma display, touch screen, electronic paper, OLED, solar cell, antist...