Global and China Optical Fiber Preform Industry Report, 2017-2021
-
Sep.2017
- Hard Copy
- USD
$2,900
-
- Pages:144
- Single User License
(PDF Unprintable)
- USD
$2,700
-
- Code:
CYH067
- Enterprise-wide License
(PDF Printable & Editable)
- USD
$4,100
-
- Hard Copy + Single User License
- USD
$3,100
-
Optical fiber preform, a core raw material of optical fiber products, accounts for around 70% of the profit of optical fiber. Global optical fiber preform output and demand were 14.9kt and 13.8kt in 2016, up 16.0% and 10.2% from a year ago, respectively, and are expected to reach 30.2kt and 25.6kt in 2021 separately, driven by rapid development of the optical fiber and cable market.
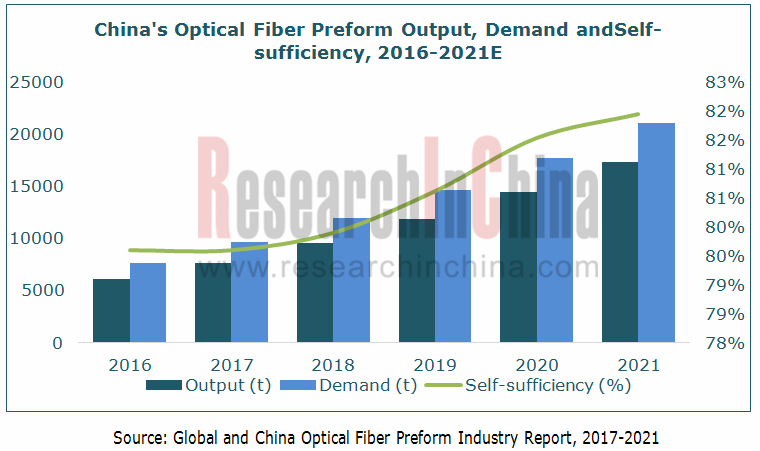
China, the world’s largest producer of and source of demand for optical fiber preform, produced 6.1kt and demanded 7.668kt in 2016, 41.0% and 55.4% of the world’s total, respectively, indicating a supply-demand gap of 1.568kt, still in a state of short supply. However, as Chinese enterprises improve optical fiber preform technology and put production lines into operation, the gap has narrowed gradually, from 68.4% in 2010 to only 20.4% in 2016 and estimated 18% or so in 2021.
There are about 20 major optical fiber preform producers worldwide in this highly-concentrated market, including Corning, Sumitomo Electric Industries, Shin-Etsu Chemical, Yangtze Optical Fibre and Cable, and Hengtong Optic-electric. Yangtze Optical Fibre and Cable ranks first by global market share (based on output), 13.4% in 2016, followed by Corning (about 12.9%).
The country’s efforts to promote “tri-networks integration”, “Broadband China”, “5G Construction” and “Internet Plus” have brought unprecedented opportunities for the Chinese optical fiber and cable market, driven rapid development of the optical fiber preform market, and stimulated Chinese optical fiber preform producers to expand capacity. Yangtze Optical Fibre and Cable began construction of YOFC Qianjiang Science Park in Mar 2016, put its Phase I into production in Mar 2017, and will build Phase II and Phase III. After reaching designed capacity, the project will deliver capacity of 1.5kt/a optical fiber preform and 20 million core?km /a. Meanwhile, the company also initiated PCVD11 capacity expansion project with the aim of lifting optical fiber preform capacity. Hengtong Optic-electric reorganized its optical fiber preform business and established a wholly-owned subsidiary- Hengtong Photoconductive New Materials in 2017, planning to add 1.5kt/a optical fiber preform.
In addition, the Ministry of Commerce of the People’s Republic of China announced in Aug 2017 that it decided to conduct a one-year expiry review investigation into the anti-dumping measures imposed on the imports of optical fiber perform originated in Japan and the United States, and during the expiry review investigation of the anti-dumping measures, the imports of optical fiber perform originated in Japan and the United States will still be subject to anti-dumping duties at the scope and rate released in the Ministry of Commerce Announcement No.25 of 2015. Affected by this, coupled with short supply of the product, optical fiber preform prices have risen since 2015, hitting RMB1,011/kg in 2016 and expected to go up further to an average of RMB1,100/kg in 2017.
Global and China Optical Fiber Preform Industry Report, 2017-2021 highlights the followings:
 Global optical fiber preform market (supply & demand, regional distribution, price, competitive landscape, development trends, etc.);
Chinese optical fiber preform market (policies, supply & demand, competitive landscape, prices, development trends, etc.);
Global and Chinese optical fiber and cable market;
13 global and Chinese optical fiber preform enterprises (operation, optical fiber preform business, etc.).
1 Overview of Optical Fiber Preform
1.1 Definition
1.2 Production Technology
1.3 Industry Chain
1.3.1 Upstream
1.3.2 Downstream
2 Global Optical Fiber Preform Industry
2.1 Status Quo
2.2 Supply & Demand
2.2.1 Supply
2.2.2 Demand
2.3 Regional Structure
2.3.1 USA
2.3.2 Japan
2.3.3 Europe
2.4 Price Trend
2.5 Competitive Landscape
3 Optical Fiber Preform Industry in China
3.1 Policy Environment
3.2 Development Course
3.3 Supply & Demand
3.3.1 Supply
3.3.2 Demand
3.4 Import & Export
3.4.1 Import
3.4.2 Export
3.5 Price Trend
3.5.1 Prices of Raw Materials
3.5.2 Prices of Optical Fiber Preform
3.6 Competitive Landscape
4 Global and Chinese Optical Fiber & Cable Market
4.1 Global
4.1.1 Market Development
4.1.2 Regional Structure
4.1.3 Price
4.1.4 Enterprise
4.2 China
4.2.1 Market Development
4.2.2 Price
4.2.3 Competitive Landscape
5 Major Global Optical Fiber Preform Producers
5.1 Corning
5.1.1 Profile
5.1.2 Operation
5.1.3 Optical Fiber Preform Business
5.1.4 Development in China
5.1.5 Corning Optical Fiber Cable Chengdu Co. Ltd.
5.2 Sumitomo Electric Industries
5.2.1 Profile
5.2.2 Operation
5.2.3 Optical Fiber Preform Business
5.2.4 Development in China
5.2.5 Chengdu SEI Optical Fiber
5.3 Shin-Etsu Chemical
5.3.1 Profile
5.3.2 Operation
5.3.3 Optical Fiber Preform Business
5.3.4 Development in China
5.4 Fujikura
5.4.1 Profile
5.4.2 Operation
5.4.3 Optical Fiber Preform Business
5.4.4 Development in China
5.4.5 Fujikura FiberHome Opto-Electronic Material Technology
5.5 Prysmian
5.5.1 Profile
5.5.2 Operation
5.5.3 Optical Fiber Preform Business
5.5.4 Development in China
5.6 Furukawa Electric
5.6.1 Profile
5.6.2 Operation
5.6.3 Optical Fiber Preform Business
5.6.4 Development in China
5.7 Twentsche Kabel Holding (TKH)
5.7.1 Profile
5.7.2 Operation
5.7.3 Optical Fiber Preform Business
5.7.4 Development in China
5.7.5 Twentsche (Nanjing) Fibre Optics
6 Major Chinese Optical Fiber Preform Companies
6.1 YOFC
6.1.1 Profile
6.1.2 Operation
6.1.3 Optical Fiber Preform Business
6.2 Hengtong Optic-electric
6.2.1 Profile
6.2.2 Operation
6.2.3 Optical Fiber Preform Business
6.3 Jiangsu Zhongtian Technology (ZTT)
6.3.1 Profile
6.3.2 Operation
6.3.3 Optical Fiber Preform Business
6.4 FiberHome Technologies
6.4.1 Profile
6.4.2 Operation
6.4.3 Optical Fiber Preform Business
6.5 Futong Group
6.5.1 Profile
6.5.2 Operation
6.5.3 Projects under Construction
6.5.4 Optical Fiber Preform Business
6.6 Potevio Fasten Optical Communication
6.6.1 Profile
6.6.2 Operation
6.6.3 Optical Fiber Preform Business
7 Summary and Forecast
7.1 Enterprise
7.2 Market
Optical Fiber Preform Core and Cladding Diagram
Optical Fiber Preform Core Manufacturing Processes
Global Optical Fiber Preform Core Structure by Process, 2017
Optical Fiber Preform Core Structure by Process in China
Optical Fiber Preform Industry Chain
Optical Fiber Preform Cost Structure in China
Downstream Sectors of Optical Fiber Preform
Global Optical Fiber Preform Capacity and Output, 2010-2021
Global Demand for Optical Fiber Preform, 2010-2021E
Global Optical Fiber Preform Capacity and Market Share by Country/Region, 2010-2017
Global Demand for Optical Fiber Preform by Country/Region, 2010-2017
Optical Fiber Preform Capacity, Output and Demand in the United States, 2010-2017
Optical Fiber Preform Exports in the United States, 2010-2016
Optical Fiber Preform Capacity, Output and Demand in Japan, 2010-2017
Optical Fiber Preform Exports in Japan, 2010-2016
Global Optical Fiber Preform Prices, 2000-2017
Policies on Optical Fiber Preform Industry in China, 2010-2017
China’s Anti-dumping Measures on Optical Fiber Preform, 2017
Development Course of Optical Fiber Preform in China
Optical Fiber Preform Output and YoY Growth in China, 2007-2017
Key Optical Fiber Preform Projects Planned and under Construction in China, 2017
Optical Fiber Preform Demand and YoY Growth in China, 2010-2017
Optical Fiber Preform Self-sufficiency in China, 2007-2017
Optical Fiber Preform Import Volume and YoY Growth in China, 2010-2017
Structure of China’s Optical Fiber Preform Import Volume by Country, 2013-2017
Optical Fiber Preform Import Value and YoY Growth in China, 2010-2017
Optical Fiber Preform Export Volume and YoY Growth in China, 2010-2017
Structure of China’s Optical Fiber Preform Export Volume by Country, 2013-2017
Optical Fiber Preform Export Value and YoY Growth in China, 2010-2017
Germanium Price Trend in China, 2010-2017
Average Price of Optical Fiber Preform in China, 2010-2017
Import and Export Prices of Optical Fiber Preform in China, 2010-2017
Shareholding Structure and Technologies Applied of Major Optical Fiber Preform Manufacturers in China
Optical Fiber Preform Capacity of Key Optical Fiber Preform Producers in China, 2013-2017
Optical Fiber Preform Output of Key Optical Fiber Preform Producers in China, 2013-2017
Structure and Production Processes of Optical Fiber and Cable
Optical Fiber Output in China and Worldwide, 2010-2016
Global Demand for Optical Fiber and Cable by Country/Region, 2005-2015
Optical Fiber Demand Structure in the World’s Major Regions, 2014-2016
Demand for Optical Fiber and Cable in the World’s Major Regions, 2020E
Demand for Optical Fiber and Cable in the World’s Major Three Regions, 2010-2018E
Global Submarine Optical Cable Revenue by Region, 2014-2022E
Demand for Optical Cable in the United States, 2008-2020E
U.S. Optical Cable Exports and YoY Growth
Optical Fiber and Cable Consumption in India, 2013-2016
Demand for Optical Fiber and Cable in France, 2013-2016
Price Trend of Optical Fiber Worldwide, 2014-2017
Global Top10 Most Competitive Optical Fiber and Cable Enterprises, 2016
Optical Fiber and Cable Demand and YoY Growth in China, 2011-2021E
Centralized Purchasing by Major Chinese Telecom Carriers, 2017
Completed Centralized Purchase Amount of Three Chinese Telecom Carriers, 2013-2017
Optical Fiber Price Trend in China, 2012-2018 (RMB/core?km)
Market Share of Optical Fiber Enterprises in China, 2016
Optical Fiber and Optical Cable Capacity of Top 6 Enterprises in China, 2016
Revenue and Net Income of Corning, 2009-2017
Revenue Structure of Corning (by Product), 2013-2017
Revenue Structure of Corning (by Country/Region), 2012-2016
R&D Costs and % of Total Revenue of Corning, 2009-2017
Revenue of Corning’s Telecom Business Segment by Product, 2011-2016
Corning’s Revenue in China and Percentage, 2009-2016
Revenue and Net Income of Sumitomo Electric, FY2008-FY2017
Revenue of Sumitomo Electric by Business, FY2008-FY2017
Sumitomo Electric’s Business Strategies, FY2017
Revenue of Sumitomo Electric by Region, FY2008-FY2016
R&D Costs and Patents of Sumitomo Electric, FY2012-FY2016
Sumitomo Electric’s Revenue from Information and Communications Business, FY2013-FY2017
Revenue, Operating Income, and R&D Costs of Sumitomo Electric’s Information and Communications Business, FY2013-FY2016
Sumitomo Electric’s Revenue in China, FY2011-FY2016
Revenue of Chengdu SEI Optical Fiber Co., Ltd., 2009-2017
Products of Shin-Etsu Chemical by Division, 2017
Shin-Etsu Chemical’s Plants by Business Division/by Region, 2017
Revenue and Net Income of Shin-Etsu Chemical, FY2011-FY2017
Revenue Structure of Shin-Etsu Chemical by Business, FY2014-FY2017
Revenue Structure of Shin-Etsu Chemical by Region, FY2013-FY2017
Revenue and Operating Income of Shin-Etsu Chemical’s Electronic and Functional Materials Division, FY2010-FY2017
Investment of Shin-Etsu Chemical’s Electronic and Functional Materials Division, FY2016-FY2017
Shin-Etsu Chemical’s Revenue in China and Percentage, FY2012-FY2017
Overview of New Optical Fiber Preform Joint Ventures in China
Global Presence of Fujikura by the End of Mar 2017
Revenue and Net Income of Fujikura, FY2009-FY2017
Business Indicators of Fujikura, FY2017Q1
Revenue Structure of Fujikura by Business, FY2013-FY2017
Fujikura’s Operations, FY2017
Revenue Structure of Fujikura by Region, FY2011-FY2016
Fujikura’s R&D Costs by Business, FY2012-FY2016
Fujikura’s Power & Telecommunications Revenue by Business, FY2014-FY2017
Fujikura’s Revenue in China, FY2011-FY2016
Revenue and Net Income of Fujikura FiberHome Opto-Electronic Material Technology, 2011-2016
Equity Structure of Prysmian, 2017
Global Presence of Prysmian
Business Operations of Prysmian
Development Course of Prysmian by Aug 2017
Revenue and Net Income of Prysmian, 2007-2016
Business Performance of Prysmian, 2017H1
Global R&D Centers of Prysmian by the End of 2016
Revenue Structure of Prysmian by Business, 2016
Revenue Structure of Prysmian by Region, 2016
Performance of Prysmian’s Telecommunications Business, 2014-2016
Performance of Prysmian’s Telecommunications Business, 2017H1
Telecommunications Business Revenue of Prysmian by Business, 2016
Telecommunications Business Revenue of Prysmian by Region, 2016
Telecommunications Business Structure and Key Clients of Prysmian
Prysmian’s Subsidiaries in China by the End of 2015
Prysmian’s Presence in China
Global Presence of Furukawa Electric
Business Planning of Furukawa Electric, 2020E
Furukawa Electric’s Planning for Global Presence, 2020E
Net Revenue and Operating Income of Furukawa Electric, FY2010-FY2017
Business Performance of Furukawa Electric, FY2017Q1
Revenue of Furukawa Electric by Business, FY2016-FY2017
Revenue and Operating Income of Furukawa Electric’s Communications Solutions, FY2010-FY2016
Business Performance of Furukawa Electric’s Communications Solutions, FY2015-FY2017
Furukawa Electric’s Communications Solutions and Related Subsidiaries
Revenue Structure of Furukawa Electric’s Communications Solutions by Product, FY2012-FY2015
Application of Optical Fiber and Optical Cable Products of Furukawa Electric
Optical Fiber Development Trends of Furukawa Electric
Optical Cable Development Trends of Furukawa Electric
Furukawa Electric’s Global Strategy for Communications Solutions, 2017
Main Optical Fiber Production Bases and Projects under Construction of Furukawa Electric, 2016
Main Optical Cable Production Bases and Projects under Construction of Furukawa Electric, 2016
Global Presence of TKH
Revenue and Net Income of TKH, 2009-2016
Business Performance of TKH, 2017H1
Major Acquisitions of TKH, 2017
Revenue Structure of TKH by Business, 2012-2017
Revenue Structure of TKH by Region, 2012-2017
Revenue and Business Model of TKH’s Telecom Division by Business, 2015-2017H1
TKH’s Subsidiaries in China by the End of 2016
Business Structure of YOFC
Revenue and Net Income of YOFC, 2007-2017
Revenue Structure of YOFC by Product, 2011-2017
Output, Sales and Sales/Output Ratio of YOFC by Product, 2014-2016
Operating Revenue of YOFC by Region, 2011-2017
Gross Margin (by Product) of YOFC, 2011-2017
Optical Fiber Preform Output and Growth Rate of YOFC, 2006-2016
Key Suppliers of Raw Materials for YOFC
Global Marketing Network of Hengtong Optic-Electric
Revenue and Net Income of Hengtong Optic-Electric, 2008-2017
Output, Sales Volume and Sales-Output Ratio of Hengtong Optic-Electric by Product, 2012-2016
Operating Revenue Structure of Hengtong Optic-Electric by Product, 2016
Gross Margin of Hengtong Optic-Electric’s Optical Communications Products, 2011-2016
Revenue of Hengtong Optic-Electric by Region, 2009-2016
Overseas Operations of Hengtong Optic-Electric, 2017
R&D Costs and % of Total Revenue of Hengtong Optic-Electric, 2009-2017
Optical Fiber Preform Capacity of Hengtong Optic-Electric, 2010-2016
Optical Fiber Preform Output and Sales of Hengtong Optic-Electric, 2010-2016
Optical Fiber Preform Procurement and Self-Supply Quantity of Hengtong Optic-Electric, 2013-2016
Optical Fiber Preform Capacity Expansion History of Hengtong Optic-Electric, 2010-2017
Evolution of ZTT’s Primary Business
Revenue and Net Income of ZTT, 2009-2017
Operating Revenue and Gross Margin of ZTT by Business, 2016
Revenue of ZTT by Region, 2008-2016
R&D Costs and % of Total Revenue of ZTT, 2009-2017
Optical Fiber Preform Output of ZTT, 2010-2016
Milestones of FiberHome Technologies
Business and Subsidiaries of FiberHome Technologies
Revenue and Net Income of FiberHome Technologies, 2008-2017
Revenue of FiberHome Technologies by Product, 2008-2016
Revenue Structure of FiberHome Technologies by Business, 2016
Revenue of FiberHome Technologies by Region, 2008-2016
Gross Margin of FiberHome Technologies by Product, 2008-2016
R&D Costs and % of Total Revenue of FiberHome Technologies, 2011-2017
Net Income of Major Optical Fiber Preform Manufacturing Companies of FiberHome Technologies, 2015-2016
Optical Fiber Preform Output of FiberHome Technologies, 2010-2016
Equity Structure of Futong Group, 2017
Futong Group’s Production Bases
Revenue and Net Income of Futong Group, 2009-2017
Global Marketing Network of Futong Group
Revenue of Futong Group by Business, 2010-2017
Gross Margin of Futong Group by Business, 2009-2017
Revenue, Gross Profit and Gross Margin of Futong Group, 2014-2017
Capacity and Output of Futong Group’s Optical Communications Business by Product, 2014-2017
Sales and Selling Prices of Futong Group’s Optical Communications Business by Product, 2014-2017
Key Projects under Construction of Futong Group, 2017
Optical Fiber Preform Production Bases of Futong Group
Optical Fiber Preform Capacity and Output of Futong Group, 2009-2017
Average Prices of Optical Fiber Preform of Futong Group, 2011-2017
Futong Group’s Procurement of Raw Materials for Optical Fiber Preform from Top 5 Suppliers and % of Total Procurement, 2013-2017
Equity Structure of Potevio Fasten Optical Communication, 2017
Revenue and Net Income of Potevio Fasten Optical Communication, 2013-2016
Optical Fiber Preform Capacity and Output of Potevio Fasten Optical Communication, 2006-2016
Competitive Landscape of Global Optical Fiber Preform Market, 2016-2017
Operation of Key Optical Fiber Preform Producers in China, 2016
Optical Fiber Preform Output and Demand in China, 2017-2021E
Global and China Optical Fiber Preform Industry Report, 2021-2026
Optical fiber preforms play a key role in the optical fiber communication industry chain. The global construction of 4G and FTTH requires less optical fiber and cable, which has dragged down the deman...
Global and China Photoresist Industry Report, 2021-2026
Since its invention in 1959, photoresist has been the most crucial process material for the semiconductor industry. Photoresist was improved as a key material used in the manufacturing process of prin...
Global and China Needle Coke Industry Report, 2021-2026
Needle coke is an important carbon material, featuring a low thermal expansion coefficient, a low electrical resistivity, and strong thermal shock resistance and oxidation resistance. It is suitable f...
Global and China 3D Glass Industry Report, 2021-2026
3D curved glass is light and thin, transparent and clean, anti-fingerprint, anti-glare, hard and scratch-resistant, and performs well in weather resistance. It is applicable to terminals such as high-...
Global and China Graphene Industry Report, 2020-2026
Graphene, a kind of 2D carbon nanomaterial, features excellent properties such as mechanical property and super electrical conductivity and thermal conductivity. Its downstream application ranges from...
Global and China Optical Fiber Preform Industry Report, 2020-2026
Optical fiber preform as a hi-tech product and a crucial link in the optical fiber industry chain contributes to 70% or so of profit margin. Global 4G and FTTH construction at dusk leads to the shrink...
Global and China 3D Glass Industry Report, 2020-2026
Global 3D glass market has been enlarging over the recent years amid demetallization of smartphone back covers and popularity of smart wearables, to approximately $2.86 billion in 2019 and to an estim...
Global and China Photoresist Industry Report, 2020-2026
In 2019, global photoresist market was valued at $8.3 billion, growing at a compound annual rate of 5.1% or so since 2010, and it will outnumber $12.7 billion in 2026 with advances in electronic techn...
Global and China Synthetic Diamond Industry Report, 2020-2026
While its mechanical property is given full play in fields like grinding and cutting, diamond with acoustic, optical, magnetic, thermal and other special properties, as superconducting material, intel...
Global and China Needle Coke Industry Report, 2020-2026
With the merits like small resistivity, excellent resistance to impact and good anti-oxidation property, needle coke has been widely used in ultra-high power graphite electrodes, nuclear reactor decel...
Global and China Optical Fiber Preform Industry Report, 2019-2025
Optical fiber preform, playing an important role in the optical fiber and cable industry chain, seizes about 70% profits of optical fiber. Global demand for optical fiber preform stood at 16.2kt in 20...
China Silicon Carbide Industry Report, 2019-2025
Silicon carbide (SiC) is the most mature and the most widely used among third-generation wide band gap semiconductor materials. Over the past two years, global SiC market capacity, however, hovered ar...
Global and China Photoresist Industry Report, 2019-2025
Photoresist, a sort of material indispensable to PCB, flat panel display, optoelectronic devices, among others, keeps expanding in market size amid the robust demand from downstream sectors. In 2018, ...
Global and China Graphene Industry Report, 2019-2025
Graphene is featured with excellent performance and enjoys a rosy prospect. The global graphene market was worth more than $100 million in 2018, with an anticipated CAGR of virtually 45% between 2019 ...
Global and China 3D Glass Industry Chain Report, 2019-2025
The evolution of AMOLED conduces to the steady development of 3D curved glass market. In 2018, the global 3D glass market expanded 37.7% on an annualized basis and reached $1.9 billion, a figure proje...
China Wood Flooring Industry Report, 2019-2025
With the better standard of living and the people’s desire for an elegant life, wood flooring sees a rising share in the flooring industry of China, up from 33.9% in 2009 to 38.9% in 2018, just behind...
Global and China Photovoltaic Glass Industry Report, 2019-2025
In China, PV installed capacity has ramped up since the issuance of photovoltaic (PV) subsidy policies, reaching 53GW in 2017, or over 50% of global total. However, the domestic PV demand was hit by t...
Global and China ITO Targets Industry Chain Report, 2019-2025
Featured by good electrical conductivity and transparency, ITO targets are widely applied to fields of LCD, flat-panel display, plasma display, touch screen, electronic paper, OLED, solar cell, antist...