Global and China Refractories Industry Report, 2018-2022
-
Jun.2018
- Hard Copy
- USD
$3,600
-
- Pages:3200
- Single User License
(PDF Unprintable)
- USD
$3,400
-
- Code:
BXM111
- Enterprise-wide License
(PDF Printable & Editable)
- USD
$5,000
-
- Hard Copy + Single User License
- USD
$3,800
-
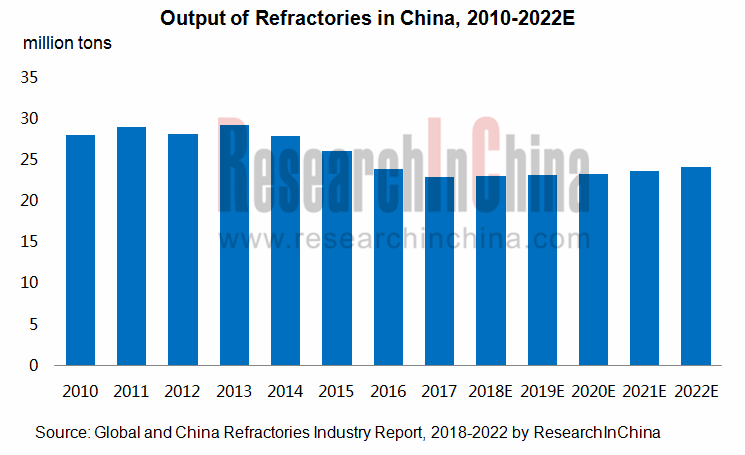
As the supply-side reform is carried out over the recent years, the demand for refractories used for infrastructure projects has dived and the output of refractories keeps falling. In 2017, China produced 22.9254 million tons of refractories, a year-on-year decrease of 4.13% (a drop of 4.13 percentage points on an annualized basis). The fall in output is because refractories for infrastructure construction was less needed since furnaces of some enterprises with substandard environmental work were forced to stop production whilst environmental protection campaign is being staged across China. The narrowed decline benefited from the recovery of downstream sectors like steel and building materials. It is expected that, in the next five years, the refractory market will witness moderate growth and the output of refractories will outnumber 24 million tons in 2022 in the wake of backward capacity being eliminated and the optimized structure of refractory industry.
As China tightens control on mineral resources and environmental pollution, the exploitation of raw materials such as magnesite was restricted in 2017 and the prices of magnesium refractory raw materials hiked. Thereupon, some suppliers of refractory raw materials and the refractory enterprises yielding proceeds from raw materials saw remarkable growth in profits, while refractory product enterprises are confronted with the amounting cost pressure and reap meager profits. Allured by the lucrative business, some enterprises in places like Liaoning province lifted their investments into high-purity magnesia projects in 2017.
In 2017, China’s export value of refractory raw materials and products surpassed USD3.0 billion and reached USD3.076 billion, soaring by 19.90% from a year earlier. Yet, the average price of refractory product exports surged by 11.85% year on year, putting an end to the downward mobility for two successive years; and the average export price of refractory raw materials started to fall from 2012 and dropped by 11.64% year on year in 2017.
The world-renowned giants in refractory business are represented by RHI Magnesita, Vesuvius, Imerys, Krosaki-Harima and Shinagawa, among which RHI Magnesita is grown from the merger of RHI and Magesita in 2017 and currently the largest producer of refractories around the globe, with its sales reporting EUR1.946 billion. Thus far, those companies without exception have operations in China. In 2017, RHI Magnesita garnered the revenue of EUR121 million in China, and it has already restarted its Chizhou-based company’s refractory material and mine production project in 2018.
There are more than 2,000 refractory manufacturers each with annual revenue of RMB20 million in China, and the Chinese market is in perfect competition due to low entry barrier and in consequence with low concentration. The top 10 refractory enterprises’ combined revenue occupied less than 20% of the total and the top 20 ones’ swept 25% or so in 2017, according to the data of the Association of China Refractories Industry. In the future, three to five large Chinese refractory groups with international competitiveness will emerge through mergers and acquisitions, integration of industrial chains, etc.
The report highlights the followings:
 Demand and supply of refractories in global market and development in major countries;
Policy climate, trade policy and industrial environment for refractories in China;
Demand and supply and import & export of refractories in Chinese market, competition among enterprises, the development of refractories in key provinces, etc.;
Markets of refractory raw materials (magnesite, bauxite, graphite, silicon carbide);
Current development and major manufacturers of basic refractories, unshaped refractories, ceramic fiber, etc.;
Demand for refractories from downstream sectors like steel, cement and glass;
12 global and 20 Chinese refractory enterprises (operation, refractory business, etc.).
1. Overview of Refractories
1.1 Definition & Classification
1.1.1 Definition
1.1.2 Classification
1.2 Industry Chain
2. Development of Refractories Worldwide
2.1Market Supply and Demand
2.1.1 Production
2.1.2 Demand
2.2 Major Countries/Regions
2.2.1 Europe
2.2.2 United States
2.2.3 Japan
2.3.4 India
2.3.5 Australia
2.3.6 Brazil
2.3.7 Russia
2.3 Key Companies
3 Environments for Refractory Development in China
3.1 Policy Climate
3.2 Trade Environment
3.2.1 Export Quota and Tariff Rate
3.2.2 The US’ Anti-dumping Investigation on China-made Magnesia Carbon Bricks
3.3 Operation of Refractory Industry
4 Current Development of Refractories in China
4.1 Overview
4.2 Output & Structure
4.2.1 Output
4.2.2 by Product
4.2.3 by Region
4.3 Demand & Structure
4.3.1 Demand
4.3.2 By Application
4.3.3 By Product
4.4 Import & Export
4.4.1 Export
4.4.2 Import
4.5 Major Enterprises
4.5.1 Chinese Companies
4.5.2 Foreign Companies
4.6 Key Provinces
4.6.1 Henan
4.6.2 Liaoning
4.6.3 Shandong
5 Development of Main Refractory Raw Materials in China
5.1 Magnesite
5.1.1 Distribution of Resources
5.1.2 Magnesia
5.2 Bauxite
5.2.1 Distribution of Resources
5.2.2 Refractory Aluminum Clay
5.2.3 Brown Corundum and White Corundum
5.3 Graphite
5.3.1 Distribution of Resources and Market Demand and Supply
5.3.2 Magnesia Carbon Brick
5.4 Silicon Carbide
6 Development of Main Refractories in China
6.1 Basic Refractory
6.1.1 Development
6.1.2 Chrome-free Basic Refractory
6.1.3 Competitive Landscape
6.2 Unshaped Refractory
6.2.1 Development
6.2.2 Competition among Enterprises
6.3 Ceramic Fiber
6.3.1 Development
6.3.2 Key Companies
6.3.3 Development Prospects
7 Applied Markets of Refractories in China
7.1 Overview
7.2 Steel
7.2.1 Steel Market
7.2.2 Refractory for Steel
7.3 Glass
7.3.1 Glass Market
7.3.2 Refractory for Glass
7.4 Cement
7.4.1 Cement Market
7.4.2 Refractory for Cement
8 World-renowned Refractory Companies
8.1 RHI Magnesita
8.1.1 Profile
8.1.2 Operation
8.1.3 Progress in the Merger of RHI with Magnesita
8.1.4 Development in China
8.2 Vesuvius
8.2.1 Profile
8.2.2 Operation
8.2.3 Refractory Business
8.2.4 Development in China
8.3 Imerys
8.3.1 Profile
8.3.2 Operation
8.3.3 Refractory Business
8.3.4 Development in China
8.4 Krosaki Harima
8.4.1 Profile
8.4.2 Operation
8.4.3 Development in China
8.5 Shinagawa Refractories
8.5.1 Profile
8.5.2 Operation
8.5.3 Development in China
8.6 Magnezit
8.6.1 Profile
8.6.2 Operation
8.6.3 Development in China
8.7 Harbison Walker International (previously known as ANH Refractories)
8.7.1 Profile
8.7.2 Operation
8.7.3 Development in China
8.8 Morgan Advanced Materials (previously known as Morgan Crucible)
8.8.1 Profile
8.8.2 Operation
8.8.3 Development in China
8.9 Refratechnik
8.9.1 Profile
8.9.2 Operation
8.9.3 Development in China
8.10 Chosun Refractories)
8.10.1 Profile
8.10.2 Operation
8.10.3 Development in China
8.11 Minteq
8.11.1 Profile
8.11.2 Operation
8.11.3 Development in China
8.12 Saint-Gobain
8.12.1 Profile
8.12.2 Operation
8.12.3 Development in China
9 Key Enterprises in China
9.1 Puyang Refractories Group Co., Ltd.
9.1.1 Profile
9.1.2 Operation
9.1.3 Revenue Structure
9.1.4 Gross Margin
9.1.5 Customers and Suppliers
9.1.6 Development Strategy
9.2 Luyang Energy-Saving Materials Co., Ltd.
9.2.1 Profile
9.2.2 Operation
9.2.3 Revenue Structure
9.2.4 Gross Margin
9.2.5 Development Strategy
9.3 Ruitai Materials Technology Co., Ltd.
9.3.1 Profile
9.3.2 Operation
9.3.3 Revenue Structure
9.3.4 Gross Margin
9.3.5 Operation of Subsidiaries
9.3.6 Development Strategy
9.4 Beijing Lier High-temperature Materials Co., Ltd.
9.4.1 Profile
9.4.2 Operation
9.4.3 Revenue Structure
9.4.4 Gross Margin
9.4.5 Development Strategy
9.5 Henan Rongjin High Temperature Materials Co., Ltd.
9.5.1 Profile
9.5.2 Operation
9.5.3 Revenue Structure
9.5.4 Major Customers
9.6 Liaoning Zhongmei Co., Ltd.
9.6.1 Profile
9.6.2 Operation
9.6.3 Major Customers and Suppliers
9.7 Zhejiang Zili Corporation Limited.
9.7.1 Profile
9.7.2 Operation
9.7.3 Zhejiang Zili Advanced Materials Co., Ltd.
9.8 Yingkou Qinghua Group Co., Ltd.
9.8.1 Profile
9.8.2 Operation
9.9 Wugang Refractory Co., Ltd.
9.9.1 Profile
9.9.2 Operation
9.9.3 Development Strategy
9.10 Yingkou Jinlong Refractories Group Co., Ltd.
9.10.1 Profile
9.10.2 Operation
9.11 Shandong Refractories Group Co., Ltd.
9.11.1 Profile
9.11.2 Operation
9.11.3 Main Subsidiaries
9.12 Tongda Refractory Technologies, Co. Ltd.
9.12.1 Profile
9.12.2 Operation
9.13 Sinosteel Refractory Co., Ltd.
9.13.1 Profile
9.13.2 Operation
9.14 Jiangsu Sujia Group Co., Ltd.
9.14.1 Profile
9.14.2 Operation
9.15 Haicheng Houying Trade Group Co., Ltd.
9.15.1 Profile
9.15.2 Operation
9.15.3 Key Projects
9.16 Others
9.16.1 Shanxi Xixiaoping Refractories Co., Ltd.
9.16.2 Zhengzhou Zhendong Technology Co., Ltd.
9.16.3 Shandong Luqiao New Materials Co., Ltd.
9.16.4 Sinosteel Luoyang Institute of Refractories Research Co., Ltd.
9.16.5 Haicheng Magnesite Refractory General Factory
10 Summary and Forecast
10.1 Market
10.2 Enterprises
Classification of Refractories
Refractory Industry Chain
Refractory Consumption Structure by Sector
Global Refractory Output, 2011-2022E
Global Refractory Output Structure by Country/Region, 2017
Global Demand for Refractories, 2009-2022E
Production Structure of Refractories in Europe, 2013-2017
Output of Refractories in Japan, 2013-2017
Shipment of Refractories in Japan, 2013-2017
Output of Refractories in Russia, 2010-2016
Ranking of Major Refractory Suppliers Worldwide, 2017
Policies on Refractories in China, 2012-2018
Total Export Quota of Main Refractory Raw Materials in China, 2012-2018
China’s Magnesia Export Tariffs, 2017
Tentative Most-Favored-Nation Tariff Rate for Main Refractory Raw Materials, 2018
China’s Average Export Price of Main Refractory Raw Materials, 2016-2017
China’s Average Export Price of Refractory Products, 2011-2017
Main Economic Indicators of Key Refractory Companies in China, 2014-2017
List of Refractory Companies (1st Batch) with Production Lines Subject to Specifications for Refractories Industry
Output and YoY Growth of Refractories in China, 2010-2022E
Output of Refractories by Product in China, 2010-2017
Output of Refractories and % of Total Output by Province/Municipality in China, 2017
Demand for Refractories in China, 2013-2022E
Demand for Refractories by Sector in China, 2017
China’s Export Volume and Export Value of Refractories, 2011-2018
China’s Exports of Refractories by Product, 2009-2018
China’s Import Volume and Import Value of Refractories, 2011-2018
China’s Imports of Refractories by Product, 2011-2018
Revenue Structure of TOP10 Refractory Material Companies in China, 2016-2017
Presence of Major Global Refractory Companies in China, as of 2017
Output of Refractories in Henan Province, 2012-2017
Major Refractory Companies in Liaoning Province
Output of Refractories in Liaoning Province, 2012-2017
Newly-constructed High-purity Magnesia Projects in Liaoning Province, 2017
Output of Refractories in Shandong Province, 2012-2017
Classification of Refractory Raw Materials
Distribution of Magnesite Reserves Worldwide (kt), 2017
Distribution Chart of Magnesite Resources in China
Output of Magnesite in Major Countries, 2016-2017
Price Trend of Fused Magnesia in China, 2017
Price Trend of Sintered Magnesia in China, 2017
China’s Magnesia Output by Product, 2007-2017
China’s Magnesia Exports by Product, 2007-2018
Distribution of Bauxite Reserves Worldwide (kt), 2017
Output of Bauxite in Major Countries (kt), 2016-2017
Distribution of Bauxite in China
China’s Bauxite Imports, 2007-2017
China’s Bauxite Imports by Source Country, 2017
China’s Refractory Aluminum Clay Exports, 2009-2018
Price Trend of Bauxite Chamotte in China, 2017
China’s Output of Brown Corundum and White Corundum, 2012-2017
China’s Exports of Brown Corundum and White Corundum, 2013-2018
Price Trend of Brown Corundum and White Corundum in China, 2017
Natural Graphite Output and Reserve Distribution Worldwide (kt), 2017
China’s Natural Flake Graphite Exports, 2009-2018
Performance and Characteristics of Magnesia Carbon Bricks for Different Parts of Some Steel Plant’s Converter
China’s Silicon Carbide Output, 2014-2017
China’s Silicon Carbide Factory Price Including Tax, 2016-2017
China’s Export Volume and Value of Silicon Carbide, 2013-2017
Main Basic Refractory Raw Materials and Refractory Products
Typical Applications of Basic Refractory
Applications of Chromium-free Basic Refractory Bricks in Developed Countries
Alternative Product/Technology Roadmaps for and Representative Producers of Chromium-free Basic Refractory Bricks
Comparison between Unshaped Refractory and Shaped Refractory
Proportion of Unshaped Refractory in Major Countries/Regions, 2017
Unshaped Refractory Output Structure in China, 2010-2022E
Major Unshaped Refractory Producers in China and Their Capacity, 2017
Applications and % of Ceramic Fiber in China
China’s Ceramic Fiber Output, 2010-2022E
Subsidiaries of the World's Leading Ceramic Fiber Producers in China, as of 2017
Key Ceramic Fiber Enterprises in China and Their Capacity, 2017
Substitution Advantages of Ceramic Fiber
Consumption Sectors and Unit Consumption of Refractories
Output of Main Refractory Material Downstream Industries in China, 2014-2017
Global Crude Steel Output, 2010-2022E
TOP10 Crude Steel Countries by Output, 2017
TOP50 Crude Steel Companies by Output, 2017
Output and YoY Growth of Crude Steel in China, 2010-2022E
Electric Furnace Steel Output Structure in China, 2013-2022E
TOP10 Crude Steel Companies by Output in China, 2017
Refractories for Steel
Refractory Consumption per Ton of Steel in China, 2013-2022E
Major Steel-use Refractory Companies in China and Their Clients, 2017
New Demand for Refractories from Steel Industry, 2016-2020
China’s Plate Glass Output, 2012-2022E
TOP8 Glass Companies by Output/Sales in China, 2017
Distribution Chart of Refractories for Glass Melting Furnaces
Structure of Refractories Applied in Glass Melting Furnaces
Consumption of Fused Cast Aluminum Oxide for Various Glass Furnaces
Key Companies of Fused Cast Refractories in China and Their Leading Products
China’s Cement Output, 2012-2022E
Ranking of Top50 Cement Clinker Companies in China by Capacity, 2018
List of Refractories for Different Parts of Cement Kilns
RHI Magnesita’s Operating Results, 2016-2017
RHI Magnesita’s Revenue by Sector, 2017
RHI Magnesita’s Revenue by Product, 2016-2017
RHI Magnesita’s Revenue by Region, 2016-2017
Magnesita’s Operating Results, 2016
RHI Magnesita’s Major Companies in China, as of 2017
RHI Magnesita’s Sales in China, 2010-2017
Vesuvius’ Revenue and Profits, 2010-2017
Vesuvius’ Revenue and Profits by Business, 2010-2017
Vesuvius’ Global Presence, as of 2017
Vesuvius’ Revenue by Region, 2016-2017
Vesuvius’ Refractory Products
Vesuvius’ Revenue from Refractories, 2011-2017
Vesuvius’ Revenue from Refractories by Region and YoY Growth, 2013-2017
Vesuvius’ Refractory Companies in China
Imerys’ Global Operations
Imerys’ Major Events, 2010-2017
Revenue and Net Income of Imerys, 2011-2018
Revenue of Imerys (by Business), 2012-2018
Imerys’ Revenue from Four Major Businesses (by Product), 2015-2017
Revenue of Imerys (by Region), 2012-2018
Imerys’ Monolithic Refractories (Calderys) Products and Application
Imerys’ Monolithic Refractories (Calderys) Production Bases and Competitors
Calderys’ Milestones in Development, 2005-2017
Imerys’ Subsidiaries in China
Imerys’ Revenue Structure by Region, 2017
Krosaki’s Development Course
Revenue and Net Income of Krosaki, FY2009-FY2017
Revenue (by Business) of Krosaki, FY2012-FY2017
Applications and Percentage of Krosaki’s Refractories, FY2017
Revenue (by Region) of Krosaki, FY2012-FY2017
Krosaki’s Main Plants in China and Their Businesses
Shinagawa’s Development Course
Shinagawa’s Main Products
Selected Economic Indicators of Shinagawa, FY2012-FY2017
Revenue (by Business) of Shinagawa, FY2012-FY2017
Revenue (by Customer) of Shinagawa, FY2016
Shinagawa’s Global Operations
Shinagawa’s Overseas Sales, FY2009-FY2017
Presence of Shinagawa’s Companies in China
Magnezit’s Main Products and Services
Magnezit’s Global Operations
Magnezit’s Main Clients
Harbison Walker International’s Main Products
Harbison Walker International’s Main Plants and Their Products
Morgan Advanced Materials’ Main Products
Revenue and Profits of Morgan Advanced Materials, 2009-2017
Revenue of Morgan Advanced Materials (by Country/Region), 2016-2017
Revenue and Profit Margin of Morgan Advanced Materials (by Business), FY2015-FY2017
Revenue of Morgan Advanced Materials (by Applied Sector), FY2017
Key Companies of Morgan Advanced Materials in China
Refratechnik’s Main Business
Refratechnik’s Global Network
Refratechnik’s Plants in China
Chosun’s Main Products
Distribution of Chosun’s Key Bases Worldwide
Chosun’s Main Financial Indicators, 2010-2015
Production Bases of Chosun in China
Minteq’s Main Refractory Products
Revenue (by Business) of Minerals Technologies Inc., 2017
Main Subsidiaries of Minteq
Minteq’s Revenue from Refractory Business, 2012-2017
Revenue and Operating Income of Saint-Gobain, 2013-2018
Key Operations of Saint-Gobain
Application of Saint-Gobain’s Refractories and Competitors
Revenue of Saint-Gobain (by Business), 2013-2018
Revenue of Saint-Gobain (by Region), 2013-2018
Business Turnover of Saint-Gobain in China, 2008-2017
Saint-Gobain’s Refractory Companies in China
Revenue and Net Income of Puyang Refractories Group, 2009-2018
Puyang Refractories Group’s Output and Sales by Product, 2016-2017
Operating Revenue and YoY Growth (by Product) of Puyang Refractories Group, 2012-2017
Operating Revenue (by Region) of Puyang Refractories Group, 2009-2017
Puyang Refractories Group’s Operating Revenue Structure by Application Sector, 2016-2017
Puyang Refractories Group’s Operating Revenue Structure by Sales Model, 2014-2017
Gross Margin of Refractories of Puyang Refractories Group, 2009-2017
Gross Margin of Main Products of Puyang Refractories Group, 2012-2017
Puyang Refractories Group’s Revenue from TOP5 Clients and % of Total Revenue, 2016-2017
Puyang Refractories Group’s Procurement from TOP5 Suppliers and % of Total Procurement, 2016-2017
Puyang Refractories Group’s Mergers and Acquisitions, 2009-2017
Revenue and Net Income of Luyang Energy-saving Materials, 2009-2018
Operating Revenue (by Product) of Luyang Energy-saving Materials, 2010-2017
Operating Revenue (by Region) of Luyang Energy-saving Materials, 2010-2017
Consolidated Gross Margin of Luyang Energy-saving Materials, 2009-2018
Gross Margin (by Product) of Luyang Energy-saving Materials, 2009-2017
Business Development of Ruitai Materials Technology, 2008-2017
Revenue and Net Income of Ruitai Materials Technology, 2009-2018
Output and Sales Volume of Ruitai Materials Technology, 2011-2017
Operating Revenue (by Product) of Ruitai Materials Technology, 2011-2017
Operating Revenue (by Region) of Ruitai Materials Technology, 2009-2017
Gross Margin of Refractories of Ruitai Materials Technology, 2008-2017
Gross Margin (by Product) of Ruitai Materials Technology, 2011-2017
Revenue and Net Income of Ruitai Materials Technology’s Main Subsidiaries, 2017
Energy-saving and Environment-friendly High-temperature Material Intelligent Manufacturing Base Project and High-temperature Material Innovation Center Project of Ruitai Materials Technology
Business Development of Beijing Lier High-temperature Materials, 2011-2017
Revenue and Net Income of Beijing Lier High-temperature Materials, 2009-2018
Capacity and Capacity Utilization of Beijing Lier High-temperature Materials’ Refractory Materials by Product, 2016-2017
Output and Sales of Beijing Lier High-temperature Materials’ Refractory Materials by Product, 2016-2017
Operating Revenue (by Product) of Beijing Lier High-temperature Materials, 2012-2017
Operating Revenue (by Region) of Beijing Lier High-temperature Materials, 2010-2017
Gross Margin of Refractories of Beijing Lier High-temperature Materials, 2009-2017
Gross Margin (by Product) of Beijing Lier High-temperature Materials, 2012-2017
Main Products of Henan Rongjin High Temperature Materials
Revenue, Net Income and Gross Margin of Henan Rongjin High Temperature Materials, 2012-2017
Operating Revenue (by Product) of Henan Rongjin High Temperature Materials, 2013-2017
Henan Rongjin High Temperature Materials’ Revenue from TOP5 Clients and % of Total Revenue, 2017
Revenue and Net Income of Liaoning Zhongmei, 2014-2017
Liaoning Zhongmei’s Operating Revenue Structure by Business, 2016-2017
Liaoning Zhongmei’s Top 5 Clients and Top 5 Suppliers, 2017
Revenue and Net Income of Zhejiang Zili Advanced Materials, 2014-2017
Zhejiang Zili Advanced Materials’ Operating Revenue Structure by Business, 2016-2017
Main Products and Application of Yingkou Qinghua Group
Refractory Output of Yingkou Qinghua Refractories, 2012-2017
Refractory Output of Wugang Refractory, 2012-2017
Yingkou Jinlong Refractories Group’s Capacity by Product, 2017
Yingkou Jinlong Refractories Group’s Refractory Subsidiaries and Their Capacity of Main Products, 2017
Refractory Output of Yingkou Jinlong Refractories Group, 2013-2017
Development Course of Shandong Refractories Group
Refractory Output of Shandong Refractories Group, 2012-2017
Capacity of Shandong Refractories Group’s Main Subsidiaries/Branches
Refractory Output of Tongda Refractory Technologies, 2012-2017
Refractory Output of Sinosteel Refractory, 2012-2017
Output of Jiangsu Sujia Group New Materials Co., Ltd., 2012-2017
Main Refractory Products of Haicheng Houying Trade Group
Refractory Output of Haicheng Houying Trade Group, 2012-2017
Output of Shanxi Xixiaoping Refractories, 2012-2017
Refractory Output of Zhengzhou Zhendong Technology, 2012-2017
Refractory Output of Shandong Luqiao New Materials, 2012-2017
Refractory Output of Sinosteel Luoyang Institute of Refractories Research, 2012-2017
Capacity of Haicheng Magnesite Refractory General Factory by Product
China’s Refractory Output and Demand, 2017-2022E
Output and YoY Growth of Major Refractory Companies in China, 2017
Global and China Optical Fiber Preform Industry Report, 2021-2026
Optical fiber preforms play a key role in the optical fiber communication industry chain. The global construction of 4G and FTTH requires less optical fiber and cable, which has dragged down the deman...
Global and China Photoresist Industry Report, 2021-2026
Since its invention in 1959, photoresist has been the most crucial process material for the semiconductor industry. Photoresist was improved as a key material used in the manufacturing process of prin...
Global and China Needle Coke Industry Report, 2021-2026
Needle coke is an important carbon material, featuring a low thermal expansion coefficient, a low electrical resistivity, and strong thermal shock resistance and oxidation resistance. It is suitable f...
Global and China 3D Glass Industry Report, 2021-2026
3D curved glass is light and thin, transparent and clean, anti-fingerprint, anti-glare, hard and scratch-resistant, and performs well in weather resistance. It is applicable to terminals such as high-...
Global and China Graphene Industry Report, 2020-2026
Graphene, a kind of 2D carbon nanomaterial, features excellent properties such as mechanical property and super electrical conductivity and thermal conductivity. Its downstream application ranges from...
Global and China Optical Fiber Preform Industry Report, 2020-2026
Optical fiber preform as a hi-tech product and a crucial link in the optical fiber industry chain contributes to 70% or so of profit margin. Global 4G and FTTH construction at dusk leads to the shrink...
Global and China 3D Glass Industry Report, 2020-2026
Global 3D glass market has been enlarging over the recent years amid demetallization of smartphone back covers and popularity of smart wearables, to approximately $2.86 billion in 2019 and to an estim...
Global and China Photoresist Industry Report, 2020-2026
In 2019, global photoresist market was valued at $8.3 billion, growing at a compound annual rate of 5.1% or so since 2010, and it will outnumber $12.7 billion in 2026 with advances in electronic techn...
Global and China Synthetic Diamond Industry Report, 2020-2026
While its mechanical property is given full play in fields like grinding and cutting, diamond with acoustic, optical, magnetic, thermal and other special properties, as superconducting material, intel...
Global and China Needle Coke Industry Report, 2020-2026
With the merits like small resistivity, excellent resistance to impact and good anti-oxidation property, needle coke has been widely used in ultra-high power graphite electrodes, nuclear reactor decel...
Global and China Optical Fiber Preform Industry Report, 2019-2025
Optical fiber preform, playing an important role in the optical fiber and cable industry chain, seizes about 70% profits of optical fiber. Global demand for optical fiber preform stood at 16.2kt in 20...
China Silicon Carbide Industry Report, 2019-2025
Silicon carbide (SiC) is the most mature and the most widely used among third-generation wide band gap semiconductor materials. Over the past two years, global SiC market capacity, however, hovered ar...
Global and China Photoresist Industry Report, 2019-2025
Photoresist, a sort of material indispensable to PCB, flat panel display, optoelectronic devices, among others, keeps expanding in market size amid the robust demand from downstream sectors. In 2018, ...
Global and China Graphene Industry Report, 2019-2025
Graphene is featured with excellent performance and enjoys a rosy prospect. The global graphene market was worth more than $100 million in 2018, with an anticipated CAGR of virtually 45% between 2019 ...
Global and China 3D Glass Industry Chain Report, 2019-2025
The evolution of AMOLED conduces to the steady development of 3D curved glass market. In 2018, the global 3D glass market expanded 37.7% on an annualized basis and reached $1.9 billion, a figure proje...
China Wood Flooring Industry Report, 2019-2025
With the better standard of living and the people’s desire for an elegant life, wood flooring sees a rising share in the flooring industry of China, up from 33.9% in 2009 to 38.9% in 2018, just behind...
Global and China Photovoltaic Glass Industry Report, 2019-2025
In China, PV installed capacity has ramped up since the issuance of photovoltaic (PV) subsidy policies, reaching 53GW in 2017, or over 50% of global total. However, the domestic PV demand was hit by t...
Global and China ITO Targets Industry Chain Report, 2019-2025
Featured by good electrical conductivity and transparency, ITO targets are widely applied to fields of LCD, flat-panel display, plasma display, touch screen, electronic paper, OLED, solar cell, antist...