Global and China 3D Glass Industry Chain Report, 2018-2023
-
Sep.2018
- Hard Copy
- USD
$3,200
-
- Pages:129
- Single User License
(PDF Unprintable)
- USD
$3,000
-
- Code:
ZHP077
- Enterprise-wide License
(PDF Printable & Editable)
- USD
$4,500
-
- Hard Copy + Single User License
- USD
$3,400
-
The rise of curved screen conduces to the growth of 3D glass industry. Global 3D glass market size was approximately USD1.38 billion in 2017, soaring by 55.2% from a year earlier, a figure projected to surge to USD2.13 billion in 2018 and USD5.0 billion in 2023 in the wake of higher penetration of 3D glass (about 16.2% in 2017).
In China, 3D glass penetration remains well below the global average and market size is small, leaving much room for growth. China’s 3D glass market was worth roughly RMB1.52 billion (around USD220 million by an exchange rate of 1: 6.75) in 2017, and is expected to show an AAGR of over 20% between 2018 and 2023.
In the downstream markets, 3D glass is often used in smartphones and wearable devices and also finds small application in head-mounted VR devices, vehicle console display, portable dashboard, etc..
In particular, smartphones consume 3D glass most for the moment, in 2017 making up over 70% of total 3D glass demand worldwide, and even a higher proportion, above 90%, in China. Over the past two years, 3D glass was not only applied to high-end cellphone models of Apple and Samsung but employed by low- and mid-end smartphone brands like Xiaomi, Vivo and OPPO. Global penetration of 3D glass into smartphones rocketed to 8.1% in 2017 from 0.5% in 2015, and is predicted to outstrip 30.0% in 2023.
As wearable device market has grown mature over the years, its demand for 3D glass keeps rising. The world’s demand for 3D glass from wearable devices reached about 38 million pieces in 2017, with an estimated AAGR of over 35.0% during 2018-2023.
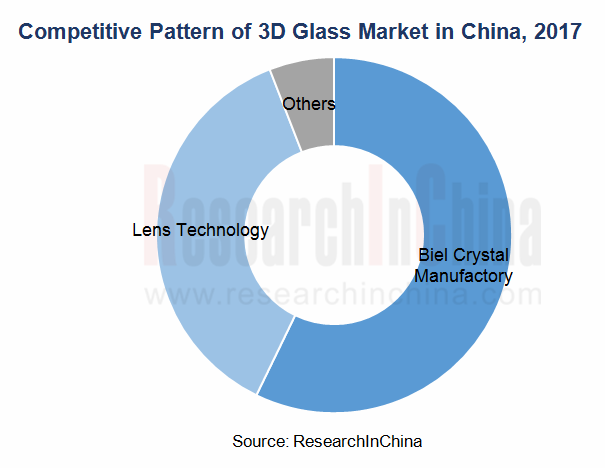
As concerns competition, Biel Crystal Manufactory and Lens Technology now seize a combined over 90% share in the Chinese 3D glass market, of which the former alone grabs 50% at least. O-Film Tech, BYD Electronics and Jiangxi Lianchuang Electronics however worked hard on 3D glass layout in recent years. The monopoly in the market is to be broken and competition will prick up in the coming years.
The 3D glass industry in China will be facilitated by the following:
1. The Ministry of Industry and Information Technology of China (MIIT) announced the commercial use of 5G system in late 2017, so metal smartphone case becomes more detrimental to signal receiving while non-metallic materials like glass begin to emerge.
2. AMOLED screen is used more widely. In 2017, its penetration in Samsung stood at over 80%, OPPO and Vivo above 50%. Use of such display needs 3D glass.
Global and China 3D Glass Industry Chain Report, 2018-2023 highlights the following:
 Global 3D glass industry (supply, demand, market structure, etc.);
Chinese 3D glass market (size, structure, patents, prices, competitive pattern, drivers, etc.);
3D glass production materials (glass substrate, polishing materials, coating materials, ink, etc.) (market size, competitive pattern, etc.);
3D glass processing equipment (hot bending machine, CNC engraving machine, flat grinding machine, etc.) (market size, competition, processing technology, etc.);
Downstream applications (smartphone, wearable device, VR, etc.) (market status, demand for 3D glass, etc.);
17 global and Chinese 3D glass manufacturers (operation, 3D glass business, etc.)
1. Overview of 3D Glass
1.1 Definition
1.2 Advantage
1.3 Production Process
1.4 Industry Chain
1.5 Industry Characteristics
1.5.1 Periodicity
1.5.2 Seasonality
1.5.3 Regionality
1.5.4 High Processing Barrier
2. Global 3D Glass Industry
2.1 Market Size
2.1.1 Supply
2.1.2 Demand
2.2 Market Structure
2.3 Regional Structure
3. 3D Glass Industry in China
3.1 Market
3.1.1 Market Size
3.1.2 Market Structure
3.2 Patent
3.2.1 Total Quantity
3.2.2 Pattern
3.3 Competitive Landscape
3.4 Market Price
3.5 Market Drivers
4. 3D Glass Production Materials
4.1 Glass Substrate
4.1.1 Production Technology
4.1.2 Market Size
4.1.3 Competitive Landscape
4.2 Polishing Material
4.2.1 Market Status
4.2.2 Competitive Landscape
4.3 Other
4.3.1 Coating Materials
4.3.2 Ink
5. 3D Glass Processing Equipment
5.1 Hot Bending Machine
5.1.1 Market Size
5.1.2 Competition
5.2 CNC Engraving Machine
5.2.1 Market Size
5.2.2 Competition
5.2.3 Processing Technology
5.2.4 Core Technology
5.2.5 Development Trend
5.3 Flat Grinding Machine
5.3.1 Overview
5.3.2 Competitive Landscape
6. Main Applications
6.1 Smartphone
6.1.1 Market Size
6.1.2 Advantages of 3D Glass Phone Screen
6.1.3 Trends of Phone Screen
6.1.4 Mobile Phone Brands Adopting 3D Glass
6.2 Wearable Device
6.2.1 Market Size
6.2.2 3D Glass Application
6.3 VR
6.3.1 Market Size
6.3.2 3D Glass Application
7. Key 3D Glass Manufacturers
7.1 Lens Technology
7.1.1 Profile
7.1.2 Operation
7.1.3 3D Glass Business
7.2 CPT Technology
7.2.1 Profile
7.2.2 Operation
7.2.3 3D Glass Business
7.3 Firstar Panel Technology
7.3.1 Profile
7.3.2 Operation
7.3.3 3D Glass Business
7.4 O-Film Tech
7.4.1 Profile
7.4.2 Operation
7.4.3 3D Glass Business
7.5 Triumph Science & Technology
7.5.1 Profile
7.5.2 Operation
7.5.3 3D Glass Business
7.6 Holitech Technology
7.6.1 Profile
7.6.2 Operation
7.6.3 3D Glass Business
7.7 G-Tech Optoelectronics
7.7.1 Profile
7.7.2 Operation
7.7.3 3D Glass Business
7.8 Corning
7.8.1 Profile
7.8.2 Operation
7.8.3 3D Glass Business
7.9 RLD Cover Glass Technology
7.9.1 Profile
7.9.2 Operation
7.10 Other
7.10.1 Biel Crystal Manufactory
7.10.2 Samsung Corning Precision Glass
7.10.3 Wuhu Token Sciences
7.10.4 Truly International
7.10.5 Shenzhen DJN Optronics
7.10.6 Henan Comyoung Electronics
7.10.7 JANUS (Dongguan) Precision Components
7.10.8 BYD Electronics
Shape Difference between 2D/2.5D/3D Glass
Performance Comparison between 2D Glass and 3D Glass
Glass Processing Technology
2.5D Glass Processing Technology
3D Glass Molding Process
Comparison of 2D, 2.5D and 3D Glass Production Technologies
3D Glass Industry Chain
Competitive Landscape of 3D Glass Industry Chain
Main 3D Glass Processing Barriers
Global 3D Glass Shipments, 2016-2023E
Global 3D Glass Market Size, 2016-2023E
Global 3D Glass Penetration Rate, 2015-2023E
Global 3D Glass Demand, 2015-2023E
Global 3D Glass Market Size Structure (by Application), 2016-2023E
Global 3D Glass Production Structure (by Region), 2017
China's 3D Glass Market Size, 2016-2023E
China's 3D Glass Penetration Rate, 2016-2023E
China's 3D Glass Market Size Structure (by Application), 2017-2023E
Applications for 3D Glass Patents in China, 2010-2023E
Applications of Major Manufacturers for 3D Glass Patents in China, 2017
3D Glass Technical Roadmap of Major Manufacturers
Shipments of Major Cover Glass Manufacturers in China, 2017-2018
Customers Supported by Chinese Cover Glass Manufacturers
Competitive Landscape of Chinese 3D Glass Market, 2017
3D Glass Layout of Major Manufacturers in China, 2017
Leading 3D Glass Manufacturers and Their Capacity in China by 2017
Market Prices of Different Mobile Phone Glass in China, 2017
Market Prices of 3D Mobile Phone Cover Glass in China, 2016-2023E
Global Wireless Charging Market Size, 2012-2023E
Mobile Terminals (by Model) Using Wireless Charging in Recent Years
Mobile Phone Appearance Revolution by AMOLED+3D Glass
Cost Structure of 3D Glass, 2016
Cost Structure of Raw Materials for 3D Glass in 2017
Structure of Glass Substrate
Properties of Glass Substrate
Dimensions and Applications of Glass Substrate
Floating Process for Glass Substrate
Orifice-flow Pulling-down Process of Glass Substrate
Overflow Fusion Process of Glass Substrate
Three Technologies for Manufacturing Glass Substrate
Global Market Pattern of Glass Substrate (by Technology) for Cellphone Cover, 2017
Global Glass Substrate Capacity, 2013-2018E
Global Glass Substrate Demand, 2014-2023E
China’s Glass Substrate Demand, 2013-2023E
China’s Glass Substrate Supply, 2013-2023E
Competitive Landscape of Chinese Glass Substrate Market, 2017
World’s Leading Suppliers of Glass Cover Substrate
Production Bases and Major Customers of World’s Leading Glass Substrate Manufacturers
Chinese Manufacturers’ Layout in Glass Substrate Manufacturing Line
Application Proportion of Rare-earth Elements in Rare-earth Polishing Materials
Major Applications of Rare-earth Polishing Powder in China, 2017
Capacity of Major Polishing Material Enterprises in China, 2017
China’s Ink Output, 2013-2023E
TOP15 Ink Companies in the World, 2016
Top 20 Ink Companies in China, 2016
3D Glass Process Flow
Hot Bending Process
Global Capacity and Prices of Hot Bending Machines, 2016-2023E
Global Demand for 3D Glass-use Hot Bending Machine, 2016-2023E
Global 3D Glass-use Hot Bending Machine Market Size, 2016-2023E
China’s Demand for 3D Glass-use Hot Bending Machine, 2016-2023E
Global Share of China’s Demand for 3D Glass-use Hot Bending Machine, 2016-2023E
Hot Bending Machine Ownership of Major Manufacturers in China
Major Suppliers of 3D Glass Hot Bending Machine in China, 2017
Global Demand for 3D Glass-use Five-axis CNC Engraving Machine, 2016-2023E
Global 3D Glass-use Five-axis CNC Engraving Machine Market Size, 2016-2023E
China’s Demand for 3D Glass-use Five-axis CNC Engraving Machine, 2016-2023E
China 3D Glass-use Five-axis CNC Engraving Machine Market Size, 2016-2021E
Major Manufacturers of CNC Engraving Machine and Related Parts in China
Processing Time of Bi-metal Die-casting
Global Major CNC System Suppliers
Competitive Landscape of Chinese CNC System Market, 2017
Product Lines of Major CNC System Manufacturers
Domestic and Foreign Major CNC Machine Tool Electric Spindle Manufacturers
Development History and Trend of CNC Engraving Machine
Optical Glass Grinding and Polishing Process
2D Glass Grinding and Polishing Machine
2.5D/3D Glass Grinding and Polishing Machine
Top 22 Manufacturers of 3D Glass Polishing Machine in China
Global Smartphone Shipments and Growth Rate, 2011-2023E
Global Shipments and Market Share of Smart Phone Suppliers, 2016-2017
Global Shipments and Market Share of Smart Phone Suppliers, 2018Q1-Q2
Global Smartphone Shipments Structure (by Screen Size), 2015-2021E
Global Smartphone Display Shipment Structure, 2015-2020E
Types of Display Adopted by Major Smartphone Vendors, 2017
Ranking of Smartphone Panel Shipments Worldwide, 2017
Global Market Share of AMOLED Mobile Phones by Brand, 2018H1
Smartphone Shipments in China, 2009-2018
Shares of Smartphone Shipment by Price in China, 2013-2017
Assembly Rate of AMOLED Screen in Smart Phone in China, 2014-2023E
Chinese Market Share of AMOLED Mobile Phones by Brand, 2018H1
Mobile Phone Glass Cover Market Size in China, 2011-2018
Main Types of Curved-screen Mobile Phones
Smartphone Front and Back Cover Combination Design Modes
Smartphone Front and Back Cover Design Trends
Penetration Rate of 3D Cover Glass in Global Smartphone Field, 2015-2023E
Quantity of Top 50 Best-selling Cellphones Using Glass Cover in China, 2017
Development Trends of Cellphones with 3D Glass and Ceramic Cases, 2014-2017
Structure of Galaxy S7 with Metal Frame + Glass Body
Motorola’s Shatter Shield Structure
Mobile Phone Brands Using 3D Glass, 2016-2018
Development Trend of Mobile Phone Cover Glass
OLED Penetration of Leading Mobile Phone Vendors Worldwide, 2016-2021E
Global Shipments of OLED Panel, 2015-2023E
Global Demand and Demand Scale for Smartphone-use 3D Glass, 2015-2023E
China’s Demand for Smartphone-use 3D Glass, 2016-2023E
China’s Demand Scale for Smartphone-use 3D Glass, 2016-2023E
Global Wearable Device Shipments, 2016-2023E
Global Wearable Device Shipments (by Product), 2016-2021E
Competitive Landscape of Global Wearable Device Market, 2017-2018
China’s Wearable Device Market Size, 2012-2023E
Ranking of Major Wearable Device Vendors in China by Shipment, 2017-2018
Global Wearable Device Panel Shipments and Growth Rate, 2014-2024E
Penetration Rate of AMOLED in Global Wearable Devices, 2015-2023E
Global Shipment of OLED Panels for Wearable Devices, 2015-2023E
Global Demand of 3D Glass for Wearable Devices, 2016-2023E
Structure of VR System
Global VR/AR Market Size, 2015-2023E
Global VR Hardware Shipments, 2016-2023E
Applications of VR
Market Share of VR by Brand, 2017
Financing in Global VR Industry, 2017-2018
Financing in China VR Industry, 2017-2018
China VR Market Size, 2016-2023E
Chinese Market Size of VR Head-mounted Devices, 2016-2023E
Shipment of VR Head-mounted Devices in China, 2016-2023E
Competitive Landscape of Major VR Products in China
Mainstream VR Products Using AMOLED Screens
Penetration Rate of AMOLED in Headset VR Field, 2016-2023E
Equity Structure of Lens Technology, 2018
Distribution of Lens Technology’s Bases
Revenue and Net Income of Lens Technology, 2012-2018
Revenue Structure of Lens Technology (by Product), 2012-2017
Curved-glass Cover Output of Lens Technology, 2016-2018
Lens Technology’s Layout in Glass Cover
Equity Structure of CPT Technology, 2018
Revenue and Net Income of CPT Technology, 2012-2018
Revenue Structure of CPT Technology (by Business), 2014-2018
Revenue Structure of CPT Technology (by Region), 2014-2018
CPT Technology’s Revenue from Major Customers and % of Total Revenue, 2016-2017
KMTC’s Revenue and Net Income, 2014-2018
3D Glass Capacity of CPT Technology, 2015-2018
Equity Structure of Firstar Panel Technology, 2018
Revenue and Net Income of Firstar Panel Technology, 2013-2017
Revenue Structure of Firstar Panel Technology (by Product), 2014-2017
Revenue Structure of Firstar Panel Technology (by Sales Mode), 2014-2017
Firstar Panel Technology’s Layout in Display Module Products and the Tendency
Equity Structure of O-Film Tech, 2018
Main Business Distribution of O-Film Tech
Revenue and Net Income of O-Film Tech, 2012-2018
Revenue Structure of O-Film Tech (by Product), 2014-2018
Revenue Structure of O-Film Tech (by Region), 2014-2018
Touch Display Revenue and Growth Rate of O-Film Tech, 2013-2018
Equity Structure of Triumph Science & Technology, 2018
Main Business and Capacity of Triumph Science & Technology, 2018
Revenue and Net Income of Triumph Science & Technology, 2013-2018
Production and Sales of Triumph Science & Technology (by Product), 2017
Revenue Structure of Triumph Science & Technology (by Product), 2014-2017
Revenue Structure of Triumph Science & Technology (by Region), 2014-2017
Revenue and Net Income of Anhui Bengbu Huayi Conducive Film Glass Co., Ltd., 2010-2017
Equity Structure of Holitech Technology, 2018
Business Layout of Holitech Technology
Development Course of Holitech Technology
Revenue and Net Income of Holitech Technology, 2013-2018
Revenue Structure of Holitech Technology (by Product), 2016-2017
Revenue Structure of Holitech Technology (by Region), 2014-2017
Output and Sales Volume of Holitech Technology’s Touch Display Products, 2015-2017
Revenue and Net Income of G-Tech Optoelectronics, 2012-2018
Revenue Structure of G-Tech Optoelectronics (by Region), 2012-2017
Revenue and Net Income of Corning, 2013-2018
Revenue Structure of Corning (by Business), 2015-2017
Revenue Structure of Corning (by Region), 2015-2017
Corning’s GorillaGlass4 Drop Tests
Corning’s Revenue from Gorilla Glass Products, 2014-2017
Revenue and Net Income of RLD, 2013-2017
Revenue Structure of RLD (by Product), 2014-2017
Name List and Revenue Contribution of RLD’s Top 5 Customers, 2016-2017
Milestones of Biel Crystal Manufactory since 2000
Curved Glass Cover Output of Biel Crystal Manufactory, 2016
Revenue and Net Income of Wuhu Token Sciences, 2013-2018
Revenue and Net Income of Truly, 2014-2018
Revenue Structure of Truly (by Product), 2016-2017
Revenue Structure of Truly (by Region), 2016-2017
JANUS Intelligent Group’s Layout in 3C Electronic Structures Industry Chains
Main Products of JANUS (Dongguan) Precision Components
Revenue and Net Income of JANUS (Dongguan) Precision Components, 2011-2018
Revenue from Consumer Electronics Precision Structural Parts of JANUS (Dongguan) Precision Components, 2012-2017
Revenue and Net Income of BYD Electronic, 2012-2017
Revenue Structure of BYD Electronic (by Business), 2016-2017
Name List and Revenue Contribution of BYD Electronic’s Major Phone Case Customers, 2017
BYD Electronic’s Revenue from Cellphone Glass Case and Growth Rate, 2013-2018
3D Glass Production Capacity of BYD Electronic, 2017-2018
Global and China Optical Fiber Preform Industry Report, 2021-2026
Optical fiber preforms play a key role in the optical fiber communication industry chain. The global construction of 4G and FTTH requires less optical fiber and cable, which has dragged down the deman...
Global and China Photoresist Industry Report, 2021-2026
Since its invention in 1959, photoresist has been the most crucial process material for the semiconductor industry. Photoresist was improved as a key material used in the manufacturing process of prin...
Global and China Needle Coke Industry Report, 2021-2026
Needle coke is an important carbon material, featuring a low thermal expansion coefficient, a low electrical resistivity, and strong thermal shock resistance and oxidation resistance. It is suitable f...
Global and China 3D Glass Industry Report, 2021-2026
3D curved glass is light and thin, transparent and clean, anti-fingerprint, anti-glare, hard and scratch-resistant, and performs well in weather resistance. It is applicable to terminals such as high-...
Global and China Graphene Industry Report, 2020-2026
Graphene, a kind of 2D carbon nanomaterial, features excellent properties such as mechanical property and super electrical conductivity and thermal conductivity. Its downstream application ranges from...
Global and China Optical Fiber Preform Industry Report, 2020-2026
Optical fiber preform as a hi-tech product and a crucial link in the optical fiber industry chain contributes to 70% or so of profit margin. Global 4G and FTTH construction at dusk leads to the shrink...
Global and China 3D Glass Industry Report, 2020-2026
Global 3D glass market has been enlarging over the recent years amid demetallization of smartphone back covers and popularity of smart wearables, to approximately $2.86 billion in 2019 and to an estim...
Global and China Photoresist Industry Report, 2020-2026
In 2019, global photoresist market was valued at $8.3 billion, growing at a compound annual rate of 5.1% or so since 2010, and it will outnumber $12.7 billion in 2026 with advances in electronic techn...
Global and China Synthetic Diamond Industry Report, 2020-2026
While its mechanical property is given full play in fields like grinding and cutting, diamond with acoustic, optical, magnetic, thermal and other special properties, as superconducting material, intel...
Global and China Needle Coke Industry Report, 2020-2026
With the merits like small resistivity, excellent resistance to impact and good anti-oxidation property, needle coke has been widely used in ultra-high power graphite electrodes, nuclear reactor decel...
Global and China Optical Fiber Preform Industry Report, 2019-2025
Optical fiber preform, playing an important role in the optical fiber and cable industry chain, seizes about 70% profits of optical fiber. Global demand for optical fiber preform stood at 16.2kt in 20...
China Silicon Carbide Industry Report, 2019-2025
Silicon carbide (SiC) is the most mature and the most widely used among third-generation wide band gap semiconductor materials. Over the past two years, global SiC market capacity, however, hovered ar...
Global and China Photoresist Industry Report, 2019-2025
Photoresist, a sort of material indispensable to PCB, flat panel display, optoelectronic devices, among others, keeps expanding in market size amid the robust demand from downstream sectors. In 2018, ...
Global and China Graphene Industry Report, 2019-2025
Graphene is featured with excellent performance and enjoys a rosy prospect. The global graphene market was worth more than $100 million in 2018, with an anticipated CAGR of virtually 45% between 2019 ...
Global and China 3D Glass Industry Chain Report, 2019-2025
The evolution of AMOLED conduces to the steady development of 3D curved glass market. In 2018, the global 3D glass market expanded 37.7% on an annualized basis and reached $1.9 billion, a figure proje...
China Wood Flooring Industry Report, 2019-2025
With the better standard of living and the people’s desire for an elegant life, wood flooring sees a rising share in the flooring industry of China, up from 33.9% in 2009 to 38.9% in 2018, just behind...
Global and China Photovoltaic Glass Industry Report, 2019-2025
In China, PV installed capacity has ramped up since the issuance of photovoltaic (PV) subsidy policies, reaching 53GW in 2017, or over 50% of global total. However, the domestic PV demand was hit by t...
Global and China ITO Targets Industry Chain Report, 2019-2025
Featured by good electrical conductivity and transparency, ITO targets are widely applied to fields of LCD, flat-panel display, plasma display, touch screen, electronic paper, OLED, solar cell, antist...