Global and China Graphene Industry Report, 2018-2023
-
Oct.2018
- Hard Copy
- USD
$3,000
-
- Pages:144
- Single User License
(PDF Unprintable)
- USD
$2,800
-
- Code:
ZHP079
- Enterprise-wide License
(PDF Printable & Editable)
- USD
$4,200
-
- Hard Copy + Single User License
- USD
$3,200
-
Graphene, a kind of new material, is still being developed and ready to be commercialized for the moment. Many countries are zealously competing for patents. In 2017, there were a total of 13,371 patent filings about graphene worldwide, an upsurge of 30.7% over the previous year, and with a CAGR of 60.9% between 2010 and 2017.
Although with a small size, the graphene industry is progressing apace. Before reaching nearly USD200 million in 2018, global graphene market size stood at roughly USD85 million in 2017, soaring by 84.8% year on year inasmuch as graphene found massive application in fields like anticorrosive paint and energy storage over the past two years, and is expected to surpass USD1 billion in 2023 in the wake of progresses in R&D technologies and application.
China ranks first by comprehensive strength in global graphene industry. The graphene market of China was recorded at RMB127 million (approximately USD18.81 million by an exchange rate of 1 dollar to 6.75 yuan) in 2017, a year-on-year upsurge of 69.3%, taking a 22.1% share in global market, and will climb to estimated RMB230 million in 2018 and outnumber RMB1.3 billion in 2023 with the support from national policies and a growing number of new entrants in the graphene sector.
Graphene gets utilized primarily in lithium battery and super capacitor currently in China. In 2017, the demand for graphene from lithium battery comprised more than 50.0% of the total, but will see a decreasing proportion in the future as graphene is increasingly used in new energy, composite materials, wearables, thermal management, energy conservation and environmental protection.
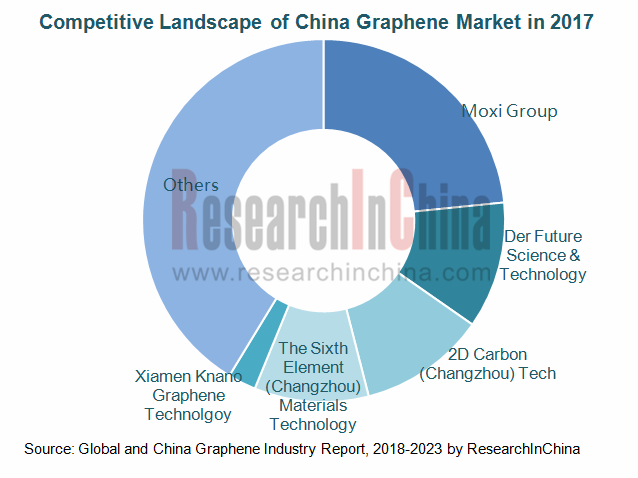
The global graphene manufacturers cluster in UK, China and the United States. Among them, China boasts the most manufacturers, namely over 4,000 ones, but most of which are small start-ups, while medium and large-sized enterprises mainly include Moxi Group, The Sixth Element (Changzhou) Materials Technology, 2D Carbon (Changzhou) Tech, Der Future Science & Technology, and Qingdao HaoXin New Energy Technology.
Now, Chinese graphene market is highly concentrated, with the CR5 of 58.7% in 2017. As the largest producer of graphene in China, Moxi Group have subsidiaries like Ningbo Morsh Technology and Chongqing Graphene Tech. In 2017, it seized the market share of 23.4%.
Global and China Graphene Industry Report, 2018-2023 focuses on the following:
 Graphene (definition, performance, preparation methods, development course, industrial chain);
Global grapheme industry (development status quo, market size, prices, prospects of industrialization, patents, etc.);
China’s grapheme industry (policy climate, current development, patents, enterprises’ forays, etc.);
Upstream (graphite, methane, etc.) and downstream (lithium battery, super capacitor, transparent electrode, integrated circuit, etc.) markets of grapheme, applications of grapheme, etc.;
19 foreign and 16 Chinese graphene manufacturers (operation, graphene business, etc.)
1 Overview of Graphene
1.1 Definition
1.2 Performance
1.3 Preparation Method
1.4 Development History
1.5 Development Bottleneck
1.6 Industry Chain
2 Global Graphene Industry
2.1 Status Quo
2.2 Market Size
2.3 Market Price
2.4 Industrialization Prospects
2.5 Patents
2.5.1 Total Filings
2.5.2 Structure
2.5.3 Patent Filings in Major Countries
2.5.4 Patent Filings of Major Companies
2.6 Competitiveness Analysis
3 Chinese Graphene Industry
3.1 Policy Environment
3.2 Current Situation
3.2.1 Graphene Powder
3.2.2 Graphene Film
3.3 Industrialization Development
3.3.1 Industry-University-Research Collaboration
3.3.2 Industrial Park
3.3.3 Patents
3.4 Enterprises’ Layout
4 Upstream Sectors
4.1 Graphite
4.2 Others
4.2.1 Methane
4.2.2 Ethanol
5 Downstream Applications
5.1 Lithium Battery
5.1.1 Graphene Application
5.1.2 Market Situation
5.2 Supercapacitor
5.2.1 Graphene Application
5.2.2 Market Situation
5.3 Transparent Electrode
5.3.1 Graphene Application
5.3.2 Market Situation
5.4 Integrated Circuit
5.5 Others
5.5.1 Polyester-based Composites
5.5.2 Electrically Conductive Printing Ink
5.5.3 Heat Dissipating Material
6 Major Global Graphene Manufacturers
6.1 Northern Graphite
6.1.1 Profile
6.1.2 Operation
6.1.3 Graphene Business
6.2 CVD
6.2.1 Profile
6.2.2 Operation
6.2.3 Graphene Business
6.3 Focus Graphite
6.3.1 Profile
6.3.2 Operation
6.3.3 Graphene Business
6.4 Lomiko Metals
6.4.1 Profile
6.4.2 Operation
6.4.3 Graphene Business
6.5 Applied Graphene Materials
6.5.1 Profile
6.5.2 Operation
6.5.3 Graphene Business
6.6 Graphene NanoChem Plc
6.6.1 Profile
6.6.2 Operation
6.6.3 Graphene Business
6.7 Haydale Graphene Industries
6.7.1 Profile
6.7.2 Operation
6.7.3 Revenue Structure
6.7.4 Graphene Business
6.8 Other Enterprises
6.8.1 Graphene Laboratories
6.8.2 Graphenea
6.8.3 Graphene Square
6.8.4 Grafoid
6.8.5 XG Sciences Inc
6.8.6 BGT Materials Limited
6.8.7 Angstron Materials
6.8.8 Graphenano
6.8.9 Vorbeck Materials
6.8.10 CambridgeNanosystems
6.8.11 GRAPHENEFRONTIERS
6.8.12 GraphenePlatform Corp
7. Key Chinese Players
7.1 The Sixth Element (Changzhou) Materials Technology Co., Ltd.
7.1.1 Profile
7.1.2 Operation
7.1.3 Graphene Business
7.2 2D Carbon (Changzhou) Tech Inc., Ltd.
7.2.1 Profile
7.2.2 Operation
7.2.3 R&D
7.2.4 Graphene Business
7.3 Beijing Moxi Holding Group Co., Ltd.
7.3.1 Profile
7.3.2 Ningbo Morsh Technology Co., Ltd.
7.3.3 Chongqing Graphene Tech. Co., Ltd.
7.4 Fangda Carbon New Material Co., Ltd.
7.4.1 Profile
7.4.2 Operation
7.4.3 R&D and Projects under Construction
7.4.4 Graphene Business
7.5 Der Future Science & Technology Holding Group Co., Ltd.
7.5.1 Profile
7.5.2 Operation
7.5.3 R&D and Projects under Construction
7.5.4 Graphene Business
7.6 Kangdexin Composite Material Group Co., Ltd.
7.6.1 Profile
7.6.2 Operation
7.6.3 R&D and Projects under Construction
7.6.4 Graphene Business
7.7 Xiamen Knano Graphene Technology Co., Ltd.
7.7.1 Profile
7.7.2 Operation
7.7.3 Graphene Business
7.8 Others
7.8.1 Nanjing XFNANO Materials Tech Co., Ltd.
7.8.2 JCNANO Tech Co., Ltd.
7.8.3 Tianjin Plannano Energy Technologies Co., Ltd.
7.8.4 Changzhou Zhongchao Graphene Power Technology Co., Ltd.
7.8.5 Changzhou Ruifengte Technology Co., Ltd.
7.8.6 Dongxu Optoelectronic Technology Co., Ltd.
7.8.7 Qingdao Huagao Graphene Technology Corp. Ltd.
7.8.8 Shengquan Group
7.8.9 Qingdao Haoxin New Energy Technology Corporation
Types of Graphene
Performance of Graphene
Conductivity of Typical Electric Conductors
Carrier Mobility of Typical Semiconductors
Thermal Conductivity of Typical Heat Dissipation Materials
Four Preparation Methods of Graphene
Graphene Development History
Graphene Industry Chain
Competitive Landscape of Graphene Industry Chain
Progress in R&D of CVD Graphene Preparation in Major Countries Worldwide
Global Market Size of Graphene, 2016-2023E
Global Market Size of Graphene by Product, 2017/2023E
Demand Structure of Graphene Worldwide by Sector, 2017
Global Market Prices of Graphene Powder, 2011/2018
Global Market Prices of Graphene Conductive Film, 2012-2022E
Graphene Industrialization Process
Roadmap for Graphene Industrialization, 2015-2025E
Graphene-related R&D Projects and Grants in Foreign Countries
Major Global Graphene Preparation Enterprises
Distribution of Graphene Patent Fillings Worldwide, 2009-2018
Graphene Patents Structure Worldwide by Region, 2017
Proportion of Graphene Patents in Major Countries by Technology, 2017
Focuses of Graphene Patent Portfolios in Major Countries
Graphene Patent Filings in US, 2009-2018
Graphene Patent Filings in S.Korea, 2009-2018
Graphene Patent Filings in Europe, 2009-2018
Flows of Graphene Patent Technologies among Major Countries
Samsung’s Graphene Patent Fillings, 2009-2018
Samsung’s Graphene Patents Structure by Application, 2017
LG’s Graphene Patent Fillings, 2011-2018
LG’s Graphene Patents Structure by Application, 2017
IBM’s Graphene Patent Fillings, 2009-2018
Ranking of Global Graphene Index by Competitive Potential, 2017
Ranking of Global Graphene Index by Competitive Behavior, 2017
Ranking of Global Graphene Index by Competitive Performance, 2017
China’s Major Policies on Graphene, 2012-2018
Enterprises that Received Governmental Subsidies, 2017
Porter's Five Forces Model for the Graphene Industry
Graphene Papers Published in China, 2009-2017
Market Size of Graphene in China, 2016-2023E
Graphene Applied Structure in China, 2017
Preparation Process of Graphene Powder
Major Graphene Powder Manufacturers in China
Capacities of Key Graphene Powder Manufacturers in China, 2017
Major Graphene Film Manufacturers in China, 2015
Distribution of Major Graphene Industrial Parks in China
Graphene Patent Filings in China, 2009-2018
Distribution of Graphene Patents in China, 2017
Proportion of China’s Graphene Patents Worldwide by Region, 2017
Major Graphene Manufacturers in China
Graphene Business Layout of Major Graphene Manufacturers in China
Graphite-based Graphene Preparation
Distribution of Graphite Reserves Worldwide, 2017
Graphite Output in Major Countries/Region, 2012-2017
Price for China-made Ethanol, 2017-2018
Major Global Graphene Users in Downstream Sectors
Internal Resistance for Conductive Additives of Graphene-based Lithium Battery
Lithium Storage Capability of Anode Materials of Various Types
Progress in Research on Graphene for Lithium Battery
Global Market Share of Main Lithium Battery Anode Materials, 2017
Global Market Share of Main Lithium Battery Anode Material, 2017
Market Size of Graphene for Lithium Battery in China, 2017/2023E
Global Lithium Battery Market Size, 2012-2023E
Global Lithium Battery Market Demand, 2013-2023E
Global Demand for Lithium Battery Anode Materials, 2016-2023E
Competitive Landscape of Global Lithium Battery Market, 2017
Sales Volume and Market Size of Lithium Battery in China, 2011-2023E
Shipments of Lithium Battery Anode Materials in China, 2012-2023E
China’s Lithium Battery Export Volume and Value, 2007-2017
Major Lithium Battery Manufacturers in China
Application of Graphene in Supercapacitor
Parameters for Supercapacitor Electrode Materials
R&D Focus of Graphene Supercapacitor
Progress in Graphene in Supercapacitor
Market Size of Graphene for Supercapacitor in China, 2015-2023E
Global Market Size of Supercapacitor, 2015-2023E
Market Size and Growth Rate of Supercapacitor in China, 2012-2023E
Progress in Graphene in Touch Panel
Global Shipments of Touch Panels, 2012-2023E
Global Shipments of LCD, 2010-2023E
Shipments of Touch Panels in China by Product, 2010-2018
Shipments of LCD TV in China, 2008-2018
Global Market Size of Integrated Circuit, 2011-2023E
Market Size of Integrated Circuit in China, 2014-2023E
Application of Graphene in Polyester-based Composites
Net Income of Northern Graphite, 2010-2018
Revenue and Net Income of CVD, 2010-2018
Revenue Structure of CVD by Business, 2013-2018
Net Loss of Focus Graphite, FY2010-FY2017
Operating Costs of Lomiko Metals, 2010-2018
3D Graphite Patents of Lomiko Metals
Lomiko Metals’ Development of Graphite, 2015
Development of Graphene ESD
Distribution of Graphene Industrial Park of Lomiko Metals
Revenue and Net Income of Applied Graphene Materials, FY2011-FY2018
Business Strategy of Applied Graphene Materials
Customers of Applied Graphene Materials
Market Opportunities of Applied Graphene Materials
Global Footprint of Graphene NanoChem Plc
Revenue and Net Income of Graphene NanoChem Plc, 2011-2017
Revenue and Net Income of Haydale, FY2011-FY2018
Operating Revenue Structure of Haydale by Region, FY2014-FY2017
Investment Highlights of Graphene 3D Lab
Development Planning of Graphene 3D Lab
Major Customers of Graphene Square
Revenue and Net Income of The Sixth Element, 2012-2018
Revenue of The Sixth Element by Product, 2014-2017
Top 5 Customers of The Sixth Element, 2017
Top 5 Suppliers of The Sixth Element, 2017
Development History of Graphene Business of The Sixth Element
Graphene Products and Their Application of The Sixth Element
Revenue and Net Income of 2D Carbon, 2013-2018
Revenue Structure of 2D Carbon by Product, 2016-2017
R&D Costs and % of Total Revenue of 2D Carbon, 2013-2018
Transparent Graphene Film Capacity and Sales Value of 2D Carbon, 2013-2017
Data on PET-based Graphene Product of 2D Carbon
Net income of Beijing Moxi Holding Group, 2014-2017
Number of Graphene Patents of Ningbo Morsh, 2013-2017
Main Graphene Products of Ningbo Morsh Technology
Main Graphene Products of Chongqing Graphene Tech.
Number of Graphene Patents of Chongqing Graphene, 2013-2017
Capacity of Fangda Carbon by Product, 2015
Revenue and Net Income of Fangda Carbon, 2010-2017
Revenue Structure of Fangda Carbon by Product, 2010-2017
Revenue Structure of Fangda Carbon by Region, 2010-2017
Gross Margin of Fangda Carbon by Product, 2009-2017
R&D Costs and % of Total Revenue of Fangda Carbon, 2011-2018
Revenue and Net Income of Der Future, 2012-2018
Revenue Structure of Der Future by Product, 2016-2018
Revenue Structure of Der Future by Region, 2014-2018
Gross Margin of Der Future, 2011-2018
R&D Costs and % of Total Revenue of Der Future, 2013-2018
Proposed/On-going Projects of Der Future, 2017
Graphene Business Development History of Der Future
Revenue and Net Income of Kangdexin, 2010-2018
Revenue Structure of Kangdexin by Product, 2013-2018
Revenue Structure of Kangdexin by Region, 2010-2018
Gross Margin of Kangdexin, 2011-2018
R&D Costs and % of Total Revenue of Kangdexin, 2011-2018
Main Products and Their Specifications of Knano Graphene
Revenue and Net Income of Knano Graphene, 2012-2018
Revenue Structure of Knano Graphene by Product, 2016-2017
Main Graphene Patents of Knano Graphene
Graphene Capacity of Knano Graphene, 2018
Graphene Series Products and Their Specifications of XFNANO
Main Graphene Products of JCNANO Tech
Main Graphene Products of Plannano
Graphene Industry Development History of Dongxu Optoelectronic
Revenue and Net Income of Huagao Graphene, 2014-2018
Revenue Structure of HuagaoGraphene by Product, 2016-2017
New Material Business Revenue of Shengquan Group, 2014-2018
Revenue and Net Income of Qingdao Haoxin New Energy Technology, 2015-2018
Global and China Optical Fiber Preform Industry Report, 2021-2026
Optical fiber preforms play a key role in the optical fiber communication industry chain. The global construction of 4G and FTTH requires less optical fiber and cable, which has dragged down the deman...
Global and China Photoresist Industry Report, 2021-2026
Since its invention in 1959, photoresist has been the most crucial process material for the semiconductor industry. Photoresist was improved as a key material used in the manufacturing process of prin...
Global and China Needle Coke Industry Report, 2021-2026
Needle coke is an important carbon material, featuring a low thermal expansion coefficient, a low electrical resistivity, and strong thermal shock resistance and oxidation resistance. It is suitable f...
Global and China 3D Glass Industry Report, 2021-2026
3D curved glass is light and thin, transparent and clean, anti-fingerprint, anti-glare, hard and scratch-resistant, and performs well in weather resistance. It is applicable to terminals such as high-...
Global and China Graphene Industry Report, 2020-2026
Graphene, a kind of 2D carbon nanomaterial, features excellent properties such as mechanical property and super electrical conductivity and thermal conductivity. Its downstream application ranges from...
Global and China Optical Fiber Preform Industry Report, 2020-2026
Optical fiber preform as a hi-tech product and a crucial link in the optical fiber industry chain contributes to 70% or so of profit margin. Global 4G and FTTH construction at dusk leads to the shrink...
Global and China 3D Glass Industry Report, 2020-2026
Global 3D glass market has been enlarging over the recent years amid demetallization of smartphone back covers and popularity of smart wearables, to approximately $2.86 billion in 2019 and to an estim...
Global and China Photoresist Industry Report, 2020-2026
In 2019, global photoresist market was valued at $8.3 billion, growing at a compound annual rate of 5.1% or so since 2010, and it will outnumber $12.7 billion in 2026 with advances in electronic techn...
Global and China Synthetic Diamond Industry Report, 2020-2026
While its mechanical property is given full play in fields like grinding and cutting, diamond with acoustic, optical, magnetic, thermal and other special properties, as superconducting material, intel...
Global and China Needle Coke Industry Report, 2020-2026
With the merits like small resistivity, excellent resistance to impact and good anti-oxidation property, needle coke has been widely used in ultra-high power graphite electrodes, nuclear reactor decel...
Global and China Optical Fiber Preform Industry Report, 2019-2025
Optical fiber preform, playing an important role in the optical fiber and cable industry chain, seizes about 70% profits of optical fiber. Global demand for optical fiber preform stood at 16.2kt in 20...
China Silicon Carbide Industry Report, 2019-2025
Silicon carbide (SiC) is the most mature and the most widely used among third-generation wide band gap semiconductor materials. Over the past two years, global SiC market capacity, however, hovered ar...
Global and China Photoresist Industry Report, 2019-2025
Photoresist, a sort of material indispensable to PCB, flat panel display, optoelectronic devices, among others, keeps expanding in market size amid the robust demand from downstream sectors. In 2018, ...
Global and China Graphene Industry Report, 2019-2025
Graphene is featured with excellent performance and enjoys a rosy prospect. The global graphene market was worth more than $100 million in 2018, with an anticipated CAGR of virtually 45% between 2019 ...
Global and China 3D Glass Industry Chain Report, 2019-2025
The evolution of AMOLED conduces to the steady development of 3D curved glass market. In 2018, the global 3D glass market expanded 37.7% on an annualized basis and reached $1.9 billion, a figure proje...
China Wood Flooring Industry Report, 2019-2025
With the better standard of living and the people’s desire for an elegant life, wood flooring sees a rising share in the flooring industry of China, up from 33.9% in 2009 to 38.9% in 2018, just behind...
Global and China Photovoltaic Glass Industry Report, 2019-2025
In China, PV installed capacity has ramped up since the issuance of photovoltaic (PV) subsidy policies, reaching 53GW in 2017, or over 50% of global total. However, the domestic PV demand was hit by t...
Global and China ITO Targets Industry Chain Report, 2019-2025
Featured by good electrical conductivity and transparency, ITO targets are widely applied to fields of LCD, flat-panel display, plasma display, touch screen, electronic paper, OLED, solar cell, antist...