Global and China MO Source Industry Report, 2019-2025
-
Mar.2019
- Hard Copy
- USD
$2,800
-
- Pages:95
- Single User License
(PDF Unprintable)
- USD
$2,600
-
- Code:
ZHP087
- Enterprise-wide License
(PDF Printable & Editable)
- USD
$3,900
-
- Hard Copy + Single User License
- USD
$3,000
-
MO source is a key raw material for metal-organic chemical vapor deposition (MOCVD) process. Global MO source output ranged at 102.6 tons in 2018, a rise of roughly 4.6% from a year earlier, a figure projected to outnumber 150 tons in 2025. China as the world’s largest producer of MO source manufactured 44.3 tons or over 40% of the global total in 2018.
MO source industry during 2018-2019 is featured as follows:
Demand: the incremental market demand for MO source is on the wane as LED gets increasingly prevalent; the China-US trade tension which hurts LED industry (over 80% MO source gets used), led to the slowing of global and Chinese demand for MO source in 2018. China demanded approximately 36.9 tons of MO source in 2018, up by 5.1% from the year before, and a year-on-year decrease of 9.2 percentage points.
LED’s demand for MO source will continue to rise in the near future along with the burgeoning markets such as micro LED display, mini LED backlighting, UV-C LED, automotive lighting, and LED lighting with high luminous efficacy. Yet, the wider application of MO source in solar cells, semiconductor lasers and so forth will tend to drag down the demand from LED field.
Price: trimethyl gallium currently consumes a whopping 80% of MO source in the Chinese market so that MO source price is to a great extent affected by gallium metal price. The pickup in gallium metal price from less than RMB1,000/kg in 2017 to RMB1,500/kg in 2018 pushed up trimethyl gallium price to around RMB8,600/kg in 2018.
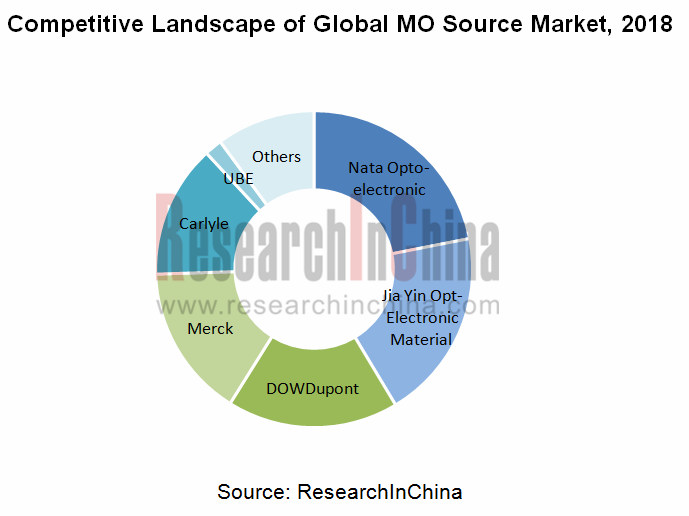
Competitive landscape: As a kind of strategic materials, the MO source market is highly concentrated and firmly held by Chinese, South Korean, American, European and Japanese manufacturers. In the past two years, mergers and acquisitions among global MO source manufacturers occured frequently, such as the merger of Dow and DuPont, the acquisition of Akzo Nobel by Carlyle, and the acquisition of Chemtura by LANXESS.
Global MO source market was an oligopoly in 2018, with the CR5 being above 85%, of which Nata Opto-electronic occupied the first place with a market share of over 20%.
The report highlights the following:
 Definition, classification, industry chain, industry characteristics, etc. of MO source;
Overview, supply, demand, market structure, etc. of global MO source;
Development environment, supply, demand, competitive landscape, market price, etc. of China’s MO source industry;
Market size and prices of MO source upstream sectors (gallium, indium, etc.); market size, competitive landscape, etc. of downstream sectors (LED, solar cells, semiconductor lasers, etc.);
Operation, MO source business, etc. of 7 foreign and 5 Chinese MO source producers.
1. Overview of MO Source Industry
1.1 Introduction
1.2 Classification and Application
1.3 Industry Chain
1.4 Industry Characteristics
1.4.1 High Concentration
1.4.2 Slowing Growth
2. Development of Global MO Source Industry
2.1 Overview
2.2 Supply
2.3 Demand
2.3.1 Quantity Demanded
2.3.2 Demand Structure
2.3.3 Factors Influencing Demand
2.4 Market Pattern
2.4.1 United States
2.4.2 Taiwan
2.4.3 South Korea
2.4.4 Europe
2.4.5 Japan
3. Development of MO Source Industry in China
3.1 Development Environment
3.1.1 Policy
3.1.2 Trading
3.1.3 Technology
3.2 Supply
3.2.1 Capacity
3.2.2 Market Structure
3.3 Demand
3.4 Price Trend
4. MO Source Industry Chain
4.1 Upstream Sectors
4.1.1 Gallium
4.1.2 Indium
4.2 Downstream LED Industry
4.2.1 LED
4.2.2 MOCVD and LED Chip
4.2.3 LED Packaging
4.2.4 LED Application
4.2.5 Competitive Landscape
4.3 Other Downstream Sectors
4.3.1 New Solar Cell
4.3.2 Phase Change Memory
4.3.3 Semiconductor Laser
4.3.4 RFIC Chip
5. Key Enterprises Worldwide
5.1 DowDuPont
5.1.1 Profile
5.1.2 Operation
5.1.3 MO Source Business
5.1.4 Business in China
5.2 Merck
5.2.1 Profile
5.2.2 Operation
5.2.3 MO Source Business-SAFC Hitech
5.2.4 Business in China
5.3 Sumitomo Chemical
5.3.1 Profile
5.3.2 Operation
5.3.3 MO Source Business
5.3.4 Business in China
5.4 Lanxess
5.4.1 Profile
5.4.2 Operation
5.4.3 MO Source Business
5.4.4 Business in China
5.5 Lake LED Materials
5.5.1 Profile
5.5.2 MO Source Business
5.6 UBE
5.6.1 Profile
5.6.2 Operation
5.6.3 MO Source Business
5.7 Carlyle
5.8 Nata Opto-electronic
5.8.1 Profile
5.8.2 Operation
5.8.3 Production and Sales
5.8.4 Key Projects
5.9 Jia Yin Opt-Electronic Material
5.10 Suzhou Puyao Optoelectronic Material Co., Ltd.
5.11 ARGOSUN MO
5.12 Dalian F.T.Z CREDIT Chemical Technology Development Co., Ltd.
Applications of MO Source
Industrial Chain of MO Source
Proportion of MO Source in LED Production Process
Global MO Source Supply, 2016-2025E
Demand of MOCVD Standalone for MO Source
Global MO Source Demand, 2010-2025E
Global MO Source Demand Structure by Sector, 2010-2025E
Global LED Backlight Penetration Rate by Field
Global Micro LED Display, 2018/2025E
Global Mini LED Market Size, 2018/2025E
Number of Newly Added MOCVD Machines and Ownership Worldwide, 2016-2025E
Global MOCVD Ownership Structure by Region, 2018
Global MO Source Capacity Structure by Region, 2018
Competitive Landscape of Global MO Source Market, 2018
Output Value of Taiwan IC Design Industry, 2016-2019
Number of Newly Added MOCVD Machines in Taiwan, 2009-2019
Major Vendors in South Korean LED Industry
Number of Newly Added MOCVD Machines in South Korea, 2009-2019
Production Bases and Major Customers of MO Source in Japan
Distribution of Japanese LED Industry
Policies about MO Source Industry in China, 2011-2019
Evolution of MO Source Technology in China
Capacity of MO Source in China, 2010-2025E
Capacity Structure of MO Source in China by Product, 2018/2025E
Competitive Landscape of Chinese MO Source Companies, 2018
MOCVD Procurement of China's Local Governments, 2010-2015
Demand for MO Source in China, 2010-2025E
Average Price of MO Source Products in China, 2009-2019
Distribution of Global Gallium Reserves
Global Metal Gallium Output (by Region), 2017-2018
Metal Gallium Output in China, 2014-2025E
Industrial Gallium Price Trend in China, 2017-2019
Global Indium Output, 2017-2018
Output and Sales Volume of Indium in China, 2009-2019
Global Indium Consumption Structure, 2018
Indium Consumption Structure in China, 2018
Refined Indium Import and Export in China, 2011-2018
China's Indium Export Volume (by Region), 2017
Indium Price Trend in China, 2018-2019
LED Industry Chain
Driving Factors of LED Industry
Total Output Value and Growth Rate of Global LED Industry, 2016-2025E
Total Output Value and Growth Rate of China's LED Industry, 2016-2025E
LED Application Structure in China, 2018
Major M & A Cases in the LED Industry, 2018
Global MOCVD Market Size, 2018/2025E
Ownership and Growth Rate of MOCVD Machines in China, 2010-2025E
MOCVD Capacity Utilization and Operating Rate in China, 2012-2018
Competitive Landscape of Global MOCVD Market, 2018
Equipment Distribution of MOCVD Enterprises in China by Quantity, 2018
Output Value and Growth Rate of LED Epitaxial Chips in China, 2010-2025E
Capacity of Major LED Chip Vendors in China, 2018
Output Value and Growth Rate of China's LED Packaging Industry, 2015-2025E
Competitive Landscape of China LED Packaging Market, 2018
Output Value and Growth Rate of China's LED Application Industry, 2016-2025E
LED Display Application Output Value in China, 2016-2025E
LED Backlight Application Output Value in China, 2016-2025E
LED Lighting Application Output Value in China, 2015-2025E
Business of Key LED Companies in China
Classification of Solar Photovoltaic Cells
Performance Comparison between Thin-film Batteries and Crystalline Silicon Batteries
Global Solar Cell Output and Growth Rate, 2010-2025E
Global Solar Cell Output Structure by Product, 2010-2025E
Capacity of Global Major Thin-film Solar Cell Vendors, 2018
Solar Cell Output and Growth Rate in China, 2011-2025E
Solar Cell Output Structure in China by Region, 2018
Capacity of Major Solar Cell Vendors in China, 2018
PERC Capacity of Major Photovoltaic Cell Manufacturers in China, 2018
Performance Comparison of Different Types of Solar Cells
Output of GaAs Solar Cell in China, 2010/2015/2020
Memory Development Process
Global Laser Revenue by Product, 2012-2019
Output Value of Semiconductor Lasers in China, 2010-2019
Unit Price of Mobile Phone RF Modules
Sales and Net Income of DowDuPont, 2017-2018
Revenue Structure of DowPont by Business, 2018
Revenue Structure of DowPont by Region, 2018
Main Business of DuPont Electronics & Imaging
Production Bases of DuPont Electronics & Imaging
Revenue of DowDuPont Specialty Products by Business, 2017
Sales and Net Income of Merck, 2014-2018
Revenue Structure of Merck by Business, 2016-2018
Revenue Structure of Merck by Region, 2018
Profile of MilliporeSigma
MO Source Production Bases of MilliporeSigma
Revenue and Net Income of Sumitomo Chemical, FY2011- FY2018
Revenue of Sumitomo Chemical by Region, FY2017
Revenue of Sumitomo Chemical by Business, FY2015-FY2017
Main Products of IT-related Chemicals Business
Development Course of Sumitomo Chemical Advanced Technologies
Production Base Distribution of Sumitomo Chemical Advanced Technologies
Branch Companies of Sumitomo Chemical and Their Primary Business
Global Layout of LANXESS
Main Business of LANXESS
Sales and Net Income of LANXESS, 2013-2018
Revenue of LANXESS by Business, 2016-2017
Revenue of LANXESS by Region, 2017
Main Business of Lake LED Materials
Main MO Source Products of Lake LED Materials
Major Affiliates of Ube Industries
Revenue and Operating Income of Ube Industries, FY2011-FY2018
Revenue of Ube Industries by Business, FY2016-FY2018
Revenue of Ube Industries by Region, FY2017
Main MO Source Products of Ube Industries
MO Source Applications of Ube Industries
Major Brands of AKZO Nobel’s Functional Chemicals
Production Bases of Functional Chemical Products of AKZO Nobel in China
Equity Structure of Nata Opto-electronic, 2018
Revenue and Net Income of Nata Opto-electronic, 2009-2018
Revenue of Nata Opto-electronic by Product, 2009-2018
Revenue of Nata Opto-electronic by Region, 2009-2018
Gross Margin of Nata Opto-electronic by Product, 2009-2018
Capacity and Output of Nata Opto-electronic’s Main Products, 2016-2018
Key Projects of Nata Opto-electronic, 2019
Capacity of Nata Opto-electronic, 2010-2018
Output of Jia Yin Opt-Electronic Material’s Main Products, 2018
Global and China Optical Fiber Preform Industry Report, 2021-2026
Optical fiber preforms play a key role in the optical fiber communication industry chain. The global construction of 4G and FTTH requires less optical fiber and cable, which has dragged down the deman...
Global and China Photoresist Industry Report, 2021-2026
Since its invention in 1959, photoresist has been the most crucial process material for the semiconductor industry. Photoresist was improved as a key material used in the manufacturing process of prin...
Global and China Needle Coke Industry Report, 2021-2026
Needle coke is an important carbon material, featuring a low thermal expansion coefficient, a low electrical resistivity, and strong thermal shock resistance and oxidation resistance. It is suitable f...
Global and China 3D Glass Industry Report, 2021-2026
3D curved glass is light and thin, transparent and clean, anti-fingerprint, anti-glare, hard and scratch-resistant, and performs well in weather resistance. It is applicable to terminals such as high-...
Global and China Graphene Industry Report, 2020-2026
Graphene, a kind of 2D carbon nanomaterial, features excellent properties such as mechanical property and super electrical conductivity and thermal conductivity. Its downstream application ranges from...
Global and China Optical Fiber Preform Industry Report, 2020-2026
Optical fiber preform as a hi-tech product and a crucial link in the optical fiber industry chain contributes to 70% or so of profit margin. Global 4G and FTTH construction at dusk leads to the shrink...
Global and China 3D Glass Industry Report, 2020-2026
Global 3D glass market has been enlarging over the recent years amid demetallization of smartphone back covers and popularity of smart wearables, to approximately $2.86 billion in 2019 and to an estim...
Global and China Photoresist Industry Report, 2020-2026
In 2019, global photoresist market was valued at $8.3 billion, growing at a compound annual rate of 5.1% or so since 2010, and it will outnumber $12.7 billion in 2026 with advances in electronic techn...
Global and China Synthetic Diamond Industry Report, 2020-2026
While its mechanical property is given full play in fields like grinding and cutting, diamond with acoustic, optical, magnetic, thermal and other special properties, as superconducting material, intel...
Global and China Needle Coke Industry Report, 2020-2026
With the merits like small resistivity, excellent resistance to impact and good anti-oxidation property, needle coke has been widely used in ultra-high power graphite electrodes, nuclear reactor decel...
Global and China Optical Fiber Preform Industry Report, 2019-2025
Optical fiber preform, playing an important role in the optical fiber and cable industry chain, seizes about 70% profits of optical fiber. Global demand for optical fiber preform stood at 16.2kt in 20...
China Silicon Carbide Industry Report, 2019-2025
Silicon carbide (SiC) is the most mature and the most widely used among third-generation wide band gap semiconductor materials. Over the past two years, global SiC market capacity, however, hovered ar...
Global and China Photoresist Industry Report, 2019-2025
Photoresist, a sort of material indispensable to PCB, flat panel display, optoelectronic devices, among others, keeps expanding in market size amid the robust demand from downstream sectors. In 2018, ...
Global and China Graphene Industry Report, 2019-2025
Graphene is featured with excellent performance and enjoys a rosy prospect. The global graphene market was worth more than $100 million in 2018, with an anticipated CAGR of virtually 45% between 2019 ...
Global and China 3D Glass Industry Chain Report, 2019-2025
The evolution of AMOLED conduces to the steady development of 3D curved glass market. In 2018, the global 3D glass market expanded 37.7% on an annualized basis and reached $1.9 billion, a figure proje...
China Wood Flooring Industry Report, 2019-2025
With the better standard of living and the people’s desire for an elegant life, wood flooring sees a rising share in the flooring industry of China, up from 33.9% in 2009 to 38.9% in 2018, just behind...
Global and China Photovoltaic Glass Industry Report, 2019-2025
In China, PV installed capacity has ramped up since the issuance of photovoltaic (PV) subsidy policies, reaching 53GW in 2017, or over 50% of global total. However, the domestic PV demand was hit by t...
Global and China ITO Targets Industry Chain Report, 2019-2025
Featured by good electrical conductivity and transparency, ITO targets are widely applied to fields of LCD, flat-panel display, plasma display, touch screen, electronic paper, OLED, solar cell, antist...