China Commercial Vehicle Industry Report, 2015-2018
-
Dec.2015
- Hard Copy
- USD
$2,400
-
- Pages:106
- Single User License
(PDF Unprintable)
- USD
$2,200
-
- Code:
ZLC027
- Enterprise-wide License
(PDF Printable & Editable)
- USD
$3,500
-
- Hard Copy + Single User License
- USD
$2,600
-
In 2010-2014, the sales volume of commercial vehicles in China fell from 4.3041 million units to 4.055 million units, seeing a share in total automobile sales down from 23.8% to 19.7%. During Jan.-Sept. 2015, the sales volume of commercial vehicles totaled 2.5087 million units, accounting for 14.7% of total auto sales. It is estimated that the full-year sales figure in 2015 will approximate 3.6 million units.
In terms of models, the truck sales occupied a higher portion, at around 65%; despite a low percentage of roughly 10%, the sales volume of buses embraced a rising proportion. In the first nine months of 2015, the sales volume of trucks and buses in China came to 1.6499 million units and 367,600 units, respectively, holding 65.8% and 14.7%.
In Jan.-Sept. 2015, China, a big exporter of commercial vehicle, exported 257,100 commercial vehicles, a figure that made up 43.1% of total auto exports. Among them, the export volume of buses and trucks totaled 195,300 units and 45,800 units, respectively. The commercial vehicles are mainly sold to the Asian and African counties such as Vietnam, Algeria, and Myanmar.
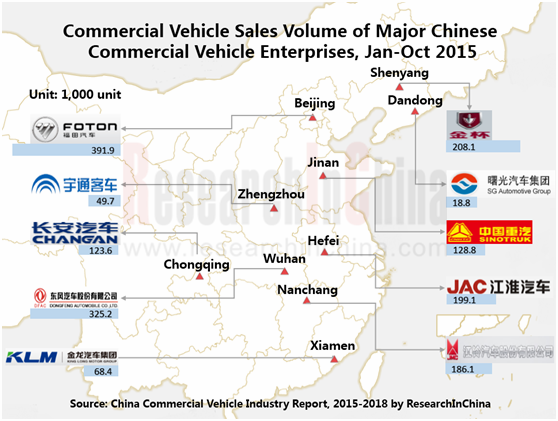
At present, there are a total of 74 auto makers that sell commercial vehicles, which formed a highly competitive market. Among them, Beiqi Foton, Dongfeng Motor, Jinbei Automotive, JAC, JMC, Yutong Bus, and King Long Motor enjoy higher competitiveness in a relative sense.
Beiqi Foton is China’s largest commercial vehicle enterprise that has the most extensive models. In 2014, the company sold 547,900 commercial vehicles, occupying 14.5% (ranking No.1) of total sales in China. In the past two years, the company has lavished more funds into development and release of new energy commercial vehicles. In 2014, Foton launched AUV series battery vehicle products, Aoling CNG light-duty trucks, and the world’s first LNG power-pump vehicle, etc., with the full-year sales volume of 11,964 new energy vehicles (including natural gas-powered ones).
?
In 2014, Dongfeng Motor sold 500,200 commercial vehicles, representing 13.2% of total sales, which enabled the company to rank second. Since 2005, the company has started the development of new energy vehicle products, a move that made the company the first to achieve the commercialization of new energy vehicles. The products cover many market segments including public transportation, highway, city logistics, sanitation, and special-purpose vehicles. In Jun.-Nov. 2015, the company signed orders of an aggregate 17,000 new energy vehicles with 5 companies -- Shanghai Beidou Neo-Energy Co., Ltd., Zhejiang SKIO Matrix Co., Ltd, Kunshan Guangdeyuan EV Leasing, Zhejiang Zhongdian Automobile, and SinoEV Tech.
?
King Long Motor is mainly engaged in the manufacturing and sales of large, medium and light-duty buses. In 2014, the company sold 24,385 large-sized buses and 15,417 medium-sized buses, making up 29.9% and 24.6%, respectively, in both of which the company ranked second. Meanwhile, the company was the first in China to massively export European Ⅵ high-end models. Additionally, the company released a series of plug-in hybrid electric vehicles and battery electric new energy buses. In 2014, the sales volume of new energy buses reached 3,431 units, and this figure went up to 4,150 units in the first half of 2015.
As the national IV emission standard is phased in nationwide, China's commercial vehicle market is facing structural adjustment. And the release of Made in China 2025 indicates that the State will step up the support for intelligent vehicles and energy-saving and new energy vehicles, which would provide a good development opportunity to traditional commercial vehicle enterprises. At present, Beiqi Foton, Dongfeng Motor, JAC, Yutong Bus, King Long Motor and other commercial vehicle makers have been dedicated to developing and upgrading new energy automotive technologies and launching the products, basically occupying China's new energy commercial vehicle market.
China Commercial Vehicle Industry Report, 2015-2018 highlights the followings:
?
 Overview of commercial vehicle industry, including definition, classification, and related policies;
Development of China’s commercial vehicle industry, including status quo of automobile industry, output and sales volume of commercial vehicles, and forecast and outlook, etc.;
Import and export of commercial vehicles in China;
Industry competition of commercial vehicles, including market concentration, competitive landscape, etc.;
Operation, capacity, production and sales, R&D and investment, etc. of 10 Chinese commercial vehicle-related companies.
1. Overview
1.1 Definition and Classification
1.2 Related Policies
2. Development of China Commercial Vehicle Industry
2.1 Status Quo of Auto Industry
2.2 Output of Commercial Vehicle
2.2.1 Total Output
2.2.2 Truck
2.2.3 Bus
2.3 Sales Volume of Commercial Vehicle
2.3.1 Total Sales Volume
2.3.2 Truck
2.3.3 Bus
2.4 Predictions and Outlook
3. Import and Export of China Commercial Vehicle Industry
3.1 Import
3.2 Export
4. Competition of China Commercial Vehicle Industry
4.1 Concept and Measurement of Market Concentration
4.2 Market Concentration of Commercial Vehicle
4.2.1 Truck
4.2.2 Bus
4.3 Competition Pattern
5. Key Companies
5.1 Beiqi Foton Motor Co., Ltd.
5.1.1 Profile
5.1.2 Operation
5.1.3 Revenue Structure
5.1.4 Gross Margin
5.1.5 Capacity
5.1.6 Production and Sales
5.1.7 R&D and Investment
5.1.8 Predictions and Outlook
5.2 Dongfeng Motor Corporation
5.2.1 Profile
5.2.2 Operation
5.2.3 Revenue Structure
5.2.4 Gross Margin
5.2.5 Capacity
5.2.6 Production and Sales
5.2.7 R&D and Investment
5.2.8 Predictions and Outlook
5.3 Shenyang Jinbei Automotive Company Limited
5.3.1 Profile
5.3.2 Operation
5.3.3 Revenue Structure
5.3.4 Production and Sales
5.3.5 Predictions and Outlook
5.4 Anhui Jianghuai Automobile Co., Ltd.
5.4.1 Profile
5.4.2 Operation
5.4.3 Revenue Structure
5.4.4 Production and Sales
5.4.5 R&D and Investment
5.4.6 Predictions and Outlook
5.5 Chongqing Changan Automobile Company Limited
5.5.1 Profile
5.5.2 Operation
5.5.3 Revenue Structure
5.5.4 Capacity
5.5.5 Production and Sales
5.5.6 R&D and Investment
5.5.7 Predictions and Outlook
5.6 Jiangling Motors Corporation, Ltd.
5.6.1 Profile
5.6.2 Operation
5.6.3 Revenue Structure
5.6.4 Capacity
5.6.5 Production and Sales
5.6.6 R&D and Investment
5.6.7 Predictions and Outlook
5.7 Xiamen King Long Motor Group Co., Ltd.
5.7.1 Profile
5.7.2 Operation
5.7.3 Revenue Structure
5.7.4 Production and Sales
5.7.5 R&D and Investment
5.7.6 Predictions and Outlook
5.8 China National Heavy Duty Truck Group Co., Ltd. (SINOTRUK)
5.8.1 Profile
5.8.2 Operation
5.8.3 Revenue Structure
5.8.4 Production and Sales
5.8.5 R&D and Investment
5.8.6 Predictions and Outlook
5.9 Liaoning SG Automotive Group Co., Ltd.
5.9.1 Profile
5.9.2 Operation
5.9.3 Revenue Structure
5.9.4 Production and Sales
5.9.5 R&D and Investment
5.9.6 Predictions and Outlook
5.10 Zhengzhou Yutong Bus Co., Ltd.
5.10.1 Profile
5.10.2 Operation
5.10.3 Revenue Structure
5.10.4 Production and Sales
5.10.5 R&D and Investment
5.10.6 Predictions and Outlook
Chinese Classification Criterion for Commercial Vehicle
Output of Vehicles and YoY Growth in China, 2009-2015
Sales Volume of Vehicles and YoY Growth in China, 2009-2015
Output of Commercial Vehicles in China, 2009-2014
Output of Commercial Vehicles in China by Type, 2009-2015
Output Proportion of Commercial Vehicles in China by Type, 2009-2015
Output of Commercial Vehicles in China by Model, 2009-2015
Output Proportion of Commercial Vehicles in China by Model, 2009-2015
Output of Trucks in China by Type, 2009-2015
Output Proportion of Trucks in China by Type, 2009-2015
Output of Buses in China by Type, 2009-2015
Output Proportion of Buses in China by Type, 2009-2015
Sales Volume of Commercial Vehicles in China, 2009-2014
Sales Volume of Commercial Vehicles in China by Type, 2009-2015
Sales Volume Proportion of Commercial Vehicles in China by Type, 2009-2015
Sales Volume of Commercial Vehicles in China by Model, 2009-2015
Sales Volume Proportion of Commercial Vehicles in China by Model, 2009-2015
Sales Volume of Trucks in China by Type, 2009-2015
Sales Volume Proportion of Trucks in China by Type, 2009-2015
Sales Volume of Buses in China by Type, 2009-2015,
Sales Volume Proportion of Buses in China by Type, 2009-2015
Sales Volume of Commercial Vehicles and Sales Volume Proportion of New Energy Commercial Vehicles in China, 2014-2018E
Import Volume and Value of Vehicles in China, 2010-2015
Import Volume and Value of Commercial Vehicles in China, 2010-2015
Import Volume of Buses and Trucks in China, 2010-2015
Import Volume Proportion of Buses and Trucks in China, 2010-2015
Top 10 Import Origins of China’s Commercial Vehicles by Import Volume, Jan.-Aug. 2015
Import Volume and Value of Commercial Vehicles in China by Region, Jan.-Aug. 2015
Import Volume of Buses and Trucks in China by Region, Jan.-Aug. 2015
Export Volume and Value of Vehicles in China, 2010-2015
Export Volume and Value of Commercial Vehicles in China, 2010-2015
Export Volume of Buses and Trucks in China, 2010-2015
Export Volume Proportion of Buses and Trucks in China, 2015
Top 10 Export Destinations of China-made Commercial Vehicles by Export Volume, Jan.-Aug. 2015
Export Volume and Value of Vehicles in China by Region, Jan.-Aug. 2015
Export Volume of Buses and Trucks in China by Region, Jan.-Aug. 2015
Top 10 Commercial Vehicle Enterprises in China by Sales Volume, 2014
Top 10 Commercial Vehicle Manufacturers in China by Output, 2014
Top 10 Heavy-duty Truck Enterprises in China by Sales Volume, 2014
Top 10 Heavy-duty Truck Enterprises in China by Output, 2014
Top 10 Medium-duty Truck Enterprises in China by Sales Volume, 2014
Top 10 Medium-duty Truck Enterprises in China by Output, 2014
Top 10 Light-duty Truck Enterprises in China by Sales Volume, 2014
Top 10 Light-duty Truck Enterprises in China by Output, 2014
Top 10 Mini Truck Enterprises in China by Sales Volume, 2014
Top 10 Mini Truck Enterprises in China by Output, 2014
Top 10 Large-sized Bus Enterprises in China by Sales Volume, 2014
Top 10 Large-sized Bus Enterprises in China by Output, 2014
Top 10 Medium-sized Bus Enterprises in China by Sales Volume, 2014
Top 10 Medium-sized Bus Enterprises in China by Output, 2014
Top 10 Light-duty Bus Enterprises in China by Sales Volume, 2014
Top 10 Light-duty Bus Enterprises in China by Output, 2014
Sales Volume of Trucks and Buses of Major Enterprises in Commercial Vehicle Industry, 2014
Revenue of Major Enterprises in Commercial Vehicle Industry, 2011-2015
R&D Costs of Major Enterprises in Commercial Vehicle Industry, 2012-2015
Revenue and Net Income of Beiqi Foton, 2011-2015
Revenue of Beiqi Foton by Region, 2012-2015
Revenue Structure of Beiqi Foton by Region, 2012-2015
Revenue of Beiqi Foton by Product, 2012-2015
Revenue Structure of Beiqi Foton by Product, 2012-2015
Gross Margin of Beiqi Foton by Product, 2012-2015
Output of Beiqi Foton, 2015
Commercial Vehicle Sales Volume of Beiqi Foton by Type, 2012-2015
Beiqi Foton’s Revenue from Top 5 Customers and % of Total Revenue, 2012-2015
Vehicle Output and Sales Volume of Beiqi Foton by Type, 2014-2015
R&D Costs and % of Total Revenue of Beiqi Foton, 2012-2015
Revenue and Net Income of Beiqi Foton, 2014-2018E
Revenue and Net Income of Dongfeng Motor, 2011-2015
Revenue of Dongfeng Motor by Product, 2011-2015
Revenue Structure of Dongfeng Motor by Product, 2011-2015
Revenue of Dongfeng Motor by Region, 2012-2015
Revenue Structure of Dongfeng Motor by Region, 2012-2015
Gross Margin of Dongfeng Motor by Product, 20012-2015
Capacity of Dongfeng Motor, 2015
Output and Sales Volume of Dongfeng Motor, 2013-2014
Output and Sales Volume of Dongfeng Motor, 2014-2015
R&D Costs and % of Total Revenue of Dongfeng Motor, 2012-2015
Ongoing Projects of Dongfeng Motor as of 2015H1
Revenue and Net Income of Dongfeng Motor, 2014-2018E
Revenue and Net Income of Jinbei Automotive, 2011-2015
Revenue of Jinbei Automotive by Product, 2012-2015
Revenue of Jinbei Automotive by Region, 2012-2015
Revenue Structure of Jinbei Automotive by Region, 2012-2015
Output and Sales Volume of Jinbei Automotive, 2014-2015
Ongoing Projects of Jinbei Automotive as of 2015H1
Revenue and Net Income of Jinbei Automotive, 2014-2018E
Revenue and Net Income of JAC, 2011-2015
Revenue of JAC by Product, 2011-2015
Revenue Structure of JAC by Product, 2011-2015
Revenue of JAC by Region, 2011-2015
Revenue Structure of JAC by Region, 2011-2015
Output and Sales Volume of JAC, 2014-2015
R&D Costs and % of Total Revenue of JAC, 2012-2015
Ongoing Projects of JAC as of 2015H1
Investment Projects Funded by A-share Non-public Offering Plan of JAC, 2015
Revenue and Net Income of JAC, 2014-2018E
Revenue and Net Income of Changan Automobile, 2011-2015
Revenue of Changan Automobile by Business, 2012-2015
Capacity of Changan Automobile, 2015
Output and Sales Volume of Changan Automobile, 2014-2015
R&D Costs and % of Total Revenue of Changan Automobile, 2011-2015
Revenue and Net Income of Changan Automobile, 2014-2018E
Revenue and Net Income of JMC, 2011-2015
JMC’s Revenue from Top 5 Customers and % of Total Revenue, 2013-2014
Revenue of JMC by Product, 2012-2015
Revenue of JMC by Region, 2012-2015
Revenue Structure of JMC by Region, 2012-2015
Capacity of JMC, 2015
Output and Sales Volume of JMC, 2014-2015
R&D Costs and % of Total Revenue of JMC, 2012-2015
Non-Raised Capital's Projects of JMC, 2015
Revenue and Net Income of JMC, 2014-2018E
Revenue and Net Income of King Long Motor, 2011-2015
Revenue of King Long Motor by Region, 2011-2015
Revenue Structure of King Long Motor by Region, 2011-2015
Output and Sales Volume of King Long Motor, 2014-2015
R&D Costs and % of Total Revenue of King Long Motor, 2012-2015
Investment Projects Funded by A-share Non-public Offering Plan of King Long Motor, 2014
Revenue and Net Income of King Long Motor, 2014-2018E
Revenue and Net Income of SINOTRUK, 2011-2015
Revenue of SINOTRUK by Product, 2011-2015
Revenue Structure of SINOTRUK by Product, 2011-2015
R&D Costs and % of Total Revenue of SINOTRUK, 2012-2015
Revenue and Net Income of SINOTRUK, 2014-2018E
Revenue and Net Income of Liaoning SG, 2011-2015
Revenue of Liaoning SG by Product, 2012-2015
Revenue Structure of Liaoning SG by Product, 2012-2015
Revenue of Liaoning SG by Region, 2012-2015
Revenue Structure of Liaoning SG by Region, 2012-2015
Output and Sales Volume of Liaoning SG, 2014-2015
Subscription of Non-public Offering Plan of Liaoning SG, 2015
Investment Projects Funded by Non-public Offering Plan of Liaoning SG, 2015
Revenue and Net Income of Liaoning SG, 2014-2018E
Revenue and Net Income of Yutong Bus, 2011-2015
Revenue of Yutong Bus by Business, 2012-2015
Revenue Structure of Yutong Bus by Business, 2012-2015
Revenue of Yutong Bus by Region, 2012-2015
Revenue Structure of Yutong Bus by Region, 2012-2015
Output and Sales Volume of Yutong Bus, 2014-2015
R&D Costs and % of Total Revenue of Yutong Bus, 2012-2015
Non-Raised Capital's Projects of Yutong Bus, 2015
Non-public Offering of Yutong Bus, 2014
Revenue and Net Income of Yutong Bus, 2014-2018E
China Automotive Lighting and Ambient Lighting System Research Report, 2025
Automotive Lighting System Research: In 2025H1, Autonomous Driving System (ADS) Marker Lamps Saw an 11-Fold Year-on-Year Growth and the Installation Rate of Automotive LED Lighting Approached 90...
Ecological Domain and Automotive Hardware Expansion Research Report, 2025
ResearchInChina has released the Ecological Domain and Automotive Hardware Expansion Research Report, 2025, which delves into the application of various automotive extended hardware, supplier ecologic...
Automotive Seating Innovation Technology Trend Research Report, 2025
Automotive Seating Research: With Popularization of Comfort Functions, How to Properly "Stack Functions" for Seating?
This report studies the status quo of seating technologies and functions in aspe...
Research Report on Chinese Suppliers’ Overseas Layout of Intelligent Driving, 2025
Research on Overseas Layout of Intelligent Driving: There Are Multiple Challenges in Overseas Layout, and Light-Asset Cooperation with Foreign Suppliers Emerges as the Optimal Solution at Present
20...
High-Voltage Power Supply in New Energy Vehicle (BMS, BDU, Relay, Integrated Battery Box) Research Report, 2025
The high-voltage power supply system is a core component of new energy vehicles. The battery pack serves as the central energy source, with the capacity of power battery affecting the vehicle's range,...
Automotive Radio Frequency System-on-Chip (RF SoC) and Module Research Report, 2025
Automotive RF SoC Research: The Pace of Introducing "Nerve Endings" such as UWB, NTN Satellite Communication, NearLink, and WIFI into Intelligent Vehicles Quickens
RF SoC (Radio Frequency Syst...
Automotive Power Management ICs and Signal Chain Chips Industry Research Report, 2025
Analog chips are used to process continuous analog signals from the natural world, such as light, sound, electricity/magnetism, position/speed/acceleration, and temperature. They are mainly composed o...
Global and China Electronic Rearview Mirror Industry Report, 2025
Based on the installation location, electronic rearview mirrors can be divided into electronic interior rearview mirrors (i.e., streaming media rearview mirrors) and electronic exterior rearview mirro...
Intelligent Cockpit Tier 1 Supplier Research Report, 2025 (Chinese Companies)
Intelligent Cockpit Tier1 Suppliers Research: Emerging AI Cockpit Products Fuel Layout of Full-Scenario Cockpit Ecosystem
This report mainly analyzes the current layout, innovative products, and deve...
Next-generation Central and Zonal Communication Network Topology and Chip Industry Research Report, 2025
The automotive E/E architecture is evolving towards a "central computing + zonal control" architecture, where the central computing platform is responsible for high-computing-power tasks, and zonal co...
Vehicle-road-cloud Integration and C-V2X Industry Research Report, 2025
Vehicle-side C-V2X Application Scenarios: Transition from R16 to R17, Providing a Communication Base for High-level Autonomous Driving, with the C-V2X On-board Explosion Period Approaching
In 2024, t...
Intelligent Cockpit Patent Analysis Report, 2025
Patent Trend: Three Major Directions of Intelligent Cockpits in 2025
This report explores the development trends of cutting-edge intelligent cockpits from the perspective of patents. The research sco...
Smart Car Information Security (Cybersecurity and Data Security) Research Report, 2025
Research on Automotive Information Security: AI Fusion Intelligent Protection and Ecological Collaboration Ensure Cybersecurity and Data Security
At present, what are the security risks faced by inte...
New Energy Vehicle 800-1000V High-Voltage Architecture and Supply Chain Research Report, 2025
Research on 800-1000V Architecture: to be installed in over 7 million vehicles in 2030, marking the arrival of the era of full-domain high voltage and megawatt supercharging.
In 2025, the 800-1000V h...
Foreign Tier 1 ADAS Suppliers Industry Research Report 2025
Research on Overseas Tier 1 ADAS Suppliers: Three Paths for Foreign Enterprises to Transfer to NOA
Foreign Tier 1 ADAS suppliers are obviously lagging behind in the field of NOA.
In 2024, Aptiv (2.6...
VLA Large Model Applications in Automotive and Robotics Research Report, 2025
ResearchInChina releases "VLA Large Model Applications in Automotive and Robotics Research Report, 2025": The report summarizes and analyzes the technical origin, development stages, application cases...
OEMs’ Next-generation In-vehicle Infotainment (IVI) System Trends Report, 2025
ResearchInChina releases the "OEMs’ Next-generation In-vehicle Infotainment (IVI) System Trends Report, 2025", which sorts out iterative development context of mainstream automakers in terms of infota...
Autonomous Driving SoC Research Report, 2025
High-level intelligent driving penetration continues to increase, with large-scale upgrading of intelligent driving SoC in 2025
In 2024, the total sales volume of domestic passenger cars in China was...