China Aquaculture Industry Report, 2014-2017
-
July 2014
- Hard Copy
- USD
$2,600
-
- Pages:128
- Single User License
(PDF Unprintable)
- USD
$2,400
-
- Code:
QJC010
- Enterprise-wide License
(PDF Printable & Editable)
- USD
$3,800
-
- Hard Copy + Single User License
- USD
$2,800
-
China’s aquaculture crop maintained steady growth during 2007-2012, with that of Seawater Aquaculture products and freshwater aquaculture products recording a CAGR of about 4.7% and 6.1%, respectively. In 2013, China’s aquaculture crop saw a year on year rise of 5.9% and reached 45.4168 million tons. The middle and high-end products like abalone, sea cucumber, white shrimp and tilapia developed rapidly, wherein the crop of abalone and sea cucumber achieved a CAGR of above 10% each over the past five years. With advancement of aquaculture technologies and improvement of people’s consumption level, it is expected that China’s aquaculture area and crop will keep a rapid growth rate during 2014-2017.
Despite a net importer of aquatic products, China has a trade surplus, which has swelled rapidly since the year 2010, due to significantly higher average export price than average import price. In 2013, the import and export prices of aquatic products in China attained to USD 2,071/t and USD 5,118/t, respectively.
China’s aquaculture industry is mostly distributed in eastern riverside and coastal provinces, with main ones having developed their own unique products. Among them, Shandong is the most developed province in Seawater Aquaculture, with its Seawater Aquaculture crop amounting to 4.566 million tons in 2013, a year-on-year increase of 4.7% and ranking first as concerns the crop of marsupenaeus japonicus, mussel, sea cucumber, sea urchin and other products in the country. Hubei is the most developed province in freshwater aquaculture, with its freshwater aquaculture crop reaching 4.104 million tons in 2013, up 11.6% from a year earlier, and the crop of procambarus clarkii accounting for more than 50 % of the national total.
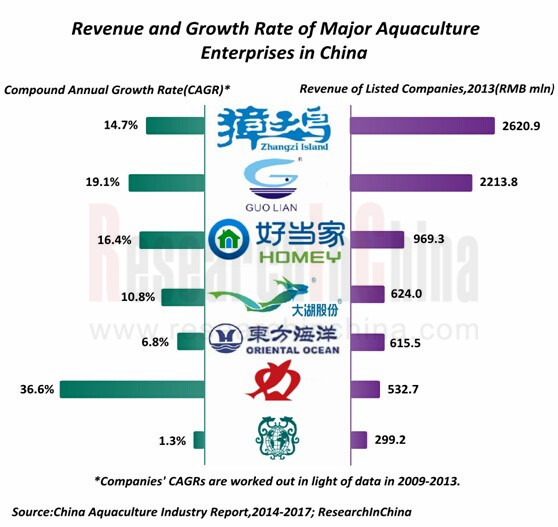
There are numerous practitioners in Chinese aquaculture industry, and most of them are self-employed farmers. However, the aquaculture companies, especially middle and high-end aquatic product farming ones, like Zhangzidao Group Co., Ltd., Dalian Yiqiao Marine Seeds Co., Ltd., Zhanjiang Guolian Aquatic Products Co., Ltd. and Shandong Homey Aquatic Development Co., Ltd. are leading the way in the market by virtue of their advantages in farming waters, brand building, marketing channel, etc.
Zhangzidao Group is a model that aggressively expands e-commerce channel in China’s aquaculture industry. On April 26, 2014, Zhangzidao Group and JD Group signed a strategic cooperation agreement to promote fresh seafood on JD’s online marketing platform. Later on July 7, Zhangzidao Group’s first e-commerce company- Zhangzidao Water World (Shanghai) Network Technology Co., Ltd. was established and opened.
Zhanjiang Guolian Aquatic Products Co., Ltd strengthens its brand construction through M&As overseas. In 2013, the company completed layout of marketing, logistics and service networks for its products in northern California, USA by integrating end consumer networks of SSC (which was purchased in 2012) in the United States. So far, apart from original three brands of SSC, the company has fostered three own brands, namely, “O’good”, “O’fresh” and “Icook”, thus breaking the limitation for product development brought about by the previous single OEM orders.
Boosted by aquaculture industry, the upstream and downstream sectors like aquatic feed, warehousing and logistics and aquatic products processing maintained growth as a whole except a decelerated aquatic drug sector during 2006-2013. It is expected that, during 2014-2017, aquatic feed penetration will improve steadily and drive a relatively rapid growth of aquatic feed industry. Meanwhile, China aquatic product processing industry will continue to rely on foreign markets.
China Aquaculture Industry Report, 2014-2017 by ResearchInChina focuses on the following:
 Policy environment, output, demand, import and export and competitive landscape of China aquaculture industry;
Output, product mix, means of breeding, upstream and downstream and development prospects of China’s aquaculture market;
Major regions and products of China aquaculture industry;
Operation of 15 Chinese aquaculture and processing companies.
1. Overview of Aquaculture Industry
1.1 Basic Concepts
1.2 Product Types
1.2.1 Regular Aquatic Products
1.2.2 Famous Products
1.2.3 Superior Products for Export
1.3 Industry Chain
2. Operating Environment of China Aquaculture Industry
2.1 Industry Policy
2.2 Industry Overview
2.3 Residents’ Consumption
2.4 Import and Export
2.5 Competitive Landscape
3. Analysis on China Aquaculture Industry
3.1 Seawater Aquaculture
3.1.1 Overview
3.1.2 Regional Structure
3.1.3 Product Mix
3.1.4 Farming Method
3.2 Freshwater Aquaculture
3.2.1 Overview
3.2.2 Regional Structure
3.2.3 Product Mix
3.2.4 Farming Method
3.3 Aquatic Seeds
3.3.1 Overview
3.3.2 Output
4 Key Aquaculture Regions in China
4.1 Fujian
4.1.1 Overview
4.1.2 Aquaculture
4.1.3 Farming Method
4.2 Jiangsu
4.2.1 Overview
4.2.2 Aquaculture
4.2.3 Farming Method
4.3 Shandong
4.3.1 Overview
4.3.2 Aquaculture
4.3.3 Farming Method
4.4 Liaoning
4.4.1 Overview
4.4.2 Aquaculture
4.4.3 Farming Method
4.5 Guangdong
4.5.1 Overview
4.5.2 Aquaculture
4.5.3 Farming Method
4.6 Zhejiang
4.6.1 Overview
4.6.2 Aquaculture
4.6.3 Farming Method
4.7 Hubei
4.7.1 Overview
4.7.2 Aquaculture
4.7.3 Farming Method
4.8 Hunan
4.8.1 Overview
4.8.2 Aquaculture
4.8.3 Farming Method
5 Upstream and Downstream of China Aquaculture Industry
5.1 Upstream
5.1.1 Aquatic Feed
5.1.2 Fishery Drugs
5.2 Downstream
5.2.1 Circulation and Warehousing
5.2.2 Aquatic Product Processing
6 Medium and High-end Aquaculture Products in China
6.1 Abalone
6.2 Sea Cucumber
6.3 Scallop
6.4 Sea Urchin
6.5 Conch
6.6 White Shrimp
6.7 Tilapia
6.8 Pearl
7 Major Companies
7.1 Dalian Yiqiao Marine Seeds Co., Ltd.
7.1.1 Profile
7.1.2 Operation
7.1.3 Revenue Structure
7.1.4 Gross Margin
7.1.5 Major Customers
7.2 Zhanjiang Guolian Aquatic Products Co., Ltd.
7.2.1 Profile
7.2.2 Operation
7.2.3 Revenue Structure
7.2.4 Gross Margin
7.2.5 Major Customers
7.3 Zhangzidao Group Co., Ltd.
7.3.1 Profile
7.3.2 Operation
7.3.3 Revenue Structure
7.3.4 Gross Margin
7.3.5 Major Customers
7.4 Shandong Oriental Ocean Sci-Tech Co., Ltd.
7.4.1 Profile
7.4.2 Operation
7.4.3 Revenue Structure
7.4.4 Gross Margin
7.4.5 Major Customers
7.5 Shandong Homey Aquatic Development Co., Ltd.
7.5.1 Profile
7.5.2 Operation
7.5.3 Revenue Structure
7.5.4 Gross Margin
7.5.5 Major Customers
7.6 Pure Pearl Group Co., Ltd.
7.6.1 Profile
7.6.2 Operation
7.6.3 Revenue Structure
7.6.4 Gross Margin
7.6.5 Major Customers
7.7 Dahu Aquaculture Co., Ltd.
7.7.1 Profile
7.7.2 Operation
7.7.3 Revenue Structure
7.7.4 Gross Margin
7.7.5 Major Customers
7.8 Hubei Wuchangyu Co., Ltd.
7.8.1 Profile
7.8.2 Operation
7.8.3 Breeding Business
7.9 Guangdong Haid Group Co., Ltd.
7.9.1 Profile
7.9.2 Operation
7.9.3 Revenue Structure
7.9.4 Gross Margin
7.9.5 Major Customers
7.10 Baiyang Aquatic Group, Inc.
7.10.1 Profile
7.10.2 Operation
7.10.3 Revenue Structure
7.10.4 Gross Margin
7.10.5 Major Customers
7.11 Ningbo Tech-Bank Co., Ltd.
7.11.1 Profile
7.11.2 Operation
7.11.3 Revenue Structure
7.11.4 Gross Margin
7.11.5 Aquatic Feed Business
7.11.6 Major Customers
7.12 Tongwei Co., Ltd.
7.12.1 Profile
7.12.2 Operation
7.12.3 Revenue Structure
7.12.4 Gross Margin
7.12.5 Aquatic Feed Business
7.12.6 Major Customers
7.13 Guangzhou LUXE Seafood ENT.LTD
7.13.1 Profile
7.13.2 Operation
7.13.3 Development Strategy
7.14 Xunshan Group
7.14.1 Profile
7.14.2 Operation
7.14.3 Development Strategy
7.14.4 Scientific Research
7.15 Dalian RainLion Group
7.15.1 Profile
7.15.2 Operation
7.15.3 Development Strategy
8 Forecast and Outlook
8.1 Consumption of Aquatic Products
8.2 Aquaculture
8.2.1 Breeding Area and Output
8.2.2 Competitive Landscape
8.3 Upstream and Downstream Sectors
8.3.1 Aquatic Feed
8.3.2 Processing of Aquatic Products
Aquaculture Industry Chain
Laws and Systems about China Aquaculture Industry
Industrial Planning concerning China Aquaculture Industry
China Fishery Industry and Industrial Added Value by Sector, 2006-2013
Percentage of Industrial Added Value of China Fishery Industry (by Sector), 2006-2013
Output and Percentage of Aquatic Products in China, 2006-2013
Percentage of Aquaculture Area in China, 2006-2013
Affected Area of Aquaculture and Its Share in Total in China, 2006-2013
Chinese Per-capita Possession of Aquatic Products, 2006-2012
Whole-year Per Capita Purchase of Aquatic Products by Urban and Rural Residents in China, 2006-2012
Import & Export Volume of Aquatic Products in China, 2006-2013
Import & Export Value of Aquatic Products in China, 2006-2013
Average Import & Export Price of China’s Aquatic Products, 2006-2013
Competitive Edges of Leading Aquaculture Enterprises in China
Output Value and Added Value of Seawater Aquaculture in China, 2006-2013
Output and Area of Seawater Aquaculture in China, 2007-2012
Seawater Aquaculture Output Structure (by Region) in China, 2012
Seawater Aquaculture Output Structure (by Product) in China, 2007-2012
Seawater Aquaculture Area Structure (by Product) in China, 2007-2012
Seawater Aquaculture Output (by Product) in China, 2007-2012
Seawater Aquaculture Output (by Aquatorium) in China, 2007-2012
Seawater Aquaculture Area (by Aquatorium) in China, 2007-2012
Seawater Aquaculture Output (by Farming Method) in China, 2008-2012
Output Value and Added Value of Freshwater Aquaculture in China, 2006-2013
Output and Area of Freshwater Aquaculture in China, 2007-2012
Output Structure of Freshwater Aquaculture (by Region) in China, 2012
Output Structure of Freshwater Aquaculture (by Product) in China, 2007-2012
Output of Freshwater Aquaculture (by Product) in China, 2007-2012
Output of Freshwater Aquaculture (by Aquatorium) in China, 2007-2012
Area of Freshwater Aquaculture (by Aquatorium) in China, 2007-2012
Output of Freshwater Aquaculture (by Farming Method) in China, 2007-2012
Output Value and Added Value of Aquatic Seeds in China, 2006-2013
Output of Key Seawater Aquatic Seeds in China, 2008-2012
Output of Key Freshwater Aquatic Seeds in China, 2008-2012
Aquaculture Output in Fujian Province, 2008-2012
Seawater Aquaculture Output Structure (by Farming Methods) in Fujian Province, 2012
Freshwater Aquaculture Output Structure (Farming Methods) in Fujian Province, 2012
Aquaculture Output in Jiangsu Province, 2008-2012
Seawater Aquaculture Output Structure (by Farming Methods) in Jiangsu Province, 2012
Freshwater Aquaculture Output Structure (Farming Methods) in Jiangsu Province, 2012
Aquaculture Output in Shandong Province, 2008-2013
Seawater Aquaculture Output Structure (by Farming Methods) in Shandong Province, 2012
Freshwater Aquaculture Output Structure (Farming Methods) in Shandong Province, 2012
Aquaculture Output in Liaoning Province, 2008-2012
Seawater Aquaculture Output Structure (by Farming Methods) in Liaoning Province, 2012
Freshwater Aquaculture Output Structure (Farming Methods) in Liaoning Province, 2012
Aquaculture Output in Guangdong Province, 2008-2012
Seawater Aquaculture Output Structure (by Farming Methods) in Guangdong Province, 2012
Freshwater Aquaculture Output Structure (Farming Methods) in Guangdong Province, 2012
Aquaculture Output in Zhejiang Province, 2008-2012
Seawater Aquaculture Output Structure (by Farming Methods) in Zhejiang Province, 2012
Freshwater Aquaculture Output Structure (Farming Methods) in Zhejiang Province, 2012
Aquaculture Output in Hubei Province, 2008-2013
Freshwater Aquaculture Output Structure (Farming Methods) in Hubei Province, 2012
Aquaculture Output in Hunan Province, 2008-2013
Freshwater Aquaculture Output Structure (Farming Methods) in Hunan Province, 2012
China’s Output of Aquatic Feed, 2006-2013
Output Value and Added Value of China Aquatic Feed Industry, 2006-2012
Operating Revenue, Profit and Gross Margin of China Aquatic Feed Industry, 2008-2014
Output Value and Added Value of China Fishery Drugs Industry, 2006-2012
Output Value and Added Value of China Aquatic Product Distribution Industry, 2006-2012
Output Value and Added Value of China Aquatic Product Warehouse and Transportation Industry, 2006-2012
Output and Added Value of China Aquatic Processing Industry, 2006-2012
China’s Aquatic Products Processing Capacity and Capacity Utilization, 2006-2012
Operating Revenue, Profit and Gross Margin of China Aquatic Processing Industry, 2008-2014
Output of Cultured Abalone in China, 2006-2012
Abalone Prices in China, 2007-2014
Output of Cultured Sea Cucumber in China, 2006-2012
Sea Cucumber Prices in China, 2007-2014
Scallop Prices in China, 2007-2014
Output of Cultured Scallop in China, 2006-2012
Output of Cultured Sea Urchins in China, 2006-2012
Output of Cultured Conches in China, 2006-2012
Output of Cultured Whiteshrimp in China, 2006-2012
Output Structure of Cultured Whiteshrimp (by Farming Methods) in China, 2006-2012
Prawn Prices in China, 2007-2014
Output of Cultured Tilapia in China, 2006-2012
Tilapia Prices in China, 2007-2014
Output of Cultured Pearls in China, 2006-2012
Medicinal Pearl Prices in China, 2009-2014
Revenue and Net Income of Dalian Yiqiao Marine Seeds Co., Ltd., 2009-2014
Revenue Structure (%) of Dalian Yiqiao Marine Seeds Co., Ltd.by Region, 2009-2013
Revenue Breakdown of Dalian Yiqiao Marine Seeds Co., Ltd. by Region, 2009-2013
Revenue Structure (%) of Dalian Yiqiao Marine Seeds Co., Ltd.by Product, 2009-2013
Revenue Breakdown of Dalian Yiqiao Marine Seeds Co., Ltd. by Product, 2009-2013
Integrated Gross Margin of Dalian Yiqiao Marine Seeds Co., Ltd., 2009-2014
Gross Margin of Dalian Yiqiao Marine Seeds Co., Ltd.by Product, 2009-2013
Revenue of Dalian Yiqiao Marine Seeds Co., Ltd.from Top 5 Clients and % of Total Revenue, 2009-2013
Revenue and Net Income of Zhanjiang Guolian Aquatic Products Co., Ltd., 2009-2014
Operating Revenue Structure (%) of Zhanjiang Guolian Aquatic Products Co., Ltd.by Region, 2009-2013
Revenue Breakdown of Zhanjiang Guolian Aquatic Products Co., Ltd by Region, 2009-2013
Operating Revenue Structure (%) of Zhanjiang Guolian Aquatic Products Co., Ltd.by Product, 2009-2013
Revenue Breakdown of Zhanjiang Guolian Aquatic Products Co., Ltd by Product, 2009-2013
Integrated Gross Margin of Zhanjiang Guolian Aquatic Products Co., Ltd., 2009-2014
Gross Margin of Zhanjiang Guolian Aquatic Products Co., Ltd by Product, 2009-2013
Revenue of Zhanjiang Guolian Aquatic Products Co., Ltd from Top 5 Clients and % of Total Revenue, 2009-2013
Revenue and Net Income of Zhangzidao Group Co., Ltd., 2009-2014
Operating Revenue Structure (%) of Zhangzidao Group Co., Ltd by Region, 2009-2013
Revenue Breakdown of Zhangzidao Group Co., Ltd by Region, 2009-2013
Operating Revenue Structure (%) of Zhangzidao Group Co., Ltd by Product, 2009-2013
Revenue Breakdown of Zhangzidao Group Co., Ltd by Product, 2009-2013
Integrated Gross Margin of Zhangzidao Group Co., Ltd., 2009-2014
Gross Margin of Aquatic Products of Zhangzidao Group Co., Ltd., 2009-2013
Revenue of Zhangzidao Group Co., Ltd from Top 5 Clients and % of Total Revenue, 2009-2013
Revenue and Net Income of Shandong Oriental Ocean Sci-Tech Co., Ltd, 2009-2014
Operating Revenue Structure (%) of Shandong Oriental Ocean Sci-Tech Co., Ltd by Region, 2009-2013
Operating Revenue Structure (%) of Shandong Oriental Ocean Sci-Tech Co., Ltd by Product, 2009-2013
Revenue Breakdown of Shandong Oriental Ocean Sci-Tech Co., Ltd by Product, 2009-2013
Integrated Gross Margin of Shandong Oriental Ocean Sci-Tech Co., Ltd, 2009-2014
Gross Margin of Sea Cucumber Business of Shandong Oriental Ocean Sci-Tech Co., Ltd, 2009-2013
Revenue of Shandong Oriental Ocean Sci-Tech Co., Ltd from Top 5 Clients and % of Total Revenue, 2009-2013
Revenue and Net Income of Shandong Homey Aquatic Development Co., Ltd, 2009-2014
Operating Revenue Structure (%) of Shandong Homey Aquatic Development Co., Ltd by Region, 2009-2013
Revenue Breakdown of Shandong Homey Aquatic Development Co., Ltd by Region, 2009-2013
Operating Revenue Structure (%) of Shandong Homey Aquatic Development Co., Ltd by Sector, 2009-2013
Revenue Breakdown of Shandong Homey Aquatic Development Co., Ltd by Sector, 2009-2013
Integrated Gross Margin of Shandong Homey Aquatic Development Co., Ltd, 2009-2014
Gross Margin of Shandong Homey Aquatic Development Co., Ltd by Sector, 2009-2013
Revenue of Shandong Homey Aquatic Development Co., Ltd from Top 5 Clients and % of Total Revenue, 2009-2013
Revenue and Net Income of Pure Pearl Group Co., Ltd., 2009-2014
Operating Revenue Structure (%) of Pure Pearl Group Co., Ltd. by Region, 2009-2013
Revenue Breakdown of Pure Pearl Group Co., Ltd. by Region, 2009-2013
Operating Revenue Structure (%) of Pure Pearl Group Co., Ltd. by Sector, 2009-2013
Revenue Breakdown of Pure Pearl Group Co., Ltd. by Sector, 2009-2013
Integrated Gross Margin of Pure Pearl Group Co., Ltd., 2009-2014
Gross Margin of Pure Pearl Group Co., Ltd. by Sector, 2009-2013
Revenue of Pure Pearl Group Co., Ltd. from Top 5 Clients and % of Total Revenue, 2009-2013
Revenue and Net Income of Dahu Aquaculture Co., Ltd., 2009-2014
Operating Revenue Structure (%) of Dahu Aquaculture Co., Ltd. by Region, 2009-2013
Revenue Breakdown of Dahu Aquaculture Co., Ltd. by Region, 2009-2013
Operating Revenue Structure (%) of Dahu Aquaculture Co., Ltd. by Sector, 2009-2013
Revenue Breakdown of Dahu Aquaculture Co., Ltd. by Sector, 2009-2013
Integrated Gross Margin of Dahu Aquaculture Co., Ltd., 2009-2014
Gross Margin of Dahu Aquaculture Co., Ltd. by Region, 2009-2013
Gross Margin of Dahu Aquaculture Co., Ltd. by Sector, 2009-2013
Revenue of Dahu Aquaculture Co., Ltd. from Top 5 Clients and % of Total Revenue, 2009-2013
Revenue and Net Income of Hubei Wuchangyu Co., Ltd., 2009-2014
Revenue of Hubei Wuchangyu Co., Ltd.by Sector, 2009-2013
Revenue and Net Income of Guangdong Haid Group Co., Ltd, 2009-2014
Operating Revenue Structure (%) of Guangdong Haid Group Co., Ltd by Region, 2009-2013
Revenue Breakdown of Guangdong Haid Group Co., Ltd by Region, 2009-2013
Operating Revenue Structure (%) of Guangdong Haid Group Co., Ltd by Sector, 2009-2013
Revenue Breakdown of Guangdong Haid Group Co., Ltd by Sector, 2009-2013
Integrated Gross Margin of Guangdong Haid Group Co., Ltd, 2009-2014
Gross Margin of Guangdong Haid Group Co., Ltd by Sector, 2009-2014
Revenue of Guangdong Haid Group Co., Ltd from Top 5 Clients and % of Total Revenue, 2009-2013
Revenue and Net Income of Baiyang Aquatic Group, Inc., 2009-2014
Operating Revenue Structure (%) of Baiyang Aquatic Group, Inc. by Region, 2009-2013
Revenue Breakdown of Baiyang Aquatic Group, Inc. by Region, 2009-2013
Operating Revenue Structure (%) of Baiyang Aquatic Group, Inc. by Product, 2009-2013
Revenue Breakdown of Baiyang Aquatic Group, Inc. by Product, 2009-2013
Integrated Gross Margin of Baiyang Aquatic Group, Inc., 2009-2014
Gross Margin of Baiyang Aquatic Group, Inc. by Region, 2009-2013
Gross Margin of Baiyang Aquatic Group, Inc. by Product, 2009-2013
Revenue of Baiyang Aquatic Group, Inc. from Top 5 Clients and % of Total Revenue, 2009-2013
Revenue and Net Income of Ningbo Tech-Bank Co., Ltd, 2009-2014
Operating Revenue Structure (%) of Ningbo Tech-Bank Co., Ltd by Region, 2009-2013
Revenue Breakdown of Ningbo Tech-Bank Co., Ltd by Region, 2009-2013
Operating Revenue Structure (%) of Ningbo Tech-Bank Co., Ltd by Sector, 2009-2013
Revenue Breakdown of Ningbo Tech-Bank Co., Ltd by Sector, 2009-2013
Integrated Gross Margin of Ningbo Tech-Bank Co., Ltd, 2009-2014
Gross Margin of Ningbo Tech-Bank Co., Ltd by Region, 2009-2013
Gross Margin of Ningbo Tech-Bank Co., Ltd by Sector, 2009-2013
Patents about Aquaculture of Ningbo Tech-Bank Co., Ltd
Revenue of Ningbo Tech-Bank Co., Ltd from Top 5 Clients and % of Total Revenue, 2009-2013
Revenue and Net Income of Tongwei Co., Ltd, 2009-2014
Operating Revenue Structure (%) of Tongwei Co., Ltd by Region, 2009-2013
Revenue Breakdown of Tongwei Co., Ltd by Region, 2009-2013
Operating Revenue Structure (%) of Tongwei Co., Ltd by Sector, 2009-2013
Revenue Breakdown of Tongwei Co., Ltd by Sector, 2009-2013
Integrated Gross Margin of Tongwei Co., Ltd, 2009-2014
Gross Margin of Tongwei Co., Ltd by Sector, 2009-2014
Aquatic Feed Output of Tongwei Co., Ltd., 2010-2013
Revenue of Tongwei Co., Ltd from Top 5 Clients and % of Total Revenue, 2009-2013
Five Largest Industry Bases of Dalian RainLion Group
China’s Population and Urban and Rural Structure, 2012-2017E
Per-capita Purchase and Total Consumption of Aquatic Products in China, 2012-2017E
Seawater Aquaculture Output and Area in China, 2013-2017E
Freshwater Aquaculture Output and Area in China, 2013-2017E
China’s Output of Aquatic Feeds, 2013-2017E