Global and China Wire and Cable Industry Report, 2014-2018
-
Apr.2015
- Hard Copy
- USD
$2,500
-
- Pages:116
- Single User License
(PDF Unprintable)
- USD
$2,350
-
- Code:
ZHP020
- Enterprise-wide License
(PDF Printable & Editable)
- USD
$3,600
-
- Hard Copy + Single User License
- USD
$2,700
-
Wire and cable industry, a supporting sector of the electric industry, accounts for 25% of total output value of electric industry, and is widely used in electric power industry, data communication, rail transit, automobiles, shipbuilding, and other industries.
After 2004, China’s wire and cable industry saw rapid growth, with the revenue achieving a CAGR of 28.7% in 2004-2010. While following 2011, affected by the factors including declining raw material prices, the slowed downstream market, and increasingly prominent overcapacity, the growth of overall industry slowed down. Therefore, the revenue CAGR during 2011-2014 slumped to 7.4%.
At present, China has already been the world's largest wire and cable producer, but with a relatively low industry concentration. China’s top 10 wire and cable manufacturers have accounted for a combined 10% of the total output value contrast to over 60% of Europe, the United States, and other developed countries.
In addition, more than 95% of wire and cable manufacturers in China are small and medium-sized ones, and they mainly produce low and mid-end products. High-end products rely on imports. In 2014, China imported 285,000 tons of wire and cable from such countries as South Korea, Japan, Germany, and the United States.
In terms of company competition pattern, China wire and cable market is dominated by foreign companies like Prysmian SpA, Nexans SA, and General Cable; the relatively large-scale domestic players including Far East Smarter Energy, Baosheng Sci&Tech Innovation and Qingdao Hanhe Cable occupy small market share.
Prysmian: the largest wire and cable player in the world, the revenue in 2014 hit EUR6.84billion (around USD45.08 billion). Entered in Chinese market in 2001, it has set up seven wire and cable branches. In Sep.2014, it obtained marine cable orders from Shanghai Waigaoqiao Shipbuilding Co.
Nexans: one of the top 3 wire and cable manufacturers worldwide, it could offer full-series wire and cable solutions, and owns three plants in China. In Apr.2015, it obtained 500KV XLPE cable system project of State Gird Shanghai Municipal Electric Power Co., which is the fourth 500KV scale project in China, and estimated to be finished before the end of 2016.??
Far East Smarter Energy: the largest wire and cable manufacturer in China, its revenue from wire and cable business in 2014 registered RMB11.78 billion. In July 2014, it signed cooperation agreement with Jiangsu Huabo Industrial Group on providing special wire and cable for Tesla’s new energy electric vehicle and charging equipment. In March 2015, it concluded supply contract with GE on cable for intelligent environment-friendly locomotives.
Baosheng: the second largest wire and cable manufacturer in China, it is dedicated to power cable, cable for electric equipment, and network cable, etc, and positively extends to high-end special cable market used in military, new energy, automobile and aviation& aerospace, etc. In Feb.2015, it invested and established Baosheng (Shanghai) Aviation &Aerospace Cable System Co., Ltd.
?
The report focuses on following:
 Market Size, Competitive Landscape of global wire and cable market;
Status quo, Market Size, Competitive Landscape, import & export of China wire and cable industry;
Market Size and Demand of segmented markets including power cable, communication cable and optical cable, automotive wiring harness, etc.;
Operation and Layout in China of Seven overseas wire and cable players;
Operation, Revenue Structure, Wire and Cable Business of 18 Chinese wire and cable manufacturers.
1. Overview of Wire and Cable Industry
1.1 Definition
1.2 Classification
1.3 Industry Characteristics
1.4 Industry Barrier
1.5 Industry Chain
2 Overview of Global Wire and Cable Market
2.1 Market Size
2.2 Competitive Landscape
3 Overview of Wire and Cable Market in China
3.1 Industry Status
3.2 Market Size
3.3 Competitive Landscape
3.4 Import and Export
3.4.1 Import
3.4.2 Export
4 Main Market Segments
4.1 Power Cable
4.1.1 Market Size
4.1.2 Downstream Demand
4.1.3 Major Manufacturers
4.2 Communication Cable and Optical Cable
4.2.1 Market Size
4.2.2 Downstream Demand
4.2.3 Major Manufacturers
4.3 Automotive Wiring Harness
5 Major Foreign Wire and Cable Manufacturers
5.1 Nexans
5.1.1 Profile
5.1.2 Operation
5.1.3 Business in China
5.2 Prysmian
5.2.1 Profile
5.2.2 Operation
5.2.3 Revenue Structure
5.2.4 Business in China
5.3 Sumitomo Electric Industries, Ltd.
5.3.1 Profile
5.3.2 Operation
5.3.3 Revenue Structure
5.3.4 Business in China
5.4 Furukawa Electric Co., Ltd.
5.4.1 Profile
5.4.2 Operation
5.4.3 Revenue Structure
5.4.3 Business in China
5.5 General Cable
5.5.1 Profile
5.5.2 Operation
5.5.3 Business in China
5.6 Others
5.6.1 LS Cable & System
5.6.2 LEONI
6 Major Chinese Wire and Cable Manufacturers
6.1 Qingdao Hanhe Cable Co., Ltd.
6.1.1 Profile
6.1.2 Operation
6.1.3 Major Customers and Suppliers
6.1.4 Revenue Structure
6.1.5 Gross Margin
6.1.6 Wire and Cable Business
6.2 Baosheng Science and Technology Innovation Co., Ltd.
6.2.1 Profile
6.2.2 Operation
6.2.3 Major Customers
6.2.4 Revenue Structure
6.2.5 Gross Margin
6.2.6 Wire and Cable Business
6.2.7 Main Projects
6.3 Far East Smarter Energy Co., Ltd.
6.3.1 Profile
6.3.2 Operation
6.3.3 Revenue Structure
6.3.4 Wire and Cable Business
6.3.5 Latest Developments
6.4 Fujian Nanping Sun Cable Co., Ltd.
6.4.1 Profile
6.4.2 Operation
6.4.3 Major Customers and Suppliers
6.4.4 Revenue Structure
6.4.5 Gross Margin
6.4.6 Wire and Cable Business
6.5 Guangdong Nanyang Cable Group Holding Co. Ltd.
6.5.1 Profile
6.5.2 Operation
6.5.3 Revenue Structure
6.5.4 Gross Margin
6.5.5 Wire and Cable Business
6.6 Zhejiang Wanma Cable Co., Ltd.
6.6.1 Profile
6.6.2 Operation
6.6.3 Revenue Structure
6.6.4 Wire and Cable Business
6.7 Tebian Electric Apparatus Stock Co., Ltd.
6.7.1 Profile
6.7.2 Operation
6.7.3 Revenue Structure
6.7.4 Wire and Cable Business
6.8 Jiangsu Zhongchao Cable Corporation
6.8.1 Profile
6.8.2 Operation
6.8.3 Major Customers and Suppliers
6.8.4 Revenue Structure
6.8.5 Wire and Cable Business
6.9 Shanghai Morn Electric Equipment Co., Ltd.
6.9.1 Profile
6.9.2 Major Suppliers
6.9.3 Operation
6.9.4 Revenue Structure
6.9.5 Wire and Cable Business
6.10 Jiangsu Etern Company Limited
6.10.1 Profile
6.10.2 Operation
6.10.3 Revenue Structure
6.10.4 Wire and Cable Business
6.11 Beijing Xianghui Electrical Wire & Cable Co., Ltd.
6.11.1 Profile
6.11.2 Operation
6.11.3 Major Customers and Suppliers
6.11.4 Wire and Cable Business
6.12 Cangzhou Huiyou Cable Stock Co., Ltd.
6.12.1 Profile
6.12.2 Operation
6.12.3 Major Customers and Suppliers
6.12.4 Wire and Cable Business
6.13 Hengtong Group
6.13.1 Profile
6.13.2 Major Wire and Cable Subsidiary-Hengtong Optic-electric Co., Ltd.
6.14 Wuxi Jiangnan Cable Co., Ltd.
6.14.1 Profile
6.14.2 Operation
6.14.3 Revenue Structure
6.14.4 Wire and Cable Business
6.15 Other Manufacturers
6.15.1 Jiangsu Shangshang Cable Group Co., Ltd.
6.15.2 Tianjin Suli Cable Group Co., Ltd.
6.15.3 Shanghai Shenghua Cable Group
6.15.4 Xingle Group
7 Conclusion and Forecast
7.1 Market
7.2 Enterprises
Classification of Wire and Cable
China’s Wire and Cable Industry
Global Wire and Cable Industry Size, 2008-2015
Global Insulated Metal Cable Consumption, 2008-2014
Major Global Wire and Cable Manufacturers
Climate Index for China’s Wire and Cable Industry, 2012-2015
Number of Wire and Cable Enterprises above Designated Size in China, 2010-2014
Operating Revenue and YoY Growth Rate of Wire and Cable Industry in China, 2008-2018E
Total Profit and Gross Margin of Wire and Cable Industry in China, 2008-2015
Revenue Structure of Wire and Cable Industry in China by Region, 2014
Competition in Wire and Cable Industry in China
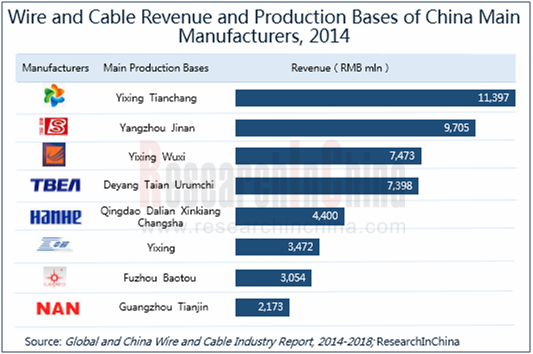
Leading Products and Revenue of Major Chinese Wire and Cable Manufacturers
Import Volume and YoY Growth of Wire and Cable in China, 2004-2014
Import Value and YoY Growth of Wire and Cable in China, 2004-2014
Import Structure of Wire and Cable in China by Region, 2014
Export Volume and YoY Growth of Wire and Cable in China, 2004-2014
Export Value and YoY Growth of Wire and Cable in China, 2004-2014
Export Structure of Wire and Cable in China by Region, 2014
Product Mix of Wire and Cable in China, 2013
Output and YoY Growth of Power Cable in China, 2004-2014
Output Composition of Power Cable in China by Region, 2014
Length and Growth Rate of Optical Cable in China, 2009-2014
Demand and Growth Rate of Communication Cable in China, 2010-2014
Major Communication Cable and Optical Cable Manufacturers in China
Output and Growth Rate of Automotive Wiring Harness in China, 2000-2014
Nexans’ Equity Structure, 2014
Nexans’ Global Marketing Network, 2014
Nexans’ Revenue and Operating Income, 2008-2014
Nexans’ Revenue Structure by Business, 2014
Nexans’ Revenue Proportion by Region, 2014
Nexans’ Layout in China
Prysmian’s Equity Structure, 2013
Prysmian’s Global Layout
Prysmian’s Revenue and Net Income, 2007-2014
Global Layout of Prysmian’s R&D Centers as of 2014
Prysmian’s Revenue Structure by Business, 2012-2014
Prysmian’s Revenue Structure by Region, 2014
Prysmian’s Enterprise Distribution in China
Number of Employees of Sumitomo Electric, FY2009-FY2013
Sumitomo Electric’s Revenue and Operating Income, FY2006-FY2014
Revenue of Sumitomo Electric by Product Application, FY2009-FY2014
Sumitomo Electric’s Revenue from Main Wire and Cable Products, FY2013-FY2014
Sumitomo Electric’s Global Layout as of March 2014
Sumitomo Electric’s Layout in China as of 2013
Furukawa Electric’s Revenue and Operating Income, FY2007-FY2015
Revenue Structure of Furukawa Electric by Business, FY2014
Revenue and Operating Income from Information Communication Business of Furukawa, FY2007-FY2015
Revenue and Operating Income from Energy and Mechanical Materials of Furukawa, FY2007-FY2015
Furukawa Electric’s Global Layout as of March 2014
Furukawa Electric’s Layout in China as of March 2014
General Cable’s Global Layout
General Cable’s Revenue and Operating Income, 2011-2014
General Cable’s Revenue Structure by Business, 2013-2014
General Cable’s Revenue Structure by Region, 2013-2014
Global Layout of LS Cable & System
LEONI’s Layout in China
Equity Structure of Qingdao Hanhe Cable
Revenue and Net Income of Qingdao Hanhe Cable, 2008-2014
Top 5 Customers of Qingdao Hanhe Cable,2013
Top 5 Suppliers of Qingdao Hanhe Cable,2013
Revenue Structure of Qingdao Hanhe Cable by Product, 2009-2014
Revenue Structure of Qingdao Hanhe Cable by Region, 2013-2014
Gross Margin of Qingdao Hanhe Cable by Product, 2009-2014
Qingdao Hanhe Cable’s Revenue from Main Wire and Cable Products, 2009-2014
Baosheng’s Equity Structure
Baosheng’s Operating Revenue and Net Income, 2008-2014
Baosheng’s Top 5 Customers, 2013-2014
Baosheng’s Revenue Structure by Product, 2008-2014
Baosheng’s Revenue Structure by Region, 2013-2014
Baosheng’s Gross Margin by Product, 2008-2014
Baosheng’s Cost Structure by Product, 2013
Baosheng’s Wire and Cable Revenue by Product, 2008-2014
Baosheng’s Sales Volume by Product, 2011-2013
Capacity and Revenue of Baosheng’s Subsidiaries, 2013-2014
Global Marketing Network of Far East Smarter Energy
Equity Structure of Far East Smarter Energy
Revenue and Net Income of Far East Smarter Energy, 2008-2014
Revenue of Far East Smarter Energy by Segment, 2009-2014
Wire and Cable Output and Sales Volume of Far East Smarter Energy by Product, 2011-2013
Wire and Cable Revenue Structure of Far East Smarter Energy by Product, 2014
Main Wire and Cable Applications of Far East Smarter Energy, 2014
Wire and Cable Revenue Structure of Far East Smarter Energy by Region, 2013-2014
Nanping Sun Cable’s Equity Structure
Nanping Sun Cable’s Revenue and Net Income, 2008-2014
Nanping Sun Cable’s Top 5 Customers, 2013-2014
Nanping Sun Cable’s Top 5 Suppliers, 2013
Revenue of Nanping Sun Cable by Product, 2009-2014
Revenue of Nanping Sun Cable by Region, 2013-2014
Gross Margin of Nanping Sun Cable by Product, 2008-2014
Nanping Sun Cable’s Wire and Cable Output and Sales Volume, 2011-2013
Nanping Sun Cable’s Wire and Cable Revenue by Product, 2009-2014
Wire and Cable Revenue Structure of Nanping Sun Cable by Cost, 2013
Revenue of Nanping Sun Cable’s Major Wire and Cable Subsidiaries, 2013-2014
Nanyang Cable’s Equity Structure
Nanyang Cable’s Operating Revenue and Net Income, 2008-2014
Nanyang Cable’s Revenue by Product, 2008-2014
Nanyang Cable’s Revenue Structure by Region, 2013-2014
Nanyang Cable’s Gross Margin by Product, 2008-2014
Revenue of Nanyang Cable’s Major Wire and Cable Subsidiaries, 2013-2014
Nanyang Cable’s Wire and Cable Sales Volume, 2011-2013
Nanyang Cable’s Special Cable Capacity, 2012-2014
Wanma Cable’s Equity Structure
Wanma Cable’s Global Marketing Network
Wanma Cable’s Revenue and Net Income, 2008-2014
Wanma Cable’s Revenue Structure by Product, 2013-2014
Wanma Cable’s Revenue Structure by Region, 2013-2014
Revenue of Wanma Cable’s Major Wire and Cable Subsidiaries, 2013-2014
Tebian Electric’s Equity Structure
Tebian Electric’s Global Layout
Tebian Electric’s Revenue and Net Income, 2008-2014
Tebian Electric’s Revenue Structure by Product, 2013-2014
Tebian Electric’s Revenue by Region, 2009-2014
Tebian Electric’s Wire and Cable Revenue and Gross Margin, 2009-2014
Tebian Electric’s Wire and Cable Cost Structure, 2013
Zhongchao Cable’s Equity Structure
Zhongchao Cable’s Global Marketing Network
Zhongchao Cable’s Revenue and Net Income, 2008-2014
Zhongchao Cable’s Top 5 Customers, 2013-2014
Zhongchao Cable’s Top 5 Suppliers, 2013
Zhongchao Cable’s Revenue Structure by Sector, 2013-2014
Zhongchao Cable’s Revenue by Region, 2009-2014
Zhongchao Cable’s Revenue from Main Wire and Cable Products, 2009-2014
Zhongchao Cable’s Wire and Cable Output and Sales Volume by Product, 2011-2013
Zhongchao Cable’s Gross Margin for Main Wire and Cable Products, 2009-2014
Morn Electric’s Equity Structure
Morn Electric’s Top 5 Suppliers, 2013
Morn Electric’s Revenue and Net Income, 2008-2014
Morn Electric’s Revenue Structure by Product, 2013-2014
Morn Electric’s Revenue by Region, 2009-2014
Morn Electric’s Wire and Cable Revenue by Product, 2009-2014
Morn Electric’s Wire and Cable Output and Sales Volume, 2011-2013
Morn Electric’s Gross Margin for Wire and Cable by Product, 2009-2014
Morn Electric’s Major Wire and Cable Applications, 2013
Etern’s Equity Structure
Etern’s Revenue and Net Income, 2008-2014
Etern’s Revenue Structure by Product, 2013-2014
Etern’s Optical Cable and Communication Equipment Revenue and Growth Rate, 2008-2014
Xianghui Electrical’s Equity Structure
Xianghui Electrical’s Revenue and Net Income, 2012-2014
Huiyou Cable’s Top 5 Customers, 2013-2014
Huiyou Cable’s Top 5 Suppliers, 2013-2014
Revenue and Gross Margin of Xianghui Electrical’s Wire and Cable Products, 2012-2014
Huiyou Cable’s Equity Structure
Huiyou Cable’s Revenue and Net Income, 2012-2014
Huiyou Cable’s Operating Revenue by Region, 2012-2014
Huiyou Cable’s Top 5 Customers, 2013-2014
Huiyou Cable’s Top 5 Suppliers, 2013-2014
Huiyou Cable’s Wire and Cable Revenue by Product, 2012-2014
Hengtong Group’s Equity Structure
Hengtong Group’s Global Wire and Cable Marketing Outlets
Hengtong Optic-electric’s Revenue and Net Income, 2008-2014
Hengtong Optic-electric’s Revenue Structure by Product, 2013-2014
Output and Sales Volume of Hengtong Optic-electric’s Main Wire and Cable Products, 2012-2013
Jiangnan Cable’s Global Marketing Network
Jiangnan Cable’s Revenue and Net Income, 2010-2014
Jiangnan Cable’s Revenue Structure by Region, 2014
Jiangnan Cable’s Revenue from Main Wire and Cable Products, 2011-2014
Sales Volume of Jiangnan Cable’s Main Wire and Cable Products, 2013-2014
Shangshang Cable’s Global Marketing Network
Shangshang Cable’s Nuclear Cable Capacity
Global Marketing Network of Zhejiang Industrial Group
Growth Rate of Global and China Wire and Cable Market, 2009-2018E
Growth Rate of Wire and Cable Import and Export in China, 2005-2014
Revenue Growth Rate of Major Global Wire and Cable Manufacturers, 2007-2014
Competitive Landscape of Chinese Wire and Cable Manufacturers, 2014
Global and China Optical Fiber Preform Industry Report, 2021-2026
Optical fiber preforms play a key role in the optical fiber communication industry chain. The global construction of 4G and FTTH requires less optical fiber and cable, which has dragged down the deman...
Global and China Photoresist Industry Report, 2021-2026
Since its invention in 1959, photoresist has been the most crucial process material for the semiconductor industry. Photoresist was improved as a key material used in the manufacturing process of prin...
Global and China Needle Coke Industry Report, 2021-2026
Needle coke is an important carbon material, featuring a low thermal expansion coefficient, a low electrical resistivity, and strong thermal shock resistance and oxidation resistance. It is suitable f...
Global and China 3D Glass Industry Report, 2021-2026
3D curved glass is light and thin, transparent and clean, anti-fingerprint, anti-glare, hard and scratch-resistant, and performs well in weather resistance. It is applicable to terminals such as high-...
Global and China Graphene Industry Report, 2020-2026
Graphene, a kind of 2D carbon nanomaterial, features excellent properties such as mechanical property and super electrical conductivity and thermal conductivity. Its downstream application ranges from...
Global and China Optical Fiber Preform Industry Report, 2020-2026
Optical fiber preform as a hi-tech product and a crucial link in the optical fiber industry chain contributes to 70% or so of profit margin. Global 4G and FTTH construction at dusk leads to the shrink...
Global and China 3D Glass Industry Report, 2020-2026
Global 3D glass market has been enlarging over the recent years amid demetallization of smartphone back covers and popularity of smart wearables, to approximately $2.86 billion in 2019 and to an estim...
Global and China Photoresist Industry Report, 2020-2026
In 2019, global photoresist market was valued at $8.3 billion, growing at a compound annual rate of 5.1% or so since 2010, and it will outnumber $12.7 billion in 2026 with advances in electronic techn...
Global and China Synthetic Diamond Industry Report, 2020-2026
While its mechanical property is given full play in fields like grinding and cutting, diamond with acoustic, optical, magnetic, thermal and other special properties, as superconducting material, intel...
Global and China Needle Coke Industry Report, 2020-2026
With the merits like small resistivity, excellent resistance to impact and good anti-oxidation property, needle coke has been widely used in ultra-high power graphite electrodes, nuclear reactor decel...
Global and China Optical Fiber Preform Industry Report, 2019-2025
Optical fiber preform, playing an important role in the optical fiber and cable industry chain, seizes about 70% profits of optical fiber. Global demand for optical fiber preform stood at 16.2kt in 20...
China Silicon Carbide Industry Report, 2019-2025
Silicon carbide (SiC) is the most mature and the most widely used among third-generation wide band gap semiconductor materials. Over the past two years, global SiC market capacity, however, hovered ar...
Global and China Photoresist Industry Report, 2019-2025
Photoresist, a sort of material indispensable to PCB, flat panel display, optoelectronic devices, among others, keeps expanding in market size amid the robust demand from downstream sectors. In 2018, ...
Global and China Graphene Industry Report, 2019-2025
Graphene is featured with excellent performance and enjoys a rosy prospect. The global graphene market was worth more than $100 million in 2018, with an anticipated CAGR of virtually 45% between 2019 ...
Global and China 3D Glass Industry Chain Report, 2019-2025
The evolution of AMOLED conduces to the steady development of 3D curved glass market. In 2018, the global 3D glass market expanded 37.7% on an annualized basis and reached $1.9 billion, a figure proje...
China Wood Flooring Industry Report, 2019-2025
With the better standard of living and the people’s desire for an elegant life, wood flooring sees a rising share in the flooring industry of China, up from 33.9% in 2009 to 38.9% in 2018, just behind...
Global and China Photovoltaic Glass Industry Report, 2019-2025
In China, PV installed capacity has ramped up since the issuance of photovoltaic (PV) subsidy policies, reaching 53GW in 2017, or over 50% of global total. However, the domestic PV demand was hit by t...
Global and China ITO Targets Industry Chain Report, 2019-2025
Featured by good electrical conductivity and transparency, ITO targets are widely applied to fields of LCD, flat-panel display, plasma display, touch screen, electronic paper, OLED, solar cell, antist...