China Lubricant Industry Report, 2014-2018
-
Sep.2015
- Hard Copy
- USD
$2,400
-
- Pages:98
- Single User License
(PDF Unprintable)
- USD
$2,250
-
- Code:
ZYM068
- Enterprise-wide License
(PDF Printable & Editable)
- USD
$3,400
-
- Hard Copy + Single User License
- USD
$2,600
-
The development of automobiles, machinery manufacturing, electrical, and other industries in China has triggered a rapid expansion of lubricant market size. So far, China has become one of the world’s major lubricant producers and consumers. However, amid the low-speed growth of the global economy, China’s lubricant market continued to decline for the past two years, with 2014’s lubricant output falling by 3.6% year-on-year to 5.6866 million tons.
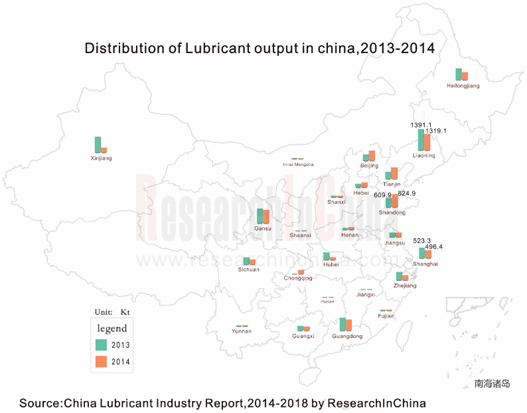
Influenced by the distribution of resources, China's lubricant industry presents obvious regional characteristics. In 2014, Liaoning, Shandong, and Shanghai ranked among the top three by lubricant output. Among them, Liaoning produced 1.3191 million tons, accounting for 23.2% of the total nationwide, and the output of Shandong and Shanghai were recorded at 824.9 kilotons and 496.4 kilotons, respectively.
At present, China's lubricant market is dominated by state-owned, foreign-funded, private-owned enterprises. As the leaders in China's lubricant industry, Sinopec (Great Wall Lubricant) and PetroChina (Kunlun Lubricant) represented a combined 48.7% market share in 2014, while transnational petroleum corporations e.g. Shell, BP, FUCHS, and Total occupied a 29.7% share.
Upbeat about the outlook for China's lubricant market, and hoping to stabilize their share in China's lubricant market, the foreign giants that have long dominated China's high-end lubricant market are working to make layout and integration of China's lubricant business.
In November 2014, Total, a French oil company, announced that it was integrating its lubricant business in China with COSCO Shipping. The company would put Total Lubricant (China) Co. as the main part, and make the companies in Guangzhou and Tianjin the wholly-owned subsidiaries of Total Lubricant (China); Guangzhou Ocean Shipping Co., a subsidiary of COSCO Shipping, will hold a 20% stake in the new Total Lubricant (China).
In June 2015, Shell's eighth lubricant blending plant in China—Tianjin Lubricant Blending Plant (located in the Tianjin Nangang Industrial Park) was put into operation. The new plant has an annual output of 330 million liters and expansion capacity of 500 million liters.
However, with the development of oil refining industry and the improvement of marketization, base oil supply bottlenecks will be eliminated, so that the local privately-owned enterprises, through years of efforts, will also hold an important position in some Chinese lubricant market segments. The companies like Jiangsu LOPAL Tech. Co. and Guangdong Delian Group Co. are the major Chinese automotive lubricant suppliers; Jiangsu Gaoke Petrochemical Company Limited, Dongguan Anmei Lubrication Technology Co., and Shandong Yuangen Petroleum Chemical, among others, have certain competitive advantages in China’s industrial lubricant market segment.
The report highlights the following:
 Operation environment of China lubricant industry, including international market environment, domestic macro-economic environment, etc.;
Development status, market supply and demand, competitive landscape, import and export, growth prediction, etc. of China lubricant industry;
Market status, supply and demand, import and export, etc. of base oil and additives in China;
Policies, market status, supply and demand, etc. of waste lubricants in China;
Operation, lubricant business, development prospects, etc. of 8 global and 8 Chinese lubricant companies.
1. Overview of Lubricant and Lubricant Base Oil
1.1 Definition of Lubricant
1.2 Major Lubricants
1.2.1 Internal Combustion Engine Oil
1.2.2 Gear Oil
1.2.3 Hydraulic Oil
2. Development of China Lubricant Market
2.1 International Market Environment
2.1.1 Overview
2.1.2 Crude Oil Market
2.2 Domestic Market Environment
2.2.1 Supply
2.2.2 Demand
2.2.3 Macroeconomic Environment
2.3 Import and Export
2.3.1 Import
2.3.2 Export
2.4 Competitive Landscape
3. Overview of China Lubricant Upstream Industries
3.1 Base Oil
3.1.1 Supply and Demand
3.1.2 Competitive Landscape
3.1.3 Import and Export
3.2 Additives
4. Overview of China Waste Lubricant Recovery Market
4.1 Policies and Regulations
4.2 Current Development
4.3 Regeneration Projects
4.4 Supply and Demand
5. Major Global Lubricant Enterprise
5.1 Shell
5.1.1 Profile
5.1.2 Operation
5.1.3 Lubricant Business in China
5.2 BP
5.2.1 Profile
5.2.2 Operation
5.2.3 BP LUBRICANT
5.2.4 Lubricant Business in China
5.3 ExxonMobil
5.3.1 Profile
5.3.2 Operation
5.3.3 Lubricant Business
5.3.4 Lubricant Business in China
5.4 Chevron
5.4.1 Profile
5.4.2 Operation
5.4.3 Lubricant Business in China
5.5 Total
5.5.1 Profile
5.5.2 Operation
5.5.3 Lubricant Business in China
5.6 FUCHS
5.6.1 Profile
5.6.2 Lubricant Business in China
5.7 ASHLAND
5.7.1 Profile
5.7.2 Operation
5.7.3 Lubricant Business in China
5.8 ConocoPhillips
5.8.1 Profile
5.8.2 Operation
5.8.3 Lubricant Business in China
6. Major Chinese Lubricant Enterprises
6.1 PetroChina Company Limited (PetroChina)
6.1.1 Profile
6.1.2 Operation
6.1.3 Revenue Structure
6.1.4 Gross Margin
6.1.5 Lubricant Business
6.1.6 Forecast and Outlook
6.2 China Petrochemical Corporation (Sinopec Corp.)
6.2.1 Profile
6.2.2 Operation
6.2.3 Revenue Structure
6.2.4 Gross Margin
6.2.5 Lubricant Business
6.2.6 Forecast and Outlook
6.3 Guangdong Delian Group Co., Ltd.
6.3.1 Profile
6.3.2 Operation
6.3.3 Revenue Structure
6.3.4 Gross Margin
6.3.5 Lubricant Business
6.3.6 R&D and Investment
6.3.7 Forecast and Outlook
6.4 Jiangsu Gaoke Petrochemical Company Limited
6.4.1 Profile
6.4.2 Operation
6.4.3 Revenue Structure
6.4.4 Gross Margin
6.4.5 R&D
6.4.6 Capacity, Output and Sales Volume
6.4.7 Clients and Suppliers
6.4.8 Forecast and Outlook
6.5 Copton Corporation
6.5.1 Profile
6.5.2 Operation
6.5.3 Revenue Structure
6.5.4 Gross Margin
6.5.5 R&D
6.5.6 Capacity, Output and Sales Volume
6.5.7 Clients and Suppliers
6.5.8 Forecast and Outlook
6.6 Tianjin Sure Energy Lubrication Technology Co., Ltd.
6.6.1 Profile
6.6.2 Operation
6.6.3 Revenue Structure
6.6.4 Gross Margin
6.6.5 Supply and Marketing
6.6.6 Forecast and Outlook
6.7 Other Enterprises
6.7.1 Jiangsu LOPAL Tech. Co., Ltd.
6.7.2 Lidi
7 Forecast and Outlook
7.1 Overall Market
7.2 Performance Comparison between Major Companies
7.2.1 Revenue
7.2.2 Net Income
7.2.3 Gross Margin
Classification Criteria of API-1509 Base Oil
Classification and Code of Q/SHR001-95 Lubricant Base Oil
Consumption Structure of Global Lubricant Market (by Application), 2014
Global Lubricant Demand and YoY Change, 2004-2014
Lubricant Demand Proportion in Major Regions of the World, 2014
Lubricant Output and YoY Growth Rate in China, 2010-2015
Output of Major Lubricant Producing Areas in China (by Province/Municipality), 2009-2015
Apparent Consumption of Lubricant and YoY Growth Rate in China, 2009-2015
China's Lubricant Market Share by Enterprise Type, 2014
Target Market and Competition of Major Lubricant Enterprises in China
Capacity of Major Lubricant Enterprises in China, 2014
Prefilled Lubricant & 4S After-service Lubricant Brands of Some Automobile Companies in China
Proportion of Base Oil Types Worldwide (by Capacity), 2014
China’s Base Oil Variety Proportion by Capacity, 2014
Base Oil Output of Major Chinese Enterprises and % of Total Output, 2012-2013
China's Top 10 Base Oil Import Sources (by Import Volume), 2014
China's Top 10 Base Oil Export Destinations (by Export Volume), 2014
China’s Lubricant Additive Consumption Structure (by Application)
China’s Lubricant Additive Import Volume and Value, 2013-2015
China’s Top 10 Lubricant Additive Import Sources and Import Volume, 2014
China’s Lubricant Additive Export Volume and Value, 2013-2015
China’s Top 10 Lubricant Additive Export Destinations and Export Volume, 2014
China’s Theoretical Waste Lubricant Supply, 2009-2015
Shell’s Revenue and Net Income, 2011-2015
BP’s Revenue and Net Income, 2011-2015
Castrol’s Lubricant EBIT, 2011-2013
Exxon Mobil’s Revenue and Net Income, 2009-2015
Exxon Mobil’s Lubricant Applications and Products
Chevron’s Revenue and Net Income, 2009-2015
Lubricant Product Series of Chevron Caltex
Total’s Revenue and Net Income, 2012-2015
FUCHS’ Development History in China
Lubricant Product Structure of FUCHS (China)
Some Lubricant Downstream Customers of FUCHS
Ashland’s Revenue and Net Income, 2012-2015
Revenue and Net Income of ConocoPhillips, 2009-2015
PetroChina’s Revenue and Net Income, 2009-2015
PetroChina’s Revenue (by Region), 2009-2014
PetroChina’s Revenue Structure (by Region), 2009-2014
PetroChina’s Gross Margin, 2009-2014
PetroChina’s Gross Margin by Product, 2009-2014
PetroChina’s Lubricant Sales Volume and Average Price, 2009-2014
PetroChina’s Revenue and Net Income, 2014-2018E
Sinopec’s Revenue and Net Income, 2009-2015
Sinopec’s Revenue by Product, 2009-2014
Sinopec’s Gross Margin, 2009-2014
Sinopec’s Gross Margin by Product, 2009-2014
Great Wall's Lubricant Product Series and Applications
Sinopec’s Revenue and Net Income, 2014-2018E
Delian Group’s Service Brands
Delian Group’s Revenue and Net Income, 2009-2015
Delian Group’s Revenue (by Region), 2009-2015
Delian Group’s Revenue by Product, 2013-2015
Delian Group’s Gross Margin, 2009-2015
Delian Group’s Gross Margin by Product, 2013-2015
Delian Group’s Revenue and Gross Margin for Automotive Fine Chemicals, 2013-2015
Delian Group’s R&D Costs and % of Total Revenue, 2012-2014
Distribution of Delian Group’s Parts Production Bases
Delian Group’s Revenue and Net Income, 2014-2018E
Gaoke Petrochemical’s Revenue and Net Income, 2009-2014
Gaoke Petrochemical’s Revenue by Product, 2011-2014
Gaoke Petrochemical’s Revenue by Region, 2011-2014
Gaoke Petrochemical’s Gross Margin, 2009-2014
Gaoke Petrochemical’s Gross Margin by Product, 2009-2014
Gaoke Petrochemical’s R&D Costs and % of Total Revenue, 2011-2014
Gaoke Petrochemical’s Sales Volume (by Product), 2012-2014
Gaoke Petrochemical’s Sales Volume (by Application), 2012-2014
Gaoke Petrochemical’s Capacity and Output, 2011-2014
Name list and Revenue Contribution of Gaoke Petrochemical’s Major Clients,2012-2014
Name list and Procurement of Gaoke Petrochemical’s Major Suppliers and % of Total Procurement, 2012-2014
Gaoke Petrochemical’s Revenue and Net Income, 2014-2018E
Copton’s Revenue and Net Income, 2011-2014
Copton’s Revenue (by Product), 2011-2014
Copton’s Revenue (by Region), 2011-2014
Copton’s Gross Margin, 2011-2014
Copton’s Gross Margin (by Product), 2011-2014
Copton’s R&D Costs and % of Total Revenue, 2011-2014
Copton’s Capacity, Output and Sales Volume (by Product), 2011-2014
Copton’s Top Five Suppliers, 2011-2014
Copton’s Top Five Clients, 2011-2014
Copton’s Revenue and Net Income, 2014-2018E
Revenue and Net Income of Sure Energy, 2010-2015
Revenue of Sure Energy (by Product), 2014
Gross Margin of Sure Energy, 2010-2015
Top Five Clients of Sure Energy, 2014
Revenue and Net Income of Sure Energy, 2014-2018E
China’s Lubricant Output and Demand, 2014-2018E
Revenue of Major Companies in China Lubricant Industry, 2009-2015
Net Income of Major Companies in China Lubricant Industry, 2009-2015
Net Profit Margin of Major Companies in China Lubricant Industry, 2009-2013
Gross Margin of Major Companies in China Lubricant Industry, 2009-2015
Global and China Synthetic Rubber Industry Report, 2021-2027
Synthetic rubber is a polymer product made of coal, petroleum and natural gas as main raw materials and polymerized with dienes and olefins as monomers, which is typically divided into general synthet...
Global and China Carbon Fiber Industry Report, 2021-2026
Carbon fiber is a kind of inorganic high performance fiber (with carbon content higher than 90%) converted from organic fiber through heat treatment. As a new material with good mechanical properties,...
China Coal Tar Industry Report, 2020-2025
Coal tar is a thick dark liquid which is a by-product of the production of coke and coal gas from coal. It can be classified by the dry distillation temperature into low-temperature coal tar, medium-t...
Global and China Dissolving Pulp Industry Report, 2019-2025
In 2018, global dissolving pulp capacity outstripped 10 million tons and its output surged by 14.0% from a year ago to 7.07 million tons, roughly 70% of the capacity. China, as a key supplier of disso...
Global and China 1, 4-butanediol (BDO) Industry Report, 2019-2025
1,4-butanediol (BDO), an essential organic and fine chemical material, finds wide application in pharmaceuticals, chemicals, textile and household chemicals.
As of the end of 2018, the global BDO cap...
Global and China Carbon Fiber and CFRP Industry Report, 2019-2025
Among the world’s three major high performance fibers, carbon fiber features the highest strength and the highest specific modulus. It is widely used in such fields as aerospace, sports and leisure.
...
Global and China Natural Rubber Industry Report, 2019-2025
In 2018, global natural rubber industry continued remained at low ebb, as a result of economic fundamentals. Global natural rubber price presented a choppy downtrend and repeatedly hit a record low in...
Global and China Ultra High Molecular Weight Polyethylene (UHMWPE) Industry Report, 2019-2025
Ultra high molecular weight polyethylene (UHMWPE), a kind of linear polyethylene with relative molecular weight of above 1.5 million used as an engineering thermoplastic with excellent comprehensive p...
China Polyether Monomer Industry Report, 2019-2025
China has seen real estate boom and issued a raft of policies for continuous efforts in improving weak links in infrastructure sector over the years. Financial funds of RMB1,663.2 billion should be al...
Global and China Needle Coke Industry Report, 2019-2025
Needle coke with merits of good orientation and excellent conductivity and thermal conductivity, is mainly used in graphite electrodes for electric steelmaking and lithium battery anode materials.
A...
Global and China Viscose Fiber Industry Report, 2019-2025
Over the recent years, the developed countries like the United States, Japan and EU members have withdrawn from the viscose fiber industry due to environmental factor and so forth, while the viscose f...
China Coal Tar Industry Report: Upstream (Coal, coke), Downstream (Phenol Oil, Industrial Naphthalene, Coal Tar Pitch), 2019-2025
Coal tar is a key product in coking sector. In 2018, China produced around 20 million tons of coal tar, a YoY drop of 2.4% largely due to a lower operating rate of coal tar producers that had to be su...
Global and China Synthetic Rubber (BR, SBR, EPR, IIR, NBR, Butadiene, Styrene, Rubber Additive) Industry Report, 2018-2023
In 2018, China boasted a total synthetic rubber capacity of roughly 6,667kt/a, including 130kt/a new effective capacity. Considering capacity adjustment, China’s capacity of seven synthetic rubbers (B...
Global and China Dissolving Pulp Industry Report, 2018-2022
With the commissioning of new dissolving pulp projects, the global dissolving pulp capacity had been up to about 8,000 kt by the end of 2017. It is worth noticing that the top six producers including ...
Global and China Carbon Fiber and CFRP Industry Report, 2018-2022
As a new generation of reinforced fiber boasting intrinsic properties of carbon material and excellent processability of textile fiber, carbon fiber is the one with the highest specific strength and s...
Global and China Ultra High Molecular Weight Polyethylene (UHMWPE) Industry Report, 2017-2021
Ultra High Molecular Weight Polyethylene (UHMWPE), a kind of linear polyethylene with relative molecular weight of above 1.5 million and an engineering thermoplastic with excellent comprehensive prope...
China Coal Tar Industry Report, 2017-2021
Coal tar, one of by-products in raw coal gas generated from coal pyrolysis in coking industry, accounts for 3%-4% of the output of coal as fired and is a main raw material in coal chemical industry.
...
Global and China Aramid Fiber Industry Report, 2017-2021
Global aramid fiber output totaled 115kt with capacity utilization of 76.0% in 2016. As industries like environmental protection and military develop, the output is expected to rise to 138kt and capac...