China Coal Tar Industry Report, 2017-2021
-
Sep.2017
- Hard Copy
- USD
$2,700
-
- Pages:124
- Single User License
(PDF Unprintable)
- USD
$2,500
-
- Code:
ZHP066
- Enterprise-wide License
(PDF Printable & Editable)
- USD
$3,900
-
- Hard Copy + Single User License
- USD
$2,900
-
Coal tar, one of by-products in raw coal gas generated from coal pyrolysis in coking industry, accounts for 3%-4% of the output of coal as fired and is a main raw material in coal chemical industry.
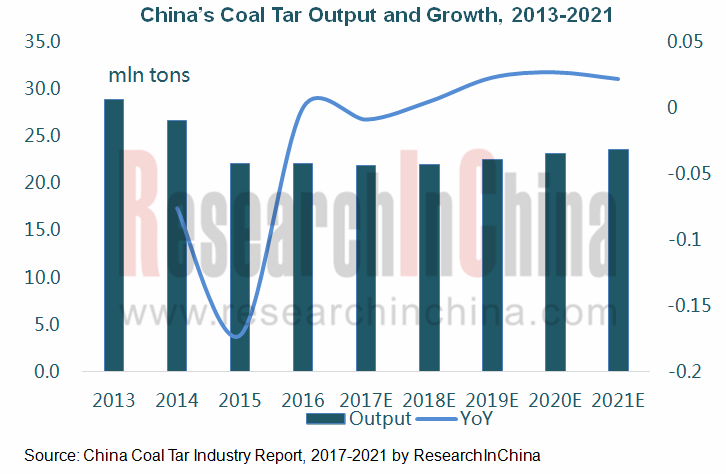
China produced 22.13 million tons of coal tar in 2016, edging up 0.1% from a year earlier, largely due to rising prices of raw materials and environmental protection campaigns. As the government intensifies crackdown on illegal polluters, coal tar output will further slip to 21.90 million tons in 2017. With phase-out of outdated capacity, the coal tar industry will gradually pick up over the next couple of years, thus stimulating coal tar output to grow again. The country’s coal tar output is expected to rise at a CAGR of around 1.5% during 2017-2021.
High-temperature coal tar holds a dominant position in the Chinese market. In 2016, 16.20 million tons of high-temperature coal tar and 3.99 million tons of medium-temperature coal tar were produced, making up 73.1% and only 18.1% of total coal tar output, respectively. As high-temperature coal tar is primarily used in high value-added chemicals while medium-temperature coal tar in fuel oil field, it is expected the former will grow faster than the latter.
Around 70% of China-made coal tar is used in further processing fields. Moreover, China is a major further processor of coal tar in the world, boasting one-fourth of global coal tar deep-processing capacity in 2016. China was capable of intensively processing 24.80 million tons of coal tar in 2016, down 2.7% from 2015, mainly due to de-capacity after years of rapid expansion which caused massive over-capacity and then dramatic decline in utilization. Hence, the demand for coal tar from deep-processing fields has slowed in recent two years.
Global major coal tar deep-processing enterprises include Koppers (United States), Ruetgers (Germany), Nippon Steel & Sumikin Chemical (Japan) and Baoshun Technology (China). Koppers is the world’s largest coal tar deep-processing firm with capacity of 2.10 million t/a, while Baoshun Technology is the biggest coal tar deep-processing company in China with the capacity of 1.05 million t/a. The Chinese coal tar deep-processing market features low concentration, with top10 players occupying a combined 26.2% market share in 2016.
After five years of decline amid fluctuations, coal tar price rallied in 2016 from RMB1,400/t or so at the beginning of the year to around RMB2,200/t at the end of the year at a growth rate of over 50%, and remained between RMB2,500/t and RMB3,000/t during Jan-Sept 2017. Price pick-up is mainly fueled by decreased excess capacity and a recovery in downstream market. Thanks to an upturn in coal tar pitch, industrial naphthalene and phthalic anhydride sectors, high-temperature coal tar found a higher utilization rate and steadily rising prices which, on average, were higher than that of medium and low-temperate coal tar.
China Coal Tar Industry Report, 2017-2021 highlights the following:
 Coal tar (overview, classification, application, main manufacturing techniques, etc.);
Chinese coal tar (high-temperature coal tar, medium-temperature coal tar) market (policy environment, supply & demand, import & export, prices, development trends, etc.);
Upstream sectors (coal, coke) of coal car in China (market size/structure, import & export, market prices, etc.);
Downstream deep-processing sectors (phenol, industrial naphthalene, coal tar pitch) of coal tar in China (market size, import & export, market prices, etc.);
Coal tar industry in China (regional/enterprise/product competitive landscape);
Three foreign and twelve Chinese coal tar producers (operation, coal tar business, etc.)
1. Overview of Coal Tar
1.1 Definition & Classification
1.2 Preparation
1.3 Application
1.4 Key Technologies
1.4.1 Coal Tar Distillation
1.4.2 Industrial Naphthalene Distillation
1.4.3 Elution of Fraction from Coal tar Distillation
1.4.4 Refining of Crude Anthracene
1.4.5 Decomposition of Hydroxybenzene Natrium Salt
1.4.6 Preparation of Naphthalene
1.4.7 Refining of Crude Hydroxybenzene
1.4.8 Refining of Crude Pyridine and Crude Quinoline
1.4.9 Production of Refined Anthracene, Refined Carbazole and Anthraquinone
2. Development Environment for China Coal Tar Industry
2.1 Policy Environment
2.2 Supply
2.2.1 High-temperature Coal Tar
2.2.2 Medium-temperature Coal Tar
2.2.3 Low-temperature Coal Tar
2.3 Demand
2.3.1 Demand from Deep Processing
2.3.2 Demand from Carbon Black
2.3.3 Demand from Fuel
2.4 Import and Export
2.4.1 Export
2.4.2 Import
2.4.3 Price
2.5 Market Price
2.5.1 High-temperature Coal Tar
2.5.2 Medium-temperature Coal Tar
2.5.3 Low-temperature Coal Tar
2.6 Development Trends
3 Upstream Sectors of Coal Tar in China
3.1 Coal Industry
3.1.1 Market Size
3.1.2 Structure
3.1.3 Price
3.1.4 Import & Export
3.2 Coke Industry
3.2.1 Supply and Demand
3.2.2 Import & Export
3.2.3 Price
4 Downstream Deep-processing Sectors of Coal Tar in China
4.1 Phenol Oil
4.1.1 Phenol
4.1.2 O-cresol
4.1.3 M-cresol and P-cresol
4.1.4 Mixed Cresol
4.2 Industrial Naphthalene
4.2.1 Production
4.2.2 Consumption
4.2.3 Import and Export
4.2.4 Price
4.3 Coal Tar Pitch
4.3.1 Supply and Demand
4.3.2 Application Market
4.3.3 Price Trend
4.4 Others
4.4.1 Anthracene Oil
4.4.2 Light Oil
4.4.3 Wash Oil
5. Coal Tar Industry Competition in China
5.1 Regional Competition
5.1.1 Shanxi
5.1.2 Hebei
5.1.3 Shandong
5.2 Enterprise Competition
5.3 Product Competition
6. Major Global Coal Tar Companies
6.1 Koppers
6.1.1 Profile
6.1.2 Operation
6.1.3 Operation of Carbon Materials & Chemicals Segment
6.1.4 Business in China
6.2 RüTGERS Group
6.2.1 Profile
6.2.2 Operation
6.3 Nippon Steel & Sumikin Chemical Co. Ltd
6.3.1 Profile
6.3.2 Operation
7. Major Chinese Coal Tar Companies
7.1 Shanxi Coking Group Co., Ltd.
7.1.1 Profile
7.1.2 Operation
7.1.3 Project Investment
7.2 Shanxi Hongte Coal Chemical Industry Co., Ltd.
7.2.1 Profile
7.2.2 Capacity Expansion
7.3 Shanghai Baosteel Chemical Co., Ltd
7.3.1 Profile
7.3.2 Operation
7.3.3 Key Projects
7.4 Baoshun Technology Co., Ltd.
7.4.1 Profile
7.4.2 Operation
7.4.3 Coal Tar Business
7.5 Wuhan Iron and Steel (Group) Corp.
7.5.1 Profile
7.5.2 Operation
7.5.3 Coal Tar Business
7.6 Jiangxi Black Cat Carbon Black Inc., Ltd.
7.6.1 Profile
7.6.2 Operation
7.6.3 Coal Tar Business
7.7 Guanghui Energy Co., Ltd.
7.7.1 Profile
7.7.2 Operation
7.7.3 Coal Tar Business
7.8 Huanghua Xinnuolixing Fine Chemical Stock Company Limited
7.8.1 Profile
7.8.2 Operation
7.8.3 Customers and Suppliers
7.8.4 Key Projects
7.9 Shenmu Tianyuan Chemical Co., Ltd.
7.9.1 Profile
7.9.2 Coal Tar Business
7.10 JFE Zhenxing Shandong Chemical Company Ltd
7.10.1 Profile
7.10.2 Capacity
7.11 Shanxi Yongdong Chemistry Industry Co., Ltd.
7.11.1 Profile
7.11.2 Operation
7.11.3 Coal Tar Business
7.12 Baotailong New Materials Co., Ltd.
7.12.1 Profile
7.12.2 Operation
7.12.3 Coal Tar Business
Main Products Extracted from High-temperature Coal Tar and Their Applications
Policies on Coal Chemical Industry in China
Coal Tar Output and Growth Rate in China, 2013-2021E
Coal Tar Output Structure in China by Product, 2016
High Temperature Coal Tar Capacity and YoY Growth, 2010-2021E
Operating Rate of High Temperature Coal Tar in China, 2017
High Temperature Coal Tar Output and YoY Growth in China, 2010-2021E
High Temperature Coal Tar Output Structure in China by Region, 2016
Medium Temperature Coal Tar Output in China, 2013-2021E
Operating Rate of Medium Temperature Coal Tar in China, 2017
Apparent Consumption of Coal Tar in China, 2013-2021E
Monthly Supply and Demand of Coal Tar in China, 2017
High Temperature Coal Tar Demand in China, 2015-2021E
Consumption Structure of Coal Tar in China, 2016
Amount of Coal Tar Processed in China, 2007-2017
Carbon Black Output and Coal Tar Consumption in China, 2007-2017
China’s Coal Tar Export Volume, 2007-2017
Export Destinations of Coal Tar from China by Export Volume, 2016
China’s Coal Tar Import Volume, 2007-2017
Import Sources of Coal Tar in China by Import Volume, 2016
Average Import and Export Price of Coal Tar in China, 2010-2017
Price Trend of Coal Tar in North China, 2009-2016
Price Trend of Coal Tar in China, 2016
Price of Coal Tar in China, 2017
Price of High Temperature Coal Tar in China, 2014-2016
Price of High Temperature Coal Tar in China, 2017
Price of Medium Temperature Coal Tar in China, 2016-2017
Distribution of Anthracite Reserves in China
Anthracite Output and YoY Growth in China, 2009-2017
Apparent Consumption of Anthracite in China, 2009-2017
Anthracite Output Structure in China by Region, 2015
Price Trend of Thermal Coal in China, 2010-2016
Price Trend of Anthracite in China, 2010-2016
YoY Growth in Average Price of Anthracite in China, 2016-2017
China’s Anthracite Import Volume, 2009-2016
China’s Anthracite Export Volume, 2009-2016
Coke Capacity and Output in China, 2009-2021E
Coke Output Structure in China by Province, 2016
China’s Coke Apparent Consumption, 2007-2021E
Coke Demand Structure in China by Sector, 2016
China’s Coke Import and Export Volume, 2007-2016
Import and Export Prices of Coke in China, 2009-2016
Price Trend of Coke in China, 2016-2017
Global Coal Tar Deep Processing Capacity Structure by Region, 2016
China’s Coal Tar Processing Capacity, 2007-2021E
Coal Tar Deep Processing Capacity Structure in China by Region, 2017
Capacity of Major Coal Tar Deep Processing Companies in China, 2017
Internationally Famous Coal Tar Deep Processing Techniques and Their Characteristics
Coal Tar Processing Procedure in China
Phenol Capacity in China, 2010-2021E
Phenol Producers and Their Capacities in China, 2016
Operating Rate of Phenol Installations in China, 2016-2017
Phenol Capacity Planed/under Construction in China, 2017
China’s Phenol Export & Import Volume, 2009-2017
Average Import and Export Price of Phenol in China, 2009-2016
China’s O-cresol Import and Export Volume, 2009-2017
Average Import and Export Price of O-cresol in China, 2009-2016
Monthly Import Volume and Average Price of M-cresol in China, 2016-2017
Monthly Export Volume and Average Price of M-cresol in China, 2016-2017
China’s Industrial Naphthalene Output, 2010-2021E
China’s Consumption Structure of Industrial Naphthalene, 2016
China’s Industrial Naphthalene Import and Export Volume, 2009-2016
Average Import and Export Price of Industrial Naphthalene in China, 2009-2016
Price Trend of Industrial Naphthalene in North China, 2009-2016
Price of Industrial Naphthalene in China, 2017
Monthly Output of Coal Tar Pitch in China, 2015-2017
China’s Coal Tar Pitch Import and Export Volume, 2009-2017
Average Import and Export Price of Coal Tar Pitch in China, 2009-2016
Coal Tar Pitch Import Structure in China by Region, 2016
Coal Tar Pitch Export Structure in China by Region, 2016
Coal Tar Pitch Demand Structure in China, 2016
Price Trend of Modified Coal Tar Pitch in China, 2014-2017
Price Trend of Anthracene Oil in China, 2013-2017
Price Trend of Wash Oil in China, 2016
Geographical Distribution of Coal Tar Output in China, 2013-2016
Coal Tar Output and Growth Rate in Shanxi Province, 2012-2021E
Capacity of Main Coal Tar Deep-processing Companies in Shanxi, 2016
New Coal Tar Deep Processing Capacity in Shanxi Province, 2010-2020E
Shanxi’s Coal Tar Deep Processing Projects, 2017
Coal Tar Output and Growth Rate in Hebei Province, 2012-2021E
Capacity of Main Coal Tar Deep-processing Companies in Hebei, 2016
Coal Tar Output and Growth Rate in Shandong Province, 2012-2021E
Capacity of Main Coal Tar Deep-processing Companies in Shandong, 2016
Capacity of Main Coal Tar Deep-processing Companies in China, 2016
Statistics on Capacity and Products of Global Coal Tar Companies, 2016
Presence of Koppers’ Production Bases
Carbon Materials and Chemicals of Koppers
Net Sales and Net Income of Koppers, 2010-2017
Net Sales Structure (%) of Koppers by Division, 2012-2017
Net Sales Structure (%) of Koppers by Region, 2012-2016
Application Structure of Koppers’ Products, 2016
Koppers’ Coal Tar Processing Technology
Net Sales and Operating Income of Koppers’ Carbon Materials & Chemicals Division, 2010-2017
Distribution of Production Bases of Koppers’ Carbon Materials & Chemicals Division
Revenue Structure (by Product) of Koppers’ Carbon Materials & Chemicals Division, 2011-2016
Subsidiaries and Capacity of Rutgers
Net Sales and Net Income of Nippon Steel & Sumikin Chemical, FY2009-FY2015
Major Products of Nippon Steel & Sumikin Chemical
Revenue and Net Income of Shanxi Coking Group, 2010-2017
Output (by Product) of Shanxi Coking Group, 2013-2016
Sales Volume (by Product) of Shanxi Coking Group, 2013-2016
Revenue Structure (by Product) of Shanxi Coking Group, 2012-2016
Capacity and Capacity Utilization of Shanxi Coking Group’s Main Products, 2016
Gross Margin (by Product) of Shanxi Coking Group, 2010-2016
Sales of Shanghai Baosteel Chemical, 2007-2016
Development Course of Shanghai Baosteel Chemical
Industrial Layout of Baoshun Technology
Revenue of Henan Baoshun Technology, 2011-2016
Revenue Structure of Henan Baoshun Technology by Product, 2011-2015
Gross Margin of Baoshun Technology by Product, 2011-2015
Production Bases and Product Capacity of Henan Baoshun Chemical Technology, 2016
Output Breakdown of Baoshun Chemical by Product, 2011-2015
Revenue and Net Income of Wuhan Iron and Steel (Group), 2010-2016
Revenue and Net Income of Jiangxi Black Cat Carbon Black, 2010-2017
Revenue Structure (by Product) of Jiangxi Black Cat Carbon Black, 2012-2017
Revenue Structure (by Region) of Jiangxi Black Cat Carbon Black, 2012-2017
Gross Margin (by Product) of Jiangxi Black Cat Carbon Black, 2010-2017
Output and Sales Volume of Refined Coal Tar Products of Jiangxi Black Cat Carbon Black, 2015-2016
Revenue and Net Income of Guanghui Energy, 2010-2017
Revenue and Net Income of Huanghua Xinnuolixing Fine Chemical, 2013-2017
Revenue Structure (by Region) of Huanghua Xinnuolixing Fine Chemical, 2013-2016
Huanghua Xinnuolixing Fine Chemical’s Revenue from Top 5 Clients and % of Total Revenue, 2013-2016
Name List and Revenue Contribution of Huanghua Xinnuolixing Fine Chemical’s major Clients, 2016
uanghua Xinnuolixing Fine Chemical’s Procurement from Top 5 Suppliers and % of Total Procurement, 2013-2016
Name List and Procurement Contribution of Huanghua Xinnuolixing Fine Chemical’s major Suppliers, 2016
Revenue and Net Income of Shanxi Yongdong Chemistry Industry, 2012-2017
Revenue Structure (by Product) of Shanxi Yongdong Chemistry Industry, 2013-2017
Revenue Structure (by Region) of Shanxi Yongdong Chemistry Industry, 2013-2017
Gross Margin of Main Products of Shanxi Yongdong Chemistry Industry, 2012-2017
Output and Sales Volume of Coal Tar Deep-processed Products of Shanxi Yongdong Chemistry Industry, 2012-2016
Revenue and Net Income of Qitaihe Baotailong Coal & Coal Chemicals Public, 2011-2017
Capacity of Main Products of Qitaihe Baotailong Coal & Coal Chemicals Public, 2016
Global and China Synthetic Rubber Industry Report, 2021-2027
Synthetic rubber is a polymer product made of coal, petroleum and natural gas as main raw materials and polymerized with dienes and olefins as monomers, which is typically divided into general synthet...
Global and China Carbon Fiber Industry Report, 2021-2026
Carbon fiber is a kind of inorganic high performance fiber (with carbon content higher than 90%) converted from organic fiber through heat treatment. As a new material with good mechanical properties,...
China Coal Tar Industry Report, 2020-2025
Coal tar is a thick dark liquid which is a by-product of the production of coke and coal gas from coal. It can be classified by the dry distillation temperature into low-temperature coal tar, medium-t...
Global and China Dissolving Pulp Industry Report, 2019-2025
In 2018, global dissolving pulp capacity outstripped 10 million tons and its output surged by 14.0% from a year ago to 7.07 million tons, roughly 70% of the capacity. China, as a key supplier of disso...
Global and China 1, 4-butanediol (BDO) Industry Report, 2019-2025
1,4-butanediol (BDO), an essential organic and fine chemical material, finds wide application in pharmaceuticals, chemicals, textile and household chemicals.
As of the end of 2018, the global BDO cap...
Global and China Carbon Fiber and CFRP Industry Report, 2019-2025
Among the world’s three major high performance fibers, carbon fiber features the highest strength and the highest specific modulus. It is widely used in such fields as aerospace, sports and leisure.
...
Global and China Natural Rubber Industry Report, 2019-2025
In 2018, global natural rubber industry continued remained at low ebb, as a result of economic fundamentals. Global natural rubber price presented a choppy downtrend and repeatedly hit a record low in...
Global and China Ultra High Molecular Weight Polyethylene (UHMWPE) Industry Report, 2019-2025
Ultra high molecular weight polyethylene (UHMWPE), a kind of linear polyethylene with relative molecular weight of above 1.5 million used as an engineering thermoplastic with excellent comprehensive p...
China Polyether Monomer Industry Report, 2019-2025
China has seen real estate boom and issued a raft of policies for continuous efforts in improving weak links in infrastructure sector over the years. Financial funds of RMB1,663.2 billion should be al...
Global and China Needle Coke Industry Report, 2019-2025
Needle coke with merits of good orientation and excellent conductivity and thermal conductivity, is mainly used in graphite electrodes for electric steelmaking and lithium battery anode materials.
A...
Global and China Viscose Fiber Industry Report, 2019-2025
Over the recent years, the developed countries like the United States, Japan and EU members have withdrawn from the viscose fiber industry due to environmental factor and so forth, while the viscose f...
China Coal Tar Industry Report: Upstream (Coal, coke), Downstream (Phenol Oil, Industrial Naphthalene, Coal Tar Pitch), 2019-2025
Coal tar is a key product in coking sector. In 2018, China produced around 20 million tons of coal tar, a YoY drop of 2.4% largely due to a lower operating rate of coal tar producers that had to be su...
Global and China Synthetic Rubber (BR, SBR, EPR, IIR, NBR, Butadiene, Styrene, Rubber Additive) Industry Report, 2018-2023
In 2018, China boasted a total synthetic rubber capacity of roughly 6,667kt/a, including 130kt/a new effective capacity. Considering capacity adjustment, China’s capacity of seven synthetic rubbers (B...
Global and China Dissolving Pulp Industry Report, 2018-2022
With the commissioning of new dissolving pulp projects, the global dissolving pulp capacity had been up to about 8,000 kt by the end of 2017. It is worth noticing that the top six producers including ...
Global and China Carbon Fiber and CFRP Industry Report, 2018-2022
As a new generation of reinforced fiber boasting intrinsic properties of carbon material and excellent processability of textile fiber, carbon fiber is the one with the highest specific strength and s...
Global and China Ultra High Molecular Weight Polyethylene (UHMWPE) Industry Report, 2017-2021
Ultra High Molecular Weight Polyethylene (UHMWPE), a kind of linear polyethylene with relative molecular weight of above 1.5 million and an engineering thermoplastic with excellent comprehensive prope...
China Coal Tar Industry Report, 2017-2021
Coal tar, one of by-products in raw coal gas generated from coal pyrolysis in coking industry, accounts for 3%-4% of the output of coal as fired and is a main raw material in coal chemical industry.
...
Global and China Aramid Fiber Industry Report, 2017-2021
Global aramid fiber output totaled 115kt with capacity utilization of 76.0% in 2016. As industries like environmental protection and military develop, the output is expected to rise to 138kt and capac...