Global and China Activated Carbon Industry Report, 2016-2020
-
May 2016
- Hard Copy
- USD
$2,500
-
- Pages:126
- Single User License
(PDF Unprintable)
- USD
$2,300
-
- Code:
ZHP037
- Enterprise-wide License
(PDF Printable & Editable)
- USD
$3,500
-
- Hard Copy + Single User License
- USD
$2,700
-
Activated carbon, a functional carbon material with properties of physical and chemical adsorption, can be divided into coal-based activated carbon, wood-based activated carbon, and other activated carbons.
In 2015, global activated carbon capacity approximated 2.1 million tons (mainly distributed in China, the United States, Japan, and Europe), compared with total demand of only about 1.547 million tons, indicating a huge excess capacity across the entire industry and further capacity integration or elimination in the future.
As the world’s largest producer of activated carbon, China’s capacity and output of activated carbon reached roughly 900,000 tons and about 628,000 tons (up 6.6% year on year) respectively in 2015, with autilization of 69.8%. Driven by environmental protection and automobile industries, China’s activated carbon industry will continue to grow steadily in the future at an output CAGR of around 7.4% during 2016-2020.
Besides satisfying domestic demand, about 1/3 of China-made activated carbon is exported. The country exported 251,000 tons of activated carbon, including 58,000 tons of wood-based activated carbon, mainly to Japan, Peru, and Indonesia, and 193,000 tons of other activated carbons, primarily to Japan, South Korea, and Belgium.
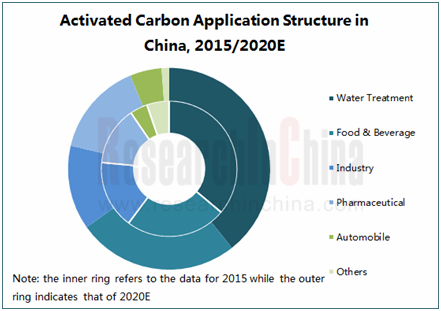
Water treatment and food & beverage are two application fields of activated carbon in China, together making up 60.2% of total demand in 2015, with the former mainly adopting granular activated carbon and the latter powdered activated carbon.
Major global activated carbon manufacturers include U.S. Calgon, Cabot, and Meadwestvaco, Japanese Kuraray and Osaka Gas, French CECA, and Chinese Fujian Yuanli Active Carbon, Datong Coal Mining Jinding Activated Carbon, and Shanxi Xinhua Chemical. Calgon is the world’s largest activated carbon producer with a 21.2% global market share, Fujian Yuanli Active Carbon is the largest wood-based activated carbon maker in China, seizing about 21.7% of the Chinese wood-based activated carbon market, and Datong Coal Mining Jinding Activated Carbon is the country’s largest coal-based activated carbon manufacturer, occupying 16.7% or so of the segment in China.
Global and China Activated Carbon Industry Report, 2016-2020 by ResearchInChina highlights the followings:
 Global activated carbon industry (overview, market size/structure, demand in major countries, etc.);
China’s activated carbon industry (overview, development environment, output/sales, patent, price, market structure, imports/exports, competitive landscape, development trends, etc.);
Main upstream sectors (wood cutting/processing, chemical activator, coal) (market size/price/structure, etc.);
Main applications (water treatment, food & beverage, automobile, pharmaceuticals, etc.) (development, product application, etc.);
6 global and 19 Chinese activated carbon producers (operation, presence in China, activated carbon business, etc.).
1 Overview of Activated Carbon Industry
1.1 Definition
1.2 Classification
1.3 Application and Sales Model
2 Global Activated Carbon Industry
2.1 Overview
2.2 Market Size
2.3 Market Structure
2.4 Major Countries/Regions
2.4.1 USA
2.4.2 Japan
2.4.3 Russia
2.4.4 Western Europe
2.4.5 Asia
3 Activated Carbon Industry in China
3.1 Overview
3.2 Development Environment
3.2.1 Regulatory System
3.2.2 Industry Policy
3.2.3 Trade Policy
3.3 Market Size
3.3.1 Output/Sales
3.3.2 Patent
3.3.3 Price
3.4 Market Structure
3.5 Imports/Exports
3.5.1 Imports
3.5.2 Exports
3.6 Competitive Landscape
3.6.1 Regional
3.6.2 Enterprise
3.7 Development Trends
3.7.1 Demand for Wood-based Activated Carbon Ascends
3.7.2 Some Weak Small Firms will Retreat from the Market
3.7.3 M&Rs will Continue, and the Concentration Rate of the Industry will Climb
3.7.4 The Industry Tends to be Scaled up and Standardized
3.7.5 Product Quality will be Improved
4 Main Upstream Sectors of Activated Carbon
4.1 Wood Cutting & Processing Industry
4.1.1 Output Value
4.1.2 Output
4.2 Chemical Activators (Phosphoric Acid, Zinc Chloride, etc.)
4.3 Coal Industry
4.3.1 Output
4.3.2 Structure
4.3.3 Price
4.3.4 Imports
5 Main Applications of Activated Carbon
5.1 Water Treatment Sector
5.1.1 Application of Activated Carbon in Water Treatment
5.1.2 Status Quo of Water Treatment Sector
5.2 Food & Beverage Sector
5.2.1 Application of Activated Carbon in Food & Beverage I Sector
5.2.2 Status Quo of Food & Beverage Sector
5.3 Pharmaceuticals Sector
5.3.1 Application of Activated Carbon in Pharmaceuticals Industry
5.3.2 Status Quo of Pharmaceuticals Sector
5.4 Automobile Sector
5.4.1 Application of Activated Carbon in Automobile Sector
5.4.2 Status Quo of Automobile Sector
5.5 Chemical and Metallurgy Sectors
6. Leading Activated Carbon Companies Worldwide
6.1 Calgon
6.1.1 Profile
6.1.2 Operation
6.1.3 Revenue Structure
6.1.4 Gross Margin
6.1.5 R&D and Investment
6.1.6 Development in China
6.1.7 Activated Carbon Business
6.2 Cabot
6.2.1 Profile
6.2.2 Operation
6.2.3 Revenue Structure
6.2.4 Gross Margin
6.2.5 Activated Carbon Business
6.3 Meadwestvaco
6.3.1 Profile
6.3.2 Operation
6.3.3 Revenue Structure
6.3.4 Gross Margin
6.3.5 Activated Carbon Business
6.4 Kuraray
6.4.1 Profile
6.4.2 Development in China
6.5 Osaka Gas Chemicals Group
6.5.1 Profile
6.5.2 Osaka Gas Chemicals (OGC)
6.5.3 Japan EnviroChemicals (JEC)
6.6 CECA
7. Leading Wood-based Activated Carbon Enterprises in China
7.1 Fujian Yuanli Active Carbon
7.1.1 Profile
7.1.2 Operation
7.1.3 Revenue Structure
7.1.4 Gross Margin
7.1.5 R&D and Investment
7.1.6 Customers and Suppliers
7.1.7 Production and Sales
7.1.8 Activated Carbon Business
7.2 Fujian Xinsen Carbon
7.2.1 Profile
7.2.2 Activated Carbon Business
7.2.3 Development
7.3 Fujian Zhixing Activated Carbon
7.3.1 Profile
7.3.2 Operation
7.3.3 R&D
7.3.4 Activated Carbon Business
7.4 QuzhouYunhe Carbon
7.4.1 Profile
7.4.2 Operation
7.5 Shanghai Xingchang Activated Carbon
7.5.1 Profile
7.5.2 Activated Carbon Business
7.6 GuizhouQianmin Activated Carbon
7.6.1 Profile
7.6.2 Activated Carbon Business
7.7 Others
7.7.1 Jiangsu Zhuxi Activated Carbon
7.7.2 Hangzhou Hengxing Activated Carbon
7.7.3 ChifengZhonglinZhongtian Chemical Industry
7.7.4 Golden Lake Carbon
7.7.5 Datong Locomotive Coal
8. Major Coal-based Activated Carbon Enterprises in China
8.1 Datong Coal Jinding Activated Carbon
8.1.1 Profile
8.1.2 Activated Carbon Business
8.2 Shanxi Xinhua Chemical
8.2.1 Profile
8.2.2 Shanxi Xinhua Activated Carbon
8.3 Ningxia Huahui Activated Carbon
8.3.1 Profile
8.3.2 Operation
8.4 Inner Mongolia Taixi Coal
8.4.1 Profile
8.4.2 Operation
8.4.3 Activated Carbon Business
8.5. Shanxi Huaqing Activated Carbon
8.5.1 Profile
8.5.2 Operation
8.5.3 Major Customers and Suppliers
8.5.4 Activated Carbon Business
8.6 Others
8.6.1 Datong Municipal Yunguang Activated Carbon
8.6.2 Ningxia Guanghua-Cherishmet Activated Carbon
8.6.3 HuairenHuanyu Purification Materials
9 Summary and Forecast
9.1 Industry
9.2 Enterprise
Classification and Brief Introduction of Activated Carbon
Difference between Wood-based Activated Carbon and Coal-based Activated Carbon
Application and Sales Model of Activated Carbon
History of Global Activated Carbon Development
Global Demand for Activated Carbon and YoY Growth, 2008-2020E
Global Activated Carbon Market Size, 2012-2020E
Structure of Key Activated Carbon Supply Regions Worldwide (by Capacity), 2015
Global Activated Carbon Demand Structure by Terminal Application, 2015
Global Activated Carbon Application Structure, 2015
Global Activated Carbon Demand Structure (by Product), 2015
Demand for Activated Carbon in USA, 2014-2020E
Activated Carbon Demand Structure in USA by Application, 2015
Demand for Activated Carbon in Japan, 2005-2020E
Activated Carbon Demand Structure in Japan by Application, 2015
Output of Activated Carbon in Russia, 2012-2020E
Activated Carbon Demand Structure in Western Europe by Application, 2015
Distribution of Main Activated Carbon Production Areas in China
Policies on Chinese Activated Carbon Industry, 2003-2016
Name List of Chinese Activated Carbon Enterprises Exposed to Anti-Dumping Administrative Review Final Launched by USA and Anti-Dumping Duty, 2015
Activated Carbon Output and Growth Rate in China, 2008-2020E
Demand for Activated Carbon and Growth Rate in China, 2010-2020E
Number of Patent Applications for Activated Carbon in China, 2004-2015
Price Trend of Main Activated Carbons in China, 2015-2016
Output Structure of Activated Carbon in China, 2015/2020
Application Structure of Activated Carbon in China, 2015/2020
Import Volume and Import Value of Wood-based Activated Carbon in China, 2010-2016
Top 10 Countries/Regions by Imports of Wood-based Activated Carbon in China, 2015
Import Volume and Import Value of Other Activated Carbons in China, 2010-2016
Top 10 Countries/Regions by Imports of Other Activated Carbons in China, 2015
Export Volume and Export Value of Wood-based Activated Carbon in China, 2010-2016
Top 10 Countries/Regions by Exports of Wood-based Activated Carbon in China, 2015
Export Volume and Export Value of Other Activated Carbons in China, 2010-2016
Top 10 Countries/Regions by Exports of Other Activated Carbons in China, 2015
Capacity Structure of Wood-based Activated Carbon in China (by Region), 2015
Capacity Structure of Wood-based Activated Carbon in China (by Enterprise), 2015
Capacity Structure of Coal-based Activated Carbon in China (by Enterprise), 2015
Total Output Value of Forestry and YoY Growth Rate in China, 2008-2020E
Provinces with Total Output Value of Forestry Exceeding RMB300 Billion in China, 2014
Timber Output and YoY Growth Rate in China, 2008-2020E
Log Output and YoY Growth Rate in China, 2008-2020E
Import Volume and Import Value of Log in China, 2008-2016
Price Trend of Phosphoric Acid (85% Industrial Grade) in China, 2010-2015
Price Trend of Phosphoric Acid (85% Industrial Grade) in China, 2016
Anthracite Output and YoY Growth Rate in China, 2009-2016
Output Structure of Anthracite in China (by Region), 2015
Average Price Trend of Anthracite in China, 2016
Import Structure of Anthracite in China (by Country), 2015
Activated Carbon Consumption in Water Treatment Industry in China, 2014-2020E
Water Consumption Per Capita and YoY Growth Rate in China, 2008-2016
Bottled/Canned Drinking Water Output and YoY Growth Rate in China, 2008-2016
Discharge Volume of Sanitary Sewage and Industrial Wastewater, 2008-2016
Activated Carbon Consumption in Food and Drinks Industry in China, 2014-2020E
Fermentation Industry Demand for Activated Carbon in China (by Product), 2010-2020
Starch Sugar Output and YoY Growth Rate in China, 2008-2016
Sugar Output and YoY Growth Rate in China, 2008-2016
Carbonated Beverage Output and YoY Growth Rate in China, 2008-2016
Activated Carbon Application in Pharmaceuticals
Activated Carbon Consumption in Pharmaceuticals Industry in China, 2014-2020E
CAGR of Pharmaceuticals Industry in the World’s Major Countries, 2011-2015
Output Value and YoY Growth Rate of Pharmaceuticals Industry in China, 2014-2020E
Activated Carbon Consumption in Automotive Industry in China, 2014-2020E
Sales Volume of Passenger Vehicle Worldwide, 2005-2016
Sales Volume of Commercial Vehicle Worldwide, 2005-2016
Automobile Sales Volume of Major Countries in the World, 2015
Changes in China’s Automobile Sales Volume, 2011-2016
Early Warning Index of Auto Dealer Inventory in China, 2014-2016
Sales Volume Structure of Passenger Vehicles in China (by Country), 2015
Competition Pattern of Automotive Market in China, 2015
Calgon's Revenue and Net Income, 2010-2015
Calgon's Revenue (by Division), 2010-2015
Calgon's Revenue Structure (by Division), 2010-2015
Calgon's Revenue (by Region), 2010-2015
Calgon's Revenue (by Product), 2010-2015
Calgon's Gross Margin, 2011-2015
Calgon's R & D Costs and % of Total Revenue, 2010-2015
Calgon's Capital Expenditure and YoY Growth Rate, 2010-2015
Calgon's Revenue in China, YoY Growth Rate and % of Total Revenue, 2010-2015
Main Products of Calgon
Revenue and Net Income of Cabot, FY2010- Q1FY2016
Revenue of Cabot (by Segment), FY2015-Q1FY2016
Revenue Structure of Cabot (by Segment), FY2015-Q1FY2016
Revenue of Cabot (by Region), FY2011-FY2015
Revenue Structure of Cabot (by Region), FY2011-FY2015
Gross Margin of Cabot, FY2011-Q1FY2016
Activated Carbon Revenue, YoY Growth Rate and % of Total Revenue of Cabot, FY2011- Q1FY2016
Main Products of Cabot
MWV's Revenue and Net Income, 2010-2015
MWV Revenue (by Division), 2012-2014
MWV's Revenue Structure (by Division), 2012-2014
MWV's Revenue (by Region), 2010-2014
MWV's Revenue Structure (by Region), 2010-2014
MWV's Gross Margin, 2010-2014
Kuraray’s Subsidiaries
Layout and Information of Activated Carbon Production Plants of Japan EnviroChemicals
Equity Structure of Fujian Yuanli Active Carbon
Subsidiaries of Fujian Yuanli Active Carbon
Revenue and Net Income of Fujian Yuanli Active Carbon, 2010-2015
Revenue Breakdown and Structure of Fujian Yuanli Active Carbon (by Product), 2014-2015
Revenue of Fujian Yuanli Active Carbon (by Region), 2010-2015
Revenue Structure of Fujian Yuanli Active Carbon (by Region), 2010-2015
Gross Margin of Fujian Yuanli Active Carbon, 2010-2015
Gross Margin of Fujian Yuanli Active Carbon (by Region), 2010-2015
R & D Costs and % of Total Revenue of Fujian Yuanli Active Carbon, 2010-2015
Progress of Research Projects of Fujian Yuanli Active Carbon, 2015
Revenue of Fujian Yuanli Active Carbon from Top 5 Clients and % of Total Revenue, 2010-2015
Procurement of Fujian Yuanli Active Carbon from Top 5 Suppliers and % of Total Procurement, 2010-2015
Activated Carbon Output, Sales Volume and Inventory of Fujian Yuanli Active Carbon, 2011-2015
Output and Sales of Wood-based Activated Carbon of Fujian Yuanli Active Carbon, 1999-2015
Main Products of Fujian Yuanli Active Carbon
Activated Carbon Applications of Fujian Xinsen Carbon
Capacity of Fujian Xinsen Carbon (by Product), 2015
Equity Structure of Zhixing Activated Carbon
Revenue and Total Profit of Zhixing Activated Carbon, 2013-2015
Gross Margin of Zhixing Activated Carbon, 2013-2015
Total Assets and Total Liabilities of Zhixing Activated Carbon, 2013-2015
Revenue Breakdown and Structure of Zhixing Activated Carbon (by Region), 2014-2015
Activated Carbon Revenue Structure of Zhixing Activated Carbon (by Applications), 2013-2015
Major Customers of Zhixing Activated Carbon, 2013-2015
50,000 t/a Activated Carbon Deep (Fine) Processing Project Planning of Zhuxi Activated Carbon
Revenue and Total Profit of Yunhe Carbon, 2007-2015
Main Products and Application of Qianmin Activated Carbon
Main Production Lines and Capacity of Xinhua Activated Carbon
Total Assets, Total Revenue, Total Profit, Net Income and Total Liabilities of Xinhua Activated Carbon, 2013-2015
Registered Capital, Total Assets, Net Assets, Revenue and Net Income of Huahui Activated Carbon, 2011-2015
Revenue of Taixi Coal, 2010-2016E
Activated Carbon Output, Sales Volume and Sales-Output Ratio of Taixi Coal, 2010-2015
Total Assets, Total Revenue, Net Income of Huaqing Activated Carbon, 2013-2015
Revenue Breakdown and Structure of Huaqing Activated Carbon (by Region), 2013-2015
Major Customers of Huaqing Activated Carbon, 2013-2015
Major Suppliers of Huaqing Activated Carbon, 2013-2015
Revenue and Gross Margin of Coal-based Activated Carbon of Huaqing Activated Carbon, 2013-2015
Main Products and Applications of Huaqing Activated Carbon
Demand Growth of Global and Chinese Activated Carbon Markets, 2010-2020E
Total Import and Export Volume of Activated Carbon in China, 2010-2015
Applications of Activated Carbon in China, 2014-2020
Competition Pattern of Global Activated Carbon Market, 2015
Competition Pattern of Chinese Activated Carbon Market, 2015
Global and China Synthetic Rubber Industry Report, 2021-2027
Synthetic rubber is a polymer product made of coal, petroleum and natural gas as main raw materials and polymerized with dienes and olefins as monomers, which is typically divided into general synthet...
Global and China Carbon Fiber Industry Report, 2021-2026
Carbon fiber is a kind of inorganic high performance fiber (with carbon content higher than 90%) converted from organic fiber through heat treatment. As a new material with good mechanical properties,...
China Coal Tar Industry Report, 2020-2025
Coal tar is a thick dark liquid which is a by-product of the production of coke and coal gas from coal. It can be classified by the dry distillation temperature into low-temperature coal tar, medium-t...
Global and China Dissolving Pulp Industry Report, 2019-2025
In 2018, global dissolving pulp capacity outstripped 10 million tons and its output surged by 14.0% from a year ago to 7.07 million tons, roughly 70% of the capacity. China, as a key supplier of disso...
Global and China 1, 4-butanediol (BDO) Industry Report, 2019-2025
1,4-butanediol (BDO), an essential organic and fine chemical material, finds wide application in pharmaceuticals, chemicals, textile and household chemicals.
As of the end of 2018, the global BDO cap...
Global and China Carbon Fiber and CFRP Industry Report, 2019-2025
Among the world’s three major high performance fibers, carbon fiber features the highest strength and the highest specific modulus. It is widely used in such fields as aerospace, sports and leisure.
...
Global and China Natural Rubber Industry Report, 2019-2025
In 2018, global natural rubber industry continued remained at low ebb, as a result of economic fundamentals. Global natural rubber price presented a choppy downtrend and repeatedly hit a record low in...
Global and China Ultra High Molecular Weight Polyethylene (UHMWPE) Industry Report, 2019-2025
Ultra high molecular weight polyethylene (UHMWPE), a kind of linear polyethylene with relative molecular weight of above 1.5 million used as an engineering thermoplastic with excellent comprehensive p...
China Polyether Monomer Industry Report, 2019-2025
China has seen real estate boom and issued a raft of policies for continuous efforts in improving weak links in infrastructure sector over the years. Financial funds of RMB1,663.2 billion should be al...
Global and China Needle Coke Industry Report, 2019-2025
Needle coke with merits of good orientation and excellent conductivity and thermal conductivity, is mainly used in graphite electrodes for electric steelmaking and lithium battery anode materials.
A...
Global and China Viscose Fiber Industry Report, 2019-2025
Over the recent years, the developed countries like the United States, Japan and EU members have withdrawn from the viscose fiber industry due to environmental factor and so forth, while the viscose f...
China Coal Tar Industry Report: Upstream (Coal, coke), Downstream (Phenol Oil, Industrial Naphthalene, Coal Tar Pitch), 2019-2025
Coal tar is a key product in coking sector. In 2018, China produced around 20 million tons of coal tar, a YoY drop of 2.4% largely due to a lower operating rate of coal tar producers that had to be su...
Global and China Synthetic Rubber (BR, SBR, EPR, IIR, NBR, Butadiene, Styrene, Rubber Additive) Industry Report, 2018-2023
In 2018, China boasted a total synthetic rubber capacity of roughly 6,667kt/a, including 130kt/a new effective capacity. Considering capacity adjustment, China’s capacity of seven synthetic rubbers (B...
Global and China Dissolving Pulp Industry Report, 2018-2022
With the commissioning of new dissolving pulp projects, the global dissolving pulp capacity had been up to about 8,000 kt by the end of 2017. It is worth noticing that the top six producers including ...
Global and China Carbon Fiber and CFRP Industry Report, 2018-2022
As a new generation of reinforced fiber boasting intrinsic properties of carbon material and excellent processability of textile fiber, carbon fiber is the one with the highest specific strength and s...
Global and China Ultra High Molecular Weight Polyethylene (UHMWPE) Industry Report, 2017-2021
Ultra High Molecular Weight Polyethylene (UHMWPE), a kind of linear polyethylene with relative molecular weight of above 1.5 million and an engineering thermoplastic with excellent comprehensive prope...
China Coal Tar Industry Report, 2017-2021
Coal tar, one of by-products in raw coal gas generated from coal pyrolysis in coking industry, accounts for 3%-4% of the output of coal as fired and is a main raw material in coal chemical industry.
...
Global and China Aramid Fiber Industry Report, 2017-2021
Global aramid fiber output totaled 115kt with capacity utilization of 76.0% in 2016. As industries like environmental protection and military develop, the output is expected to rise to 138kt and capac...