Global and China Natural Rubber Industry Report, 2017-2021
-
Aug.2017
- Hard Copy
- USD
$2,900
-
- Pages:135
- Single User License
(PDF Unprintable)
- USD
$2,700
-
- Code:
CYH066
- Enterprise-wide License
(PDF Printable & Editable)
- USD
$4,100
-
- Hard Copy + Single User License
- USD
$3,100
-
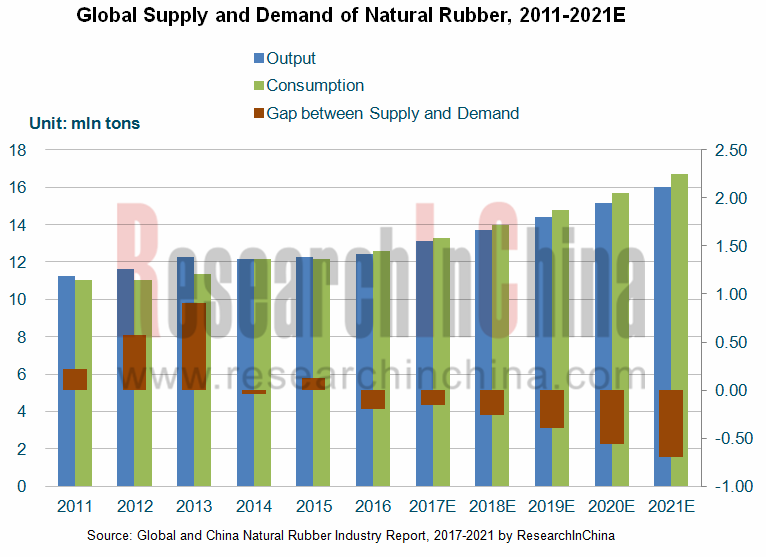
In 2016, the global natural rubber output edged up 1.1% year on year to 12.4 million tons, and the consumption rose by 3.8% year on year to 12.6 million tons, indicating the gap of 200,000 tons between supply and demand. In the context of steady growth in rubber demand and underproduction, it is expected that the global natural rubber market will continue to be in short supply in 2017-2021, with the supply and demand gap of about 700,000 tons by 2021.
At present, the regional structure of the global natural rubber supply and demand is uneven. Thailand, Indonesia, Malaysia, India, Vietnam and China are the world's top six natural rubber producers, contributing 86.5% to the global total output in 2016; wherein, Thailand ranked first with the output of 4.5 million tons and the share of 36.3% in 2016. In the world, natural rubber is mainly consumed in Asia, Africa, Latin America and other emerging industrialized areas, which enjoyed the share of about 75% in 2016.
China is the world's largest producer of natural rubber, and its consumption in 2016 jumped by 4.6% year on year to 4.896 million tons, of which 77.9% was used for radial tires. Driven by the steady development of the tire industry, China's natural rubber consumption is expected to keep an AAGR of 4.5% during 2017-2021 and hit 5.788 million tons by 2021, of which about 90% will be used in radial tires.
Restricted by natural rubber resources, China produced about 764,000 tons of natural rubber in 2016, accounting for only 6.2% of the global output. By 2021, China may produce 1.079 million tons. Amid the serious imbalance between supply and demand, China saw the gap of about 4.132 million tons in 2016; the gap will reach 4.709 million tons by 2021.
In terms of the price, the natural rubber price bucked the downward trend to rise rapidly from H2 2016 to mid-February 2017 and peaked at RMB20,700 / ton since 2014, thanks to higher market prices of international commodities (crude oil, etc.) and quick demand growth of downstream industries (such as heavy truck tires). Later, the main producer Thailand released its storage for four consecutive times, resulting in accelerated supply; however, the consumption growth remained unchanged, so that the natural rubber price dropped down from late February to the end of June, but rebounded slightly in July. In the next year, the broad market and short supply may boost the natural rubber price to show a slight uptrend.
The world's leading natural rubber manufacturers are mainly distributed in Southeast Asia (Thailand and Singapore, etc.), including Sri Trang Agro-Industry, Von Bundit, Thai Hua Rubber Public, TRUBB, Southland Rubber and Sinochem International; among them, Sri Trang Agro-Industry is the world's largest natural rubber producer, and its sales volume accounted for 11.9% of the global total consumption in 2016.
Chinese natural rubber manufacturers are mainly large-sized agricultural reclamation and rubber groups, represented by Sinochem International, China Hainan Rubber, Guangken Rubber, Yunnan State Farms Group and so on. In recent years, major producers have actively deployed overseas markets and seized more market shares. Sinochem International acquired the Singapore-listed company Halcyon Agri Corporation Limited in 2016 to fulfill a global layout of major natural rubber producing areas in West Africa, Southeast Asia and China; in April 2017, the company established Halcyon Natural Rubber (Shanghai) Co., Ltd. to integrate natural rubber marketing and trade of Sinochem International in China. Guangken Rubber took over Thai Hua Rubber Public Co., Ltd. which is Thailand's third largest natural rubber producer in August 2016. As soon as the acquisition is completed, the company will obtain the natural rubber capacity of 1.5 million tons/a, and surpass Sinochem International to rank first in China by capacity.
Global and China Natural Rubber Industry Report, 2017-2021 by ResearchInChina highlights the following:
 Supply & demand, regional distribution, prices, competitive landscape and development trends of global natural rubber market;
Supply & demand, import & export, regional structure, competitive landscape, development trends of Chinese natural rubber market;
Tapping area and planting area of natural rubber in China and around the world;
Development of applications of natural rubber in China, such as tyre, rubber belt & hose;
Operation and development in China of 5 global natural rubber companies;
Operation and development strategies of 5 key Chinese natural rubber companies.
1 Basic Concept of Natural Rubber
1.1 Definition
1.2 Classification
1.3 Industry Chain
2 Development of Global Natural Rubber Market
2.1 Status Quo
2.2 Supply
2.3 Demand
2.3.1 Consumption
2.3.2 Consumption Structure
2.4 Main Natural Rubber Producing Areas
2.4.1 Thailand
2.4.2 Indonesia
2.4.3 Malaysia
2.4.4 Vietnam
2.5 Price
2.6 Competitive Landscape
2.6.1 by Revenue
2.6.2 by Capacity
2.7 Development Trend
3 Development of Chinese Natural Rubber Market
3.1 Status Quo
3.2 Supply and Demand
3.2.1 Supply and Regional Structure
3.2.2 Demand and Consumption Structure
3.3 Import and Export
3.3.1 Import
3.3.2 Export
3.4 Price
3.5 Competitive Landscape
3.5.1 by Enterprise
3.5.2 Substitute Products
3.6 Development Trend
4 Development of Global and China Natural Rubber-related Industries
4.1 Upstream
4.2 Downstream
4.2.1 Tyre Industry
4.2.2 Others
5 Key Global Players
5.1 Sri Trang Agro-Industry Plc.
5.1.1 Profile
5.1.2 Operation
5.1.3 Capacity, Output and Sales Volume
5.1.4 Layout of Industry Chain
5.1.5 Development in China
5.1.6 Competitive Edge
5.2 Thai Rubber Latex Corporation (Thailand) Public Co., Ltd. (TRUBB)
5.2.1 Profile
5.2.2 Operation
5.2.3 Capacity and Sales Volume
5.2.4 Layout of Industry Chain
5.2.5 Product Competitive Strategy
5.2.6 Sales Channels
5.2.7 Development in China
5.3 Thai Hua Rubber Public Co., Ltd.
5.3.1 Profile
5.3.2 Capacity
5.3.3 Development in China
5.3.4 Competitive Edge
5.4 Von Bundit Co., Ltd.
5.4.1 Profile
5.4.2 Capacity
5.4.3 Competitive Edge
5.5 Southland Rubber Co., Ltd.
5.5.1 Profile
5.5.2 Capacity
5.5.3 Development in China
6 Major Chinese Companies
6.1 China Hainan Rubber Industry Group Co., Ltd. (601118)
6.1.1 Profile
6.1.2 Operation
6.1.3 Output and Sales Volume
6.1.4 Competitive Strength
6.1.5 Development Strategy
6.2 Sinochem International Corporation (600500)
6.2.1 Profile
6.2.2 Operation
6.2.3 Natural Rubber Business
6.2.4 Competitive Edge
6.3 Yunnan State Farms Group Co., Ltd.
6.3.1 Profile
6.3.2 Operation
6.3.3 Natural Rubber Business
6.3.4 Overseas Layout
6.3.5 Competitive Strength
6.4 Guangdong Guangken Rubber Group Co., Ltd.
6.4.1 Profile
6.4.2 Operation
6.4.3 Rubber Plantation Business
6.4.4 Rubber Processing Business
6.4.5 Development Strategy
6.5 Xishuangbanna New Gaoshen Rubber Incorporate Company
6.5.1 Profile
6.5.2 Operation
6.5.3 Capacity, Output and Sales Volume
Properties of Natural Rubber
Categories of Standard Rubber (by Level)
Classification of Natural Rubber
Main Production Processes of Natural Rubber
Natural Rubber Industry Chain
Development Stages of Natural Rubber in the World
Global Natural Rubber Output and YoY Growth, 2008-2017
Global Natural Rubber Output by Country, 2013-2016
Global ANRPC Natural Rubber Tapping Area, 2005-2017
Occurrence Time and Intensity of Severe El Ni?o Phenomena, by Jun 2017
Global Natural Rubber Consumption and YoY Growth, 2008-2017
Global Natural Rubber Consumption Structure by Application, 2016
Global Natural Rubber Export Volume by Country, 2009-2016
Thailand's Natural Rubber Output, Export Volume, Consumption and Tapping Area, 2013-2021E
Thailand's Natural Rubber Output, 2009-2016
Thailand's Natural Rubber Output by Season, 2013-2016
Thailand's Natural Rubber Export Volume, 2012-2016
Thailand's Natural Rubber Export Volume Structure by Rubber Type, 2016
Thailand's Natural Latex Export Volume Structure by Country/Region, 2016
Thailand's Natural Rubber Cement Price, 2014-2017
Thailand's Cup Rubber Price, 2014-2017
Temperature Characteristics of Thailand's Natural Rubber Planting Areas by Month
Age Distribution of Thailand's Natural Rubber Trees, by 2020
Indonesia’s Natural Rubber Output, Consumption, Export Volume and Tapping Area, 2013-2021E
Indonesia’s Monthly Natural Rubber Output, 2009-2017
Indonesia’s Natural Rubber Export Volume, 2012-2016
Malaysia’s Natural Rubber Output, Consumption, Export Volume and Tapping Area, 2013-2021E
Malaysia’s Monthly Natural Rubber Output, 2009-2017
Malaysia’s Natural Rubber Export Volume, 2012-2016
Malaysia’s Natural Rubber Planting Area, Tapping Area and Tapping Rate, 2003-2016
Malaysia’s Additional Natural Rubber Planting Area, 2003-2016
Vietnam’s Natural Rubber Output, Consumption, Export Volume and Available Tapping Area, 2013-2021E
Vietnam’s Monthly Natural Rubber Output, 2009-2017
Vietnam’s Natural Rubber Planting Area, Tapping Area and Tapping Rate, 2003-2016
Vietnam’s Additional Natural Rubber Planting Area, 2003-2016
Age Distribution of Vietnam’s Natural Rubber Trees, by 2020
Policies about Natural Rubber in Major Countries, 2009-2017
Natural Rubber Price Trend in Tokyo Commodity Exchange, Singapore Mercantile Exchange and Shanghai Futures Exchange, 2013-2017 (USD / ton)
Revenue of Major Global and Chinese Rubber Producers, 2015-2017
Capacity of Major Global and Chinese Natural Rubber Producers, 2017
Global Natural Rubber Output and Consumption, 2015-2021E
Global Natural Rubber Consumption by Application, 2015-2021E
Purchase and Storage of Natural Rubber in China, as of the end of Jul 2017
China’s Natural Rubber Output and YoY Growth, 2008-2017
China’s Natural Rubber Self-sufficiency Rate, 2005-2017
China’s Natural Rubber Output Structure by Region, 2016
Structure of Hainan's Natural Rubber Processing Regions
China’s Natural Rubber Consumption and YoY Growth, 2008-2017
China’s Natural Rubber Consumption Structure, 2013-2021E
China’s Import Tariff Policy on Natural Rubber, 2006-2017
Import Volume and YoY Growth of Natural Rubber in China, 2007-2017
Import Volume Structure of Natural Rubber in China by Country, 2007-2017
Import Volume Structure of Natural Rubber in China by Product, 2013-2017
China’s Natural Rubber Export Volume, 2008-2017
Main Factors Influencing China’s Natural Rubber Price, 2016-2017
China’s Natural Rubber Price, 2011-2017
Natural Rubber Price Trend in Qingdao Bonded Zone, 2014-2017
Natural Rubber Cement Price in Hainan, 2014-2017
Natural Rubber Cement Price in Yunnan, 2014-2017
Natural Rubber Business Development of Major Natural Rubber Producers in China, 2016
Performance of Common Rubber Products
China’s Synthetic Rubber Output and Consumption, 2011-2021E
China’s Natural Rubber Output and Consumption, 2015-2021E
Total Planting Area of Global Top 9 Natural Rubber Producing Countries, 2008-2016
Tapping Area of Global Top 9 Natural Rubber Producing Countries, 2004-2017
New Planting & Replanting Area of Global Major Natural Rubber Producing Countries, 2008-2016
Stoppage Periods of Global Major Natural Rubber Producing Countries
China’s All-Steel Tire Operating Rate, 2014-2017
China’s Semisteel Tire Operating Rate, 2014-2017
China’s Tire Export Volume and Value, 2013-2016
Distribution of Semisteel Tire Enterprises in China by Capacity, 2016
Distribution of All-Steel Tire Enterprises in China by Capacity, 2016
All-Steel Tire Cost Structure by Raw Materials, 2016
Semisteel Tire Cost Structure by Raw Materials, 2016
Demand of Chinese Radial Tires for Natural Rubber, 2015-2021E
Overseas Natural Rubber Layout of Chinese Tire Enterprises, 2017
China’s Rubber Hose & Belt Output and YoY Growth, 2012-2021E
Revenue and YoY Growth of Rubber Hose-related Manufacturers in China, 2008-2016
Milestones in the Development of Sri Trang, 1987-2016
Revenue and Net Income of Sri Trang, 2008-2017
Gross Profit and Gross Margin of Sri Trang, 2014-2016
Operating Revenue of Sri Trang by Product, 2012-2017
Revenue Structure of Sri Trang by Product, 2016
Natural Rubber Operating Revenue of Sri Trang by Country/Region, 2013-2016
Natural Rubber Sales Volume of Sri Trang by Product, 2010-2016
Sales Volume of Sri Trang by Country/Region, 2014-2016
Quarterly Sales Volume of Sri Trang by Region, 2016-2017
Sales Volume Structure of Sri Trang by Region, 2016
Natural Rubber Industry Chain of Sri Trang, 2016
Natural Rubber Planting Area Structure of Sri Trang, by the end of 2016
Available Natural Rubber Tapping Area of Sri Trang, 2016-2025E
Natural Rubber Processing Plants and Capacity of Sri Trang by Product, by the end of 2016
Natural Rubber Capacity of Sri Trang, 2007-2017
Layout of Sri Trang in Main Downstream Natural Rubber Products, 2017
Splitting and Restructuring between Sri Trang and STP
Natural Rubber Revenue of Sri Trang in China, 2011-2016
Sri Trang’s Sales in China as a Percentage of China’s Total Natural Rubber Import Volume, 2012-2016
Global Market Share of Sri Trang, 2016
Main Development Strategies of Sri Trang
Revenue and Net Income of TRUBB, 2008-2017
Subsidiaries of TRUBB by Business, 2017
Revenue Structure of TRUBB by Business, 2013-2016
Revenue Structure of TRUBB by Region, 2015-2016
Capacity of TRUBB by Business, 2013-2016
Sales Volume of TRUBB by Business, 2012-2013
Competitive Strategies of TRUBB’s Main Products
Sales Channels of TRUBB's Main Business Divisions, 2017
TRUBB’s Revenue in China, 2012-2016
Factories and Capacity of Thai Hua, 2017
Natural Rubber Capacity of Thai Hua by Product, 2017
Distribution of Von Bundit’s Affiliated Companies, 2017
Capacity of Von Bundit by Product, 2013-2017
Natural Rubber Capacity of Von Bundit by Factory, 2017
Global Development Events of Southland Rubber, 1999-2017
Capacity of Southland Rubber by Product, 2015-2017
Capacity of Southland Rubber by Factory, 2017
Factory Distribution of Southland Rubber by Product
Revenue and Net Income of Hainan Rubber Group, 2008-2017
Operating Revenue Structure of Hainan Rubber Group by Product, 2012-2016
Operating Revenue of Hainan Rubber Group by Region, 2009-2016
Gross Margin of Hainan Rubber Group by Product, 2009-2016
Natural Rubber Output of Hainan Rubber Group by Channel, 2010-2016
Sales Volume and YoY Growth of Hainan Rubber Group, 2008-2017
Industry Chain Layout of Hainan Rubber Group, 2017
New Planting Area of Hainan Rubber Group’s Special Rubber Plantations, 2016-2020E
Supporting Shelterbelt Area of Hainan Rubber Group’s Special Rubber Plantations, 2016-2020E
Revenue and Net Income of Sinochem International, 2008-2017
Operating Revenue of Sinochem International by Business, 2015-2017
Revenue of Sinochem International by Region, 2012-2016
Gross Margin of Sinochem International by Business, 2009-2017
Natural Rubber Revenue and Operating Cost of Sinochem International, 2009-2017
Natural Rubber Capacity of Sinochem International, 2010-2017
Natural Rubber Output and Sales Volume of Sinochem International, 2011-2017
Revenue and Net Income of Yunnan State Farms Group, 2012-2017
Operating Revenue Structure of Yunnan State Farms Group by Business, 2014-2016
Natural Rubber Planting Area, Tapping Area and Tapping Rate of Yunnan State Farms Group, 2012-2016
Fresh Rubber Cement Procurement of Yunnan State Farms Group, 2014-2017
Natural Rubber Capacity and Output of Yunnan State Farms Group by Product, 2012-2017
Natural Rubber Revenue Structure of Yunnan State Farms Group by Product, 2012-2015
Natural Rubber Sales Volume and Structure of Yunnan State Farms Group by Sales Channel, 2012-2017
Major Overseas Subsidiaries of Guangdong Guangken Rubber Group
Revenue and YoY Growth of Rubber Companies of Guangdong Guangken Rubber Group, 2010-2017
Natural Rubber Revenue of Guangdong Guangken Rubber Group by Region, 2013-2016
Natural Rubber Procurement and Price of Guangdong Guangken Rubber Group by Region, 2013-2016
Rubber Capacity and Output of Guangdong Guangken Rubber Group by Product, 2013-2016
Sales Volume and Revenue of Rubber Companies of Guangdong Guangken Rubber Group by Product/Region, 2013-2016
Major Rubber Projects Planned/under Construction of Guangdong Guangken Rubber Group, by the end of May 2017
Revenue and Net Income of Xishuangbanna New Gaoshen Rubber, 2013-2016
Operating Revenue Structure of Xishuangbanna New Gaoshen Rubber by Region, 2013-2015
Capacity and Output of Xishuangbanna New Gaoshen Rubber by Factory, 2013-2016
Natural Rubber Sales Volume of Xishuangbanna New Gaoshen Rubber by Product, 2013-2014
Name List and Revenue Contribution of Xishuangbanna New Gaoshen Rubber’s Top 5 Clients, 2016H1
Global and China Synthetic Rubber Industry Report, 2021-2027
Synthetic rubber is a polymer product made of coal, petroleum and natural gas as main raw materials and polymerized with dienes and olefins as monomers, which is typically divided into general synthet...
Global and China Carbon Fiber Industry Report, 2021-2026
Carbon fiber is a kind of inorganic high performance fiber (with carbon content higher than 90%) converted from organic fiber through heat treatment. As a new material with good mechanical properties,...
China Coal Tar Industry Report, 2020-2025
Coal tar is a thick dark liquid which is a by-product of the production of coke and coal gas from coal. It can be classified by the dry distillation temperature into low-temperature coal tar, medium-t...
Global and China Dissolving Pulp Industry Report, 2019-2025
In 2018, global dissolving pulp capacity outstripped 10 million tons and its output surged by 14.0% from a year ago to 7.07 million tons, roughly 70% of the capacity. China, as a key supplier of disso...
Global and China 1, 4-butanediol (BDO) Industry Report, 2019-2025
1,4-butanediol (BDO), an essential organic and fine chemical material, finds wide application in pharmaceuticals, chemicals, textile and household chemicals.
As of the end of 2018, the global BDO cap...
Global and China Carbon Fiber and CFRP Industry Report, 2019-2025
Among the world’s three major high performance fibers, carbon fiber features the highest strength and the highest specific modulus. It is widely used in such fields as aerospace, sports and leisure.
...
Global and China Natural Rubber Industry Report, 2019-2025
In 2018, global natural rubber industry continued remained at low ebb, as a result of economic fundamentals. Global natural rubber price presented a choppy downtrend and repeatedly hit a record low in...
Global and China Ultra High Molecular Weight Polyethylene (UHMWPE) Industry Report, 2019-2025
Ultra high molecular weight polyethylene (UHMWPE), a kind of linear polyethylene with relative molecular weight of above 1.5 million used as an engineering thermoplastic with excellent comprehensive p...
China Polyether Monomer Industry Report, 2019-2025
China has seen real estate boom and issued a raft of policies for continuous efforts in improving weak links in infrastructure sector over the years. Financial funds of RMB1,663.2 billion should be al...
Global and China Needle Coke Industry Report, 2019-2025
Needle coke with merits of good orientation and excellent conductivity and thermal conductivity, is mainly used in graphite electrodes for electric steelmaking and lithium battery anode materials.
A...
Global and China Viscose Fiber Industry Report, 2019-2025
Over the recent years, the developed countries like the United States, Japan and EU members have withdrawn from the viscose fiber industry due to environmental factor and so forth, while the viscose f...
China Coal Tar Industry Report: Upstream (Coal, coke), Downstream (Phenol Oil, Industrial Naphthalene, Coal Tar Pitch), 2019-2025
Coal tar is a key product in coking sector. In 2018, China produced around 20 million tons of coal tar, a YoY drop of 2.4% largely due to a lower operating rate of coal tar producers that had to be su...
Global and China Synthetic Rubber (BR, SBR, EPR, IIR, NBR, Butadiene, Styrene, Rubber Additive) Industry Report, 2018-2023
In 2018, China boasted a total synthetic rubber capacity of roughly 6,667kt/a, including 130kt/a new effective capacity. Considering capacity adjustment, China’s capacity of seven synthetic rubbers (B...
Global and China Dissolving Pulp Industry Report, 2018-2022
With the commissioning of new dissolving pulp projects, the global dissolving pulp capacity had been up to about 8,000 kt by the end of 2017. It is worth noticing that the top six producers including ...
Global and China Carbon Fiber and CFRP Industry Report, 2018-2022
As a new generation of reinforced fiber boasting intrinsic properties of carbon material and excellent processability of textile fiber, carbon fiber is the one with the highest specific strength and s...
Global and China Ultra High Molecular Weight Polyethylene (UHMWPE) Industry Report, 2017-2021
Ultra High Molecular Weight Polyethylene (UHMWPE), a kind of linear polyethylene with relative molecular weight of above 1.5 million and an engineering thermoplastic with excellent comprehensive prope...
China Coal Tar Industry Report, 2017-2021
Coal tar, one of by-products in raw coal gas generated from coal pyrolysis in coking industry, accounts for 3%-4% of the output of coal as fired and is a main raw material in coal chemical industry.
...
Global and China Aramid Fiber Industry Report, 2017-2021
Global aramid fiber output totaled 115kt with capacity utilization of 76.0% in 2016. As industries like environmental protection and military develop, the output is expected to rise to 138kt and capac...