Global and China Photovoltaic Inverter Industry Report, 2017-2021
-
Feb.2018
- Hard Copy
- USD
$3,200
-
- Pages:150
- Single User License
(PDF Unprintable)
- USD
$3,000
-
- Code:
ZLC065
- Enterprise-wide License
(PDF Printable & Editable)
- USD
$4,500
-
- Hard Copy + Single User License
- USD
$3,400
-
PV power generation has been burgeoning with policy incentive and robust demand from downstream sectors over the recent years. In 2017, the global newly installed PV capacity reached 102GW (including 52.8GW from China with a 51.8% share), soaring by 37% from a year earlier, and the cumulative installed PV capacity surged by 33.7% year-on-year to 404.6GW (including 130.3GW from China with a 32.2% share).
With a rapid rise in demand from downstream sectors, the global shipments of PV inverters was estimated to be 105GW in 2017, an upsurge of 55.6% on an annual basis; and the world market size of PV inverters reported USD10.1 billion. Particularly, the shipments of PV inverters in China were estimated to be 53.5GW and market size about RMB7.4 billion.
The world-renowned PV inverter suppliers are Huawei, Sungrow, SMA, ABB, SolarEage, etc. It is in recent two years that the players Huawei and Sungrow from China outperformed SMA by shipments and rose to the No.1 and No.2 places respectively, but still ranked behind SMA in terms of revenue and ranked No.2 and No.3 separately. As far as shipment is concerned, the Chinese competitors Sineng Electric and TBEA are also among the world’s top 10 suppliers of PV inverter by shipments.
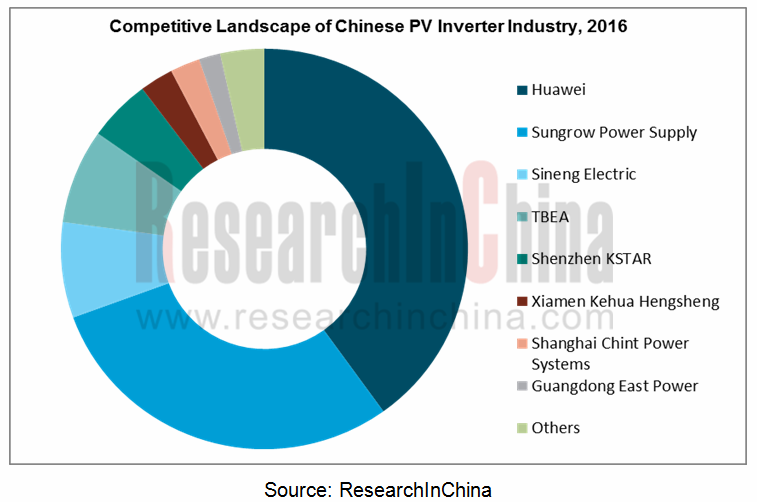
Chinese PV inverter market characterizes high concentration, with Huawei and Sungrow taking the lion’s share, and impressively in 2016 holding a combined share of nearly 70%, followed by Sineng Electric (No.3), TBEA (No.4) and Shenzhen KSTAR (No.5) as concerns shipments.
After high-speed growth in 2017, the global newly installed PV capacity is expected to stabilize at 85GW or so over the next couple of years, which will cause fluctuations of PV inverter shipments in certain range. As estimated, the global shipments of PV inverters will be approximately 90GW and China’s 45.5GW in 2021.
Global and China Photovoltaic Inverter Industry Report, 2017-2021 covers the following:
 Global PV inverter industry (status quo, market size, supply & demand and market pattern);
China PV inverter industry (market environment, status quo, market size, supply & demand, competitive landscape, development factors);
Upstream (IGBT, IC, transformer, etc.) and downstream (PV & PV power station) of PV inverter;
12 Global and 20 Chinese PV inverter suppliers (operation, revenue structure, PV inverter business, etc.)
1. Overview of Photovoltaic Inverter
1.1 Introduction
1.2 Classification
1.2.1 Grid-tied and Off-grid
1.2.2 By Application
1.3 Technological Development
1.3.1 Evolution
1.3.2 Technique Features
1.3.3 Development Trend
1.4 Industry Chain
1.5 Cost Structure
1.6 Business Model
1.7 Industry Barrier
2. Global Photovoltaic Inverter Market
2.1 Status Quo
2.1.1 Market Size
2.1.2 Market Structure
2.1.3 Price
2.2 Supply & Demand
2.2.1 Supply
2.2.2 Demand
2.3 Market Pattern
2.3.1 Manufacturer Pattern
2.3.2 Regional Distribution
2.3.3 Development Characteristics
3. Chinese Photovoltaic Inverter Market
3.1 Marketing Environment
3.1.1 International Environment
3.1.2 Domestic Environment
3.2 Market Status
3.2.1 Market Size
3.2.2 Supply and Demand
3.2.3 Market Price
3.2.4 Market Structure
3.3 Competition Pattern
3.3.1 Local Chinese Enterprises
3.3.2 Foreign Companies
3.4 Influencing Factors
3.4.1 Favorable Factors
3.4.2 Negative Factors
4 Main Upstream Industries
4.1 IGBT
4.1.1 Application in PV Inverter
4.1.2 Market Size
4.1.3 Competition Pattern
4.2 Others
4.2.1 Integrated Circuit
4.2.2 Transformer
4.2.3 Resistor
4.2.4 Capacitor
5 Downstream Industries
5.1 PV
5.1.1 Global
5.1.2 China
5.2 PV Power Plant
5.2.1 Classification
5.2.2 Construction Costs
5.2.3 Industry Planning
5.2.4 Main Enterprises
6. Key Foreign Companies
6.1 SMA
6.1.1 Profile
6.1.2 Operation
6.1.3 PV Inverter Business
6.1.4 Business in China
6.2 ABB
6.2.1 Profile
6.2.2 Operation
6.2.3 PV Inverter Business
6.2.4 Business in China
6.3 SolarEage
6.3.1 Profile
6.3.2 Operation
6.3.3 PV Inverter Business
6.4 TMEIC
6.4.1 Profile
6.4.2 PV Inverter Business
6.4.3 Business in China
6.5 Enphase
6.5.1 Profile
6.5.2 Operation
6.5.3 PV Inverter Business
6.6 AE
6.6.1 Profile
6.6.2 Operation
6.6.3 Business in China
6.7 Danfoss
6.7.1 Profile
6.7.2 Operation
6.8 Omron
6.8.1 Profile
6.8.2 Operation
6.8.3 Business in China
6.9 Others
6.9.1 Schneider
6.9.2 Fronius
6.9.3 SolarMax
6.9.4 KACO
7 Key Chinese Enterprises
7.1 Sungrow Power Supply Co., Ltd.
7.1.1 Profile
7.1.2 Operation
7.1.3 PV Inverter Business
7.1.4 Subsidiaries
7.2 Huawei
7.2.1 Profile
7.2.2 Operation
7.2.3 PV Inverter Business
7.3 Tebian Electric Apparatus Stock Co., Ltd. (TBEA)
7.3.1 Profile
7.3.2 Operation
7.3.3 PV Inverter Business
7.4 Shenzhen KSTAR Science and Technology Co., Ltd.
7.4.1 Profile
7.4.2 Operation
7.4.3 PV Inverter Business
7.5 Xiamen Kehua Hengsheng Co., Ltd.
7.5.1 Profile
7.5.2 Operation
7.5.3 PV Inverter Business
7.6 Guangdong East Power Co., Ltd.
7.6.1 Profile
7.6.2 Operation
7.6.3 PV Inverter Business
7.7 Ningbo Ginlong Technologies Co., Ltd.
7.7.1 Profile
7.7.2 Operation
7.7.3 PV Inverter Business
7.8 GoodWe (Jiangsu) Power Supply Technology Co., Ltd.
7.8.1 Profile
7.8.2 Operation
7.8.3 PV Inverter Business
7.9 Shenzhen Clou Electronics Co., Ltd.
7.9.1 Profile
7.9.2 Operation
7.9.3 PV Inverter Business
7.10 Rongxin Power Electronic Co., Ltd.
7.10.1 Profile
7.10.2 Operation
7.10.3 PV Inverter Business
7.11 Shenzhen Hopewind Electric Co., Ltd.
7.11.1 Profile
7.11.2 Operation
7.11.3 PV Inverter Business
7.12 Sineng Electric Co., Ltd.
7.12.1 Profile
7.12.2 Operation
7.12.3 PV Inverter Business
7.13 Hangzhou Sunny Energy Science & Technology Co., Ltd.
7.13.1 Profile
7.13.2 Operation
7.13.3 PV Inverter Business
7.14 Guangzhou Sanjing Electric Co., Ltd.
7.14.1 Profile
7.14.2 Operation
7.14.3 PV Inverter Business
7.15 Others
7.15.1 Shanghai Chint Power Systems
7.15.2 Growatt New Energy Technology Co., Ltd
7.15.3 Samil Power Co., Ltd.
7.15.4 Guanya Power Equipment Co., Ltd
7.15.5 Anhui EHE New Energy Tech. Co., Ltd
7.15.6 Beijing Corona Science & Technology Co., Ltd.
8 Summary and Forecast
8.1 Market
8.2 Enterprises
Functions of Inverter
Principle of PV Off-grid System
Principle of PV Grid-connected System
Evolution of Inverter Technologies
Development Trend of PV Inverter Technologies
Impact of Shield on Generating Electricity
PV Inverter Industry Chain
Main Applications of PV Inverter in China
Cost Structure of String Inverter
Global PV Inverter Sales, 2011-2021E
Global PV Inverter Revenue Structure (by Power), 2012-2018E
Average Price of PV Inverters Worldwide, 2013-2021E
Global PV Inverter Shipment, 2013-2021E
Global Major PV Inverter Manufacturers
Global PV Inverter Demand, 2013-2021E
Classification of Global PV Inverter Manufacturers
Ranking of Global Top 10 Inverter Enterprises by Shipment and Revenue, 2016
Distribution of Major Global PV Inverter Consumer Countries, 2015
Distribution of Major Global PV Inverter Consumer Countries, 2016
Top 10 Solar Inverter Companies in the United States, 2014
Final Results of USA's Anti-dumping and Countervailing Measures against Chinese Crystalline Silicon Solar Cells
Timetable of EU's Anti-dumping and Countervailing Measures against Chinese PV Products
China’s Major PV Industrial Policies, 2015-2017
China’s PV Inverter Market Size, 2010-2021E
China’s PV Inverter Shipment, 2013-2021E
Classification of Chinese PV Inverter Manufacturers
Average Price of PV Inverters in China, 2012-2020E
China’s PV Inverter Sales Structure (by Product), 2014-2020E
Market Share of PV Inverter Enterprises in China (by Shipment), 2015
Market Share of PV Inverter Enterprises in China (by Shipment), 2016
Top 10 Household PV Inverter Brands in China, 2017
Development of Major Global Inverter Enterprises in China
PV Inverter IGBT Brands
IGBT Supporting of PV Inverter Manufacturers
IGBT Applications
Global IGBT Market Size, 2010-2021E
Global IGBT Application Structure, 2011-2018E
Applications of Various Power Components
Major IGBT Manufacturers in China
Global PCB Output Value and Growth Rate, 2011-2021E
Global PCB Market Shares by Region, 2016
PCB Output Value and Growth Rate in Mainland China, 2010-2021E
Distribution of China PCB Industry
Revenue of China Transformer Industry, 2010-2021E
Global PV Installed Capacity, 2005-2017
Global PV Installed Capacity, 2017-2021E
Newly Installed PV Capacity (by Region) in the World, 2000-2016
Top 10 Countries by Newly Installed PV Capacity and Cumulative Installed Capacity, 2016
Newly Installed PV Capacity (by Country) in the World, 2016
Cumulative Installed PV Capacity Structure (by Country) in the World, 2016
Global New PV Installed Capacity (by Region), 2000-2015
Global Cumulative PV Installed Capacity (by Country), 2010-2015
Proportion of PV System Generating Capacity in Total Electricity Consumption in Major Countries Worldwide, 2015
New PV On-grid Capacity of Major European Countries, 2000-2015
China’s PV Installed Capacity, 2009-2017
China’s PV Installed Capacity, 2016-2021
Operating Modes of PV Power Plants
Advantages and Disadvantages of Centralized and Distributed Power Plants
Construction Cost Structure of PV Power Plant
Investment Budget of 1MW Distributed Architecture PV
China’s Solar PV Demand, 2015/2020E
China’s Solar PV Scale Layout (by Region), 2020E
Top 20 PV Power Plant Enterprises in China (Miscellaneous), 2016
Top 20 PV Power Plant Enterprises in China (Miscellaneous), 2017
Top 20 PV Power Plant Investment Enterprises in China, 2016
Top 20 PV Power Plant Investment Enterprises in China, 2017
Business Structure of SMA
SMA’s Global Layout
SMA’s Revenue and Net Income, 2009-2017
SMA's Revenue Structure (by Business), 2016
SMA's Revenue Structure (by Region), 2016
SMA's PV Inverter Shipment, 2009-2017
ABB's Operation, 2015-2016
ABB's Revenue (by Business), 2014-2016
ABB's Revenue (by Region), 2014-2016
ABB’s Business in China, by 2015
SolarEdge’s Main Economic Indicators, FY2014-FY2016
SolarEdge’s PV Inverters
TMEIC’s Global Footprint
TMEIC’s PV Inverter Shipment, FY2009- FY2015
Enphase’s Revenue and Net Income, 2012-2017
Enphase’s Micro Inverter Shipment, 2013-2015
AE’s Operation, 2012-2016
AE’s Revenue (by Region), 2014-2016
AE’s Sales in China, 2008-2016
Revenue of Danfoss, 2012-2016
Revenue Structure of Danfoss (by Region), 2016
Omron’s Global Business Layout
Omron’s Sales and Net Income, FY2008- FY2016
Omron’s Sales (by Business), FY2015- FY2016
Distribution of Enterprises Invested by Omron in China
PV Inverter Series of Fronius
Sungrow’s Revenue and Net Income, 2010-2017
Sungrow’s Revenue and Gross Margin (by Product), 2014-2017
Sungrow’s R&D Input, 2014-2016
Sungrow’s Shipment, 2011-2016
Huawei’s Revenue and Net Income, 2011-2016
Huawei’s Performance, 2012-2016
Huawei’s Revenue Structure (by Business), 2015
Huawei’s Revenue Structure (by Business), 2016
Huawei’s Revenue Structure (by Region), 2015
Huawei’s Revenue Structure (by Region), 2016
Huawei’s PV Inverter Business Development Process, 2012-2016
TBEA’s Revenue and Net Income, 2009-2017
TBEA’s Operating Revenue and Gross Margin (by Business), 2015-2016
Output-Sales Ratio and Gross Margin of TBEA’s PV Products, 2016
TBEA’s PV Product Production and Capacity under Construction, 2016
Shenzhen Kstar’s Revenue and Net Income, 2008-2017
Shenzhen Kstar’s Revenue Structure (by Business), 2014-2016
Power, Working Methods and Applications of Shenzhen Kstar’s Main PV Inverter Products
Revenue and Net Income of Shenzhen Kstar’s PV Inverter Subsidiary- Shenzhen Kstar New Energy Co., Ltd., 2015-2016
Shenzhen Kstar’s PV Inverter Output and Sales Volume, 2011-2016
Shenzhen Kstar’s PV Inverter Revenue and Gross Margin, 2011-2016
Revenue and Net Income of Xiamen KehuaHengsheng, 2010-2017
Revenue of Xiamen KehuaHengsheng (by Product), 2014-2016
Revenue and Net Income of Guangdong East Power, 2013-2017
Revenue and Gross Margin of Guangdong East Power (by Product), 2014-2016
PV Inverter Shipment of Guangdong East Power, 2012-2017
PV Inverter Output and Capacity of Guangdong East Power, 2016
PV Inverter Output and Capacity of Guangdong East Power, 2017H1
Revenue and Net Income of Ginlong Technologies, 2013-2015
Revenue Breakdown and Percentage of Ginlong Technologies (by Product), 2014-2016
Products and Applications of Ginlong Technologies
Sales Volume of PV Inverters of Ginlong Technologies, 2014-2017H1
GoodWe’s Revenue and Net Income, 2013-2017
GoodWe’s Operating Revenue (by Product), 2014-2016
Revenue and Net Income of Shenzhen Clou Electronics, 2008-2017
Revenue of Main Products of Shenzhen Clou Electronics, 2015-2016
Revenue and Net Income of Rongxin Power Electronic, 2008-2017
Revenue of Main Products of Rongxin Power Electronic, 2014-2016
Revenue and Net Income of Shenzhen Hopewind Electric, 2014-2017
Revenue of Shenzhen Hopewind Electric by Product, 2014-2016
Capacity, Output, Sales Volume and Sales-Output Ratio of Main Products of Shenzhen Hopewind Electric, 2014-2016
Key PV Power Generation Products of Shenzhen Hopewind Electric
Average Price of PV Inverters of Shenzhen Hopewind Electric, 2014-2016
PV Inverter Revenue of Shenzhen Hopewind Electric from Its Top 5 Customers, 2014-2016
Revenue and Net Income of Sineng Electric, 2014-2017
Revenue of Sineng Electric by Product, 2014-2017
Revenue Structure of Sineng Electric by Region, 2014-2017
Sineng Electric’s R&D Costs and % of Total Revenue, 2014-2017
Key PV Inverters of Sineng Electric
Sineng Power’s Distributed Inverters
PV Inverter Capacity, Output and Sales Volume of Sineng Electric, 2014-2017
Average Selling Price of Central PV Inverters of Sineng Electric, 2014-2017
Sineng Electric’s Revenue from Top 5 Customers and % of Total Revenue, 2014-2017
Purposes of Funds Raised via IPO of Sineng Electric, 2017
Revenue and Net Income of Hangzhou Sunny Energy Science & Technology, 2014-2017
Gross Margin of Hangzhou Sunny Energy Science & Technology, 2014-2017
Revenue and Net Income of Guangzhou Sanjing Electric, 2014-2017
Gross Margin of Guangzhou Sanjing Electric, 2014-2017
Key PV Inverters of Guangzhou Sanjing Electric
Revenue and Net Income of Shanghai Chint Power Systems, 2013-2015
Main PV Inverter Equipment of Shanghai Chint Power Systems
Main PV Inverter Products of Growatt New Energy Technology
Main PV Inverter Products of Samil Power
Main PV Inverter Products of Guanya Power Equipment
Main PV Inverter Products of Anhui EHE New Energy Tech
Main PV Inverter Products of Beijing Corona Science & Technology
Global Shipments and Market Size of PV Inverters, 2016-2021E
China’s Shipments and Market Size of PV Inverters, 2016-2021E
Average Price and YoY Change of Global PV Inverters, 2013-2021E
Revenue Growth Rate of Major Global PV Inverter Manufacturers, 2010-2016
Competition Pattern of Chinese PV Inverter Market, 2015
Competition Pattern of Chinese PV Inverter Market, 2016
Robot Controllers (Brain & Cerebellum) Research Report, 2025
Robot Controller Research: Brain-Cerebellum Integration Becomes a Trend, and Automotive-Grade Chips Migrate to Robots
ResearchInChina has released the Robot Controllers (Brain & Cerebellum) Resea...
Tactile Sensor Research Report, 2025
ResearchInChina has released the "Tactile Sensor Research Report, 2025", which conducts research, analysis and summary on the basic concepts, technical principles, advantages and disadvantages o...
Embodied AI and Humanoid Robot Market Research 2024-2025: Product Technology Outlook and Supply Chain Analysis
Six Trends in the Development of Embodied AI and Humanoid Robots
In 2025, the global humanoid robot industry is at a critical turning point from technology verification to scenario penetration, and t...
Global and China Smart Meters Industry Report, 2022-2027
Meters are widely used in the national economy and are an important part of metering to promote the development of metering. As a legal measuring tool, meters are mainly used in the supply process of ...
China Smart Agriculture and Autonomous Agricultural Machinery Market Report, 2022
Research on smart agriculture and autonomous agricultural machinery: top-level design, agricultural digitization and automation present a potential marketAmid the pandemic, the conflict between Russia...
Global and China Heat Meters Industry Report, 2022-2027
A heat meter is an instrument used to measure, calculate and display the value of heat released or absorbed by water flowing through a heat exchange system, and is mainly used for measuring the heatin...
Global and China CNC Machine Tool Industry Report, 2022-2027
As typical mechatronics products, CNC machine tools are a combination of mechanical technology and CNC intelligence. The upstream mainly involves castings, sheet metal parts, precision parts, function...
Global and China Hydraulic Industry Report, 2021-2026
Hydraulic components are key parts for mobile machineries including construction machinery, agricultural and forestry machinery, material handling equipment and commercial vehicle. The global construc...
China Motion Controller Industry Report, 2021-2026
The motion control system is the core component of intelligent manufacturing equipment, usually composed of controllers, motors, drivers, and human-computer interaction interfaces. Through the control...
Global and China Industrial Robot Servo Motor Industry Report, 2021-2026
As the actuator of control system, servo motor is one of the three crucial parts to industrial robot and its development is bound up with industrial robots. Given the slow progress of 3C electronics a...
Global and China Industrial Laser Industry Report, 2020-2026
As one of the most advanced manufacturing and processing technologies in the world, laser technology has been widely used in industrial production, communications, information processing, medical beau...
Global and China Mining-use Autonomous Driving Industry Report, 2020-2021
Demand and policies speed up landing of Autonomous Driving in Mining
Traditional mines have problems in recruitment, efficiency, costs, and potential safety hazards, while which can be solved by aut...
Autonomous Agricultural Machinery Research Report, 2020
Autonomous Agricultural Machinery Research: 17,000 sets of autonomous agricultural machinery systems were sold in 2020, a year-on-year increase of 188%
Autonomous agricultural machinery relies heavil...
Global and China CNC Machine Tool Industry Report, 2020-2026
As a typical type of mechatronic products, CNC machine tools combine mechanical technology with CNC intelligence. The upstream mainly involves castings, sheet weldments, precision parts, functional pa...
Global and China Hydraulic Industry Report, 2020-2026
Hydraulic parts, essential to modern equipment manufacturing, are mostly used in mobile machinery, industrial machinery and large-sized equipment. Especially, construction machinery consumes the overw...
Global and China Industrial Robot Speed Reducer Industry Report, 2020-2026
Controller, servo motor and speed reducer, three core components of industrial robot, technologically determine key properties of an industrial robot, such as work accuracy, load, service life, stabil...
Global and China Industrial Robot Servo Motor Industry Report, 2020-2026
As the actuator of control system, servo motor is one of the three crucial parts to industrial robot and its development is bound up with industrial robots. Given the agonizingly slow progress of 3C e...
Global and China Laser Processing Equipment Industry Report, 2020-2026
Laser processing which offers centralized and stable laser beams is applicable to high hardness, high melting point materials that are hard to be processed with traditional technologies. By purpose, l...