Global and China Automated Optical Inspection (AOI) Industry Report, 2018-2022
-
Jun.2018
- Hard Copy
- USD
$3,400
-
- Pages:200
- Single User License
(PDF Unprintable)
- USD
$3,200
-
- Code:
ZJF117
- Enterprise-wide License
(PDF Printable & Editable)
- USD
$4,800
-
- Hard Copy + Single User License
- USD
$3,600
-
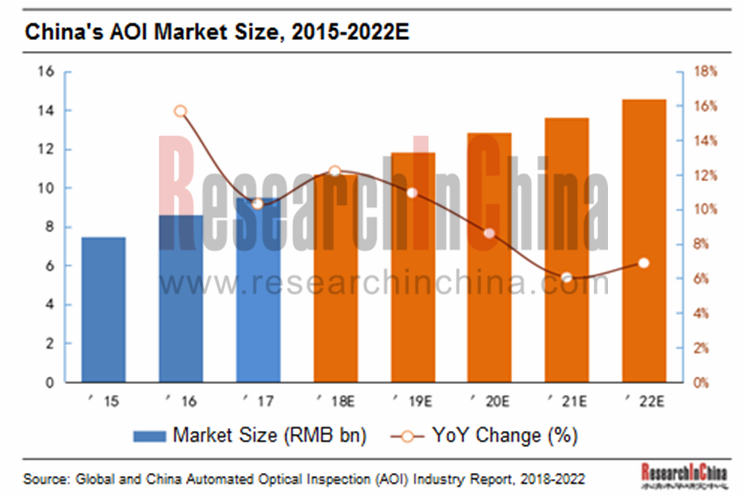
Miniaturization of electronic products conduces to components of all sorts being smaller and smaller and spurs the growing demand for automated inspection equipment. In the wake of a transfer of electronic components production capacity to China, the AOI equipment has been developing by leaps and bounds over the past several years. In 2017, Chinese AOI market was worth RMB9.52 billion, a surge of 10.3% from a year earlier and making up 21.7% of the global AOI market size. As the industries such as artificial intelligence and automotive electronics are advancing rapidly and China’s policies on high-end equipment manufacturing are being implemented, the market of high-end equipment inclusive of AOI will be booming and it is projected that the Chinese AOI market size will keep a CAGR of 8.9% between 2017 and 2022.
AOI is primarily served for PCB, FPD, semiconductor and photovoltaic cell, and finds most application in PCB sector. There is a limited market size of AOI applied in FPD industry and semiconductor industry. In 2017, AOI use in PCB, FPD and semiconductor seized a respective market share of 63.9%, 15.6% and 13.7% in total AOI market size.
As concerns competition, the Chinese AOI equipment market is still firmly dominated by foreign companies while Chinese players have come to the fore, such as Aleader, Jutze Intelligence, Ekt-Tech, Zhenhuaxing Technology, Ovi Technology and JT Automation Equipment. Those Chinese firms focus on the downstream process (like PCB) and compete fiercely due to weak R&D capability and lack of technological innovation, and consequently most of them saw a drop in both revenue and market share in 2017.
By comparison, the large multinational corporations represented by Israel-based Orbotech, Japan-based Screen and South Korea-based Koh Young Technology make foray into market segments with full product portfolios, or the foreign players represented by Omron, KLA-Tencor and HB target the front end industry (like semiconductor and FPD) and occupy the high-end market. Along with the higher and higher demanding on the yield of electronic components in China, the demand for high-end AOI keeps expanding and the international giants seize more and more market shares. In addition, Taiwanese vendors (like Test Research, Inc., Utechzone, and Machvision) approach the Mainland Chinese market by dint of Taiwan’s components supply relationship and form a competitive force which however was beginning to wind down owing to the deteriorating political climate since 2015.
The report highlights the followings:
 AOI industry overview (definition, classification, composition, advantages, technologies, market features, industrial chain, business model, etc.);
Global AOI market (status quo, market size, competitive landscape, development trends, etc.);
Chinese AOI market (policy, status quo, market size, demand, competitive pattern, development prospects, etc.);
Downstream of AOI Industry (market size, demand and so forth of PCB industry, FPD industry, IC industry, etc.);
11 world-renowned companies (Orbotech, Camtek, Omron, Screen, HB, Koh Young Technology, KLA-Tencor, TRI, Utechzone, Mirtec, SAKI), involving profile, performance, revenue structure, R&D expenditure, AOI business, development strategy, operations in China, etc.);
10 Chinese AOI companies (Aleader, Jutze Intelligence, Ekt-Tech, Zhenhuaxing Technology, Ovi Technology, 3i Systems, Xieli Electronic, JT Automation Equipment, Star River Comtes, and Mingfu Automation), involving profile, performance, revenue structure, R&D expenditure, AOI business, development strategy, etc.)
1. Overview of AOI Industry
1.1 Definition and Classification
1.1.1 Definition
1.1.2 Classification
1.2 Composition and Advantages
1.2.1 Composition and Structure
1.2.2 Advantages and Characteristics
1.3 AOI Related Technologies
1.3.1 Profile
1.3.2 Trends
1.4 Industry Chain
1.4.1 Profile
1.4.2 Upstream
1.4.3 Downstream
1.5 Industry Policy
2. Global AOI Market
2.1 Market Size
2.2 Competition
3. China AOI Market
3.1 Market Status and Market Size
3.2 Market Demand
3.3 Competition
4. Application of AOI in PCB
4.1 Profile
4.2 Operation of PCB Industry
4.3 AOI Market Size
5. Application of AOI in FPD
5.1 Profile
5.2 Operation of TFT-LCD Industry
5.3 AOI Market Size
6. Application of AOI in Semiconductor
6.1 Profile
6.2 Overall Market Operation
6.3 Operation of IC Industry
6.4 AOI Market Size
7. AOI Players Worldwide
7.1 Orbotech
7.1.1 Profile
7.1.2 Operation
7.1.3 Revenue Structure
7.1.4 R&D Expenses
7.1.5 Gross Margin
7.1.6 AOI Business
7.1.7 AOI Solutions
7.1.8 Development Strategy
7.1.9 Business in China
7.2 Camtek
7.2.1 Profile
7.2.2 Operation
7.2.3 Revenue Structure
7.2.4 Gross Margin
7.2.5 R&D Expenses
7.2.6 AOI Business
7.2.7 Business in China
7.2.8 Camtek Imaging Technology Co., Ltd.
7.3 KLA-Tencor
7.3.1 Profile
7.3.2 Operation
7.3.3 Revenue Structure
7.3.4 R&D Expenses
7.3.5 Main Products
7.3.6 Business in China
7.3.7 ICOS Semiconductor Equipment (Shenzhen) Co., Ltd.
7.4 Omron
7.4.1 Profile
7.4.2 Operation
7.4.3 Revenue Structure
7.4.4 Gross Margin
7.4.5 R&D Expenses
7.4.6 Industrial Automation Business
7.4.7 AOI Business
7.4.8 Business in China
7.5 KohYoung Technology
7.5.1 Profile
7.5.2 Operation
7.5.3 Revenue Structure
7.5.4 Gross Margin
7.5.5 R&D Expenses
7.5.6 AOI Business
7.6 Screen
7.6.1 Profile
7.6.2 Operation
7.6.3 Revenue Structure
7.6.4 R&D Expenditure
7.6.5 AOI Business
7.6.6 Business in China
7.7 HB Technology (Korea)
7.7.1 Profile
7.7.2 Operation
7.7.3 Revenue Structure
7.7.4 Gross Margin
7.7.5 R&D Expenses
7.7.6 AOI Business
7.8 TRI
7.8.1 Profile
7.8.2 Operation
7.8.3 Revenue Structure
7.8.4 Gross Margin
7.8.5 R&D Expenses
7.8.6 Output and Sales Volume
7.8.7 AOI Business
7.8.8 Business in Mainland China
7.8.9 Tri Electronic (Shenzhen) Co., Ltd.
7.9 Utechzone
7.9.1 Profile
7.9.2 Operation
7.9.3 Revenue Structure
7.9.4 Gross Margin
7.9.5 R&D Expenses
7.9.6 Output and Sales Volume
7.9.7 AOI Business
7.9.8 Development Strategy
7.10 Mirtec
7.10.1 Profile
7.10.2 AOI Business
7.10.3 Business in China
7.11 SAKI
7.11.1 Profile
7.11.2 AOI Business
7.11.3 Business in China
7.11.4 Latest Development
8. AOI Players in China
8.1 JT Automation Equipment
8.1.1 Profile
8.1.2 Operation
8.1.3 Revenue Structure
8.1.4 Gross Margin
8.1.5 R&D Input
8.1.6 AOI Business
8.1.7 Development Strategy
8.2 Star River Comtes
8.2.1 Profile
8.2.2 Operation
8.2.3 Revenue Structure
8.2.4 Gross Margin
8.2.5 R&D Expenses
8.3 Aleader
8.3.1 Profile
8.3.2 AOI Business
8.4 Jutze Intelligence
8.4.1 Profile
8.4.2 AOI Business
8.5 Ekt-Tech
8.5.1 Profile
8.5.2 AOI Business
8.6 Zhenhuaxing Technology
8.6.1 Profile
8.6.2 AOI Business
8.6.3 Customers and Sales Network
8.7 Ovi Technology
8.7.1 Profile
8.7.2 AOI Business
8.8 Mingfu Automation
8.8.1 Profile
8.8.2 AOI Business
8.8.3 Main Clients
8.9 3i Systems
8.9.1 Profile
8.9.2 Operation
8.9.3 Revenue Structure
8.9.4 AOI Business
8.9.5 Customers and Sales Network
8.10 Xieli Electronic
8.10.1 Profile
8.10.2 AOI Business
Classification of Optical Inspection Equipment
Composition of AOI System
Advantages of AOI Equipment
Related Technologies of AOI Equipment Industry
AOI Equipment Industry Chain
AOI Equipment Upstream Raw Materials Source Countries
AOI Application Industries and Test Items
SMT Process
AOI Equipment Application in SMT Production Line
AOI Application in Solar Cell Production Line
Policies on China AOI Industry, 2006-2017
Global AOI Market Size and YoY, 2015-2022E
Global AOI Market Size (by Applications), 2015-2022E
Major Global AOI Manufacturers and Their AOI Revenue, 2015-2017
A Comparison of the Advantages and Disadvantages of Foreign and Chinese AOI Equipment Manufacturers
China's AOI Market Size, 2015-2022E
Major AOI Demanding Fields in China, 2017
Market Size of Major AOI Demanding Fields in China, 2015-2022E
Market Share of Major AOI Manufacturers in China, 2017
Major Chinese AOI Manufacturers and Their AOI Revenue
PCB Industry Chain
Application of AOI in PCB Industry
Global PCB Output Value and YoY, 2015-2022E
Global PCB Output Value by Market Segments, 2016-2022E
Global PCB Output Value Structure (by Region), 2014-2021E
Mainland China’s PCB Output Value and YoY, 2015-2022E
Global PCB Test Applied AOI Market Size and YoY, 2015-2022E
China’s PCB Test Applied AOI Market Size and YoY, 2014-2022E
Application of AOI in TFT-LCD Production Line
Main Inspection Equipment of TFT-LCD Production Process
Global Large Size TFT-LCD Panel Shipments and YoY, 2015-2022E
Global Large Size TFT-LCD Panel Shipments by Applications, 2016-2022E
Market Size and YoY of AOI Applied in FPD Test Worldwide, 2015-2022E
Market Size of AOI Applied in FPD Test in China, 2015-2022E
Application of AOI in Wafer Manufacturing
Application of AOI in Wafer Probing
Application of AOI in IC Packaging
Application of AOI in IC Testing
Global Semiconductor Industry Sales and YoY, 2015-2022E
Global Semiconductor Industry Sales Structure (by Product), 2015-2022E
Global Semiconductor Industry Sales Structure (by Region), 2015-2022E
Revenue of Global Top 10 Semiconductor Suppliers, 2016-2017
Global IC Industry Sales and YoY, 2015-2022E
China’s IC Industry Sales and YoY, 2010-2017
China’s IC Industry Sales as a Percentage of the World’s, 2011-2017
Global Semiconductor Equipment Sales (by Region), 2015-2022E
Global Semiconductor Process Control Equipment Market Size, 2015-2022E
Calculation Table of China’s Semiconductor Process Control Equipment Market Size, 2015-2022E
Calculation Table of China’s Semiconductor AOI Market Size, 2015-2022E
Orbotech’s Revenue and Net Income, 2009-2018
Orbotech’s Revenue Breakdown (by Business), 2014-2018
Orbotech’s Revenue Breakdown (by Region), 2014-2017
Orbotech’s R&D Expenses, YoY, and % of Total Revenue, 2010-2018
Orbotech’s Gross Profit, YoY, and Gross Margin, 2010-2018
Orbotech’s Main Products and Its Competitors (by Industry)
Installs of Orbotech’s Main Products, 2010-2017
New Technologies of Orbotech’s Core Markets
Orbotech’s AOIs Applied in PCB Test
Orbotech’s AOIs Applied in FPC Test
Orbotech’s Revenue from China, YoY, and % of Total Revenue, 2010-2017
Camtek’s Revenue and Net Income, 2009-2018
Camtek’s Revenue Breakdown (by Region), 2015-2017
Camtek’s Gross Profit, YoY, and Gross Margin, 2009-2018
Camtek’s R&D Expenses, YoY, and % of Total Revenue, 2009-2018
Camtek’s Major Customers in Semiconductor Field
Camtek’s Major AOI Product in Semiconductor Field
Eagle Series AOI Products
Condor Series AOI Products
Gannet Series AOI Products
Falcon Series AOI Products
Phoenix Series AOI Products
Dragon Series AOI Products
Orion Series AOI Products
LAM Series AOI Products
Major Subsidiaries of Camtek
KLA-Tencor’s Revenue and Net Income, FY2011-FY2018
KLA-Tencor’s Revenue Breakdown (by Business), FY2014-FY2018
KLA-Tencor’s Revenue Breakdown (by Region), FY2015-FY2017
KLA-Tencor’s R&D Expenses and % of Total Revenue, FY2013-FY2018
Main Products of KLA-Tencor
KLA-Tencor’s Major Customers
Staff Structure of Omron
Omron’s Revenue and Net Income, FY2009-FY2017
Omron’s Revenue Breakdown (by Business), FY2010-FY2017
Omron’s Revenue Breakdown (by Region), FY2009-FY2017
Omron’s Gross Profit, YoY, and Gross Margin, FY2009-FY2017
Omron’s R&D Expenses, YoY, and % of Total Revenue, FY2009-FY2017
OMRON Industrial Automation’s Revenue and Operating Income, FY2013-FY2018E
OMRON Industrial Automation’s Revenue Breakdown (by Region), FY2010-FY2017
OMRON Industrial Automation’s R&D Expenses, YoY, and % of the Department’s Revenue, FY2010-FY2015
Main AOI Products of Omron
Omron’s Sales in Greater China Region, FY2010-FY2018
KohYoung Technology’s Business Growth Model
KohYoung Technology’s Revenue and YoY, 2009-2017
Revenue Structure of KohYoung Technology by Region, 2016-2017
KohYoung Technology’s Gross Profit, YoY, and Gross Margin, 2012-2017
KohYoung Technology’s R&D Expenses and % of Total Revenue, 2013-2017
KohYoung Technology’s SMI Solutions
KohYoung Technology’s Semiconductor Solutions
Screen’s Revenue and YoY, FY2010-FY2018
Screen’s Revenue Breakdown (by Business Unit), FY2011-FY2018
Screen’s Revenue Breakdown (by Region), FY2011-FY2018
Revenue Structure of Screen Media and Precision Technology Company, FY2010-FY2018
Screen’s R&D Expenditure, YoY, and % of Total Revenue, FY2010-FY2018
Number of Patents Held by Screen, FY2013-FY2017
Screen’s Main AOI Equipment
Screen’s PCB Related Equipment Revenue and YoY, FY2010-FY2019E
Revenue of Screen GP China, FY2013-FY2018
HB Technology’s Revenue and YoY, 2009-2017
HB Technology’s Revenue Breakdown (by Product & Marketing Channel), 2015-2017
HB Technology’s Gross Profit, YoY, and Gross Margin, 2010-2017
HB Technology’s R&D Expenses and % of Total Revenue, 2010-2017
HB Technology’s AOI Capacity, 2013-2017
Output and Average Selling Price of HB Technology’s AOI Products, 2010-2017
HB’s Main AOI Products
TRI’s Revenue and Net Income, 2010-2017
TRI’s Revenue Breakdown (by Product), 2011-2016
TRI’s Revenue Breakdown (by Region), 2010-2017
TRI’s Gross Profit, YoY, and Gross Margin, 2010-2017
TRI’s R&D Expenses, YoY, and % of Total Revenue, 2010-2017
Capacity and Output of TRI’s Main Products, 2011-2015
Sales Volume of TRI’s Main Products, 2010-2015
TRI’s Main Product Models and Their Applications
Main 3D SPI AOI Products of TRI
Main AXI Products of TRI
Global Network Distribution of TRI
Utechzone’s Revenue and Net Income, 2010-2017
Utechzone’s Revenue Breakdown (by Product), 2010-2017
Utechzone’s Revenue Breakdown (by Region), 2010-2017
Utechzone’s Gross Profit, YoY, and Gross Margin, 2010-2017
Utechzone’s R&D Expenses, YoY, and % of Total Revenue, 2010-2017
R&D Results of Utechzone, 2016
Output and Output Value of Utechzone’s Main Products, 2015-2016
Sales Volume of Utechzone’s Main Products, 2015-2016
Sales of Utechzone’s Main Products, 2012-2015
Main Products and Functions of Utechzone’s Optical Inspection Equipment
Main Performance Index of PCB AVI
Main Products of FPD AOI
Main Products of Touch Panel AOI
Other AOI Products
Short-term Development Plan of Utechzone
Long-term Development Plan of Utechzone
Mirtec’s AOIs Applied in SMT
Mirtec’s AOIs Applied in LED
SAKI’s Newly Launched Products, 2012-2017
SAKI’s Main 2D AOI Equipment
SAKI’s Main 3D AOI/SPI Equipment
SAKI’s Main AXI Products
Distribution of SAKI’s Companies and Distributors Worldwide
SAKI’s Distributors in China
JT Automation Equipment’s Revenue and YoY, 2010-2018
JT Automation Equipment’s Revenue Breakdown (by Product), 2016-2017
JT Automation Equipment's Revenue Breakdown (by Region), 2011-2017
JT Automation Equipment's Gross Margin (by Product), 2011-2017
JT Automation Equipment’s R&D Expenses, YoY, and % of Total Revenue, 2011-2017
Development History of JT Automation Equipment’s AOI Equipment, 2009-2015
Revenue and YoY of JT Automation Equipment’s AOI Equipment, 2010-2017
Automation Equipment’s Revenue and Net Income, 2015-2022E
Star River Comtes’ Revenue and Net Income, 2010-2017
Star River Comtes’ Revenue Breakdown by Product, 2014-2016
Star River Comtes’ Gross Margin , 2010-2017 (%)
Star River Comtes’ R&D Expenses and % of Total Revenue, 2010-2017
Main AOI Products of ALeader
Main Customers of ALeader
Main AOI Products of Jutze Intelligence
Main AOI Products of ekt-Tech
Main Customers of ekt-Tech
Main AOI Products of ZhenHuaXing Technology
New AOI Products of ZhenHuaXing Technology
Main Customers of ZhenHuaXing Technology
Sales Network of ZhenHuaXing Technology
Main AOI Products of Ovi Technology
Main Customers of Ovi Technology
Main AOI Products of Mingfu Automation
Main Customers of Mingfu Automation
3i Systems’ Revenue and Net Income, 2014-2017
Revenue Structure of 3i Systems’ by Product, 2016-2017
3i Systems’ Procurement from Top 5 Suppliers, 2017
Main Flat Display AOI Products of 3i Systems
3i Systems Display Panel AOI Customers
3i Systems PV Cell AOI Customers
3i Systems’ Revenue from Top 5 Customers, 2017
Performance Indicators of IMPRESS Q Series AOI Products
Performance Indicators of IMPRESS Q+ Series AOI Product
Robot Controllers (Brain & Cerebellum) Research Report, 2025
Robot Controller Research: Brain-Cerebellum Integration Becomes a Trend, and Automotive-Grade Chips Migrate to Robots
ResearchInChina has released the Robot Controllers (Brain & Cerebellum) Resea...
Tactile Sensor Research Report, 2025
ResearchInChina has released the "Tactile Sensor Research Report, 2025", which conducts research, analysis and summary on the basic concepts, technical principles, advantages and disadvantages o...
Embodied AI and Humanoid Robot Market Research 2024-2025: Product Technology Outlook and Supply Chain Analysis
Six Trends in the Development of Embodied AI and Humanoid Robots
In 2025, the global humanoid robot industry is at a critical turning point from technology verification to scenario penetration, and t...
Global and China Smart Meters Industry Report, 2022-2027
Meters are widely used in the national economy and are an important part of metering to promote the development of metering. As a legal measuring tool, meters are mainly used in the supply process of ...
China Smart Agriculture and Autonomous Agricultural Machinery Market Report, 2022
Research on smart agriculture and autonomous agricultural machinery: top-level design, agricultural digitization and automation present a potential marketAmid the pandemic, the conflict between Russia...
Global and China Heat Meters Industry Report, 2022-2027
A heat meter is an instrument used to measure, calculate and display the value of heat released or absorbed by water flowing through a heat exchange system, and is mainly used for measuring the heatin...
Global and China CNC Machine Tool Industry Report, 2022-2027
As typical mechatronics products, CNC machine tools are a combination of mechanical technology and CNC intelligence. The upstream mainly involves castings, sheet metal parts, precision parts, function...
Global and China Hydraulic Industry Report, 2021-2026
Hydraulic components are key parts for mobile machineries including construction machinery, agricultural and forestry machinery, material handling equipment and commercial vehicle. The global construc...
China Motion Controller Industry Report, 2021-2026
The motion control system is the core component of intelligent manufacturing equipment, usually composed of controllers, motors, drivers, and human-computer interaction interfaces. Through the control...
Global and China Industrial Robot Servo Motor Industry Report, 2021-2026
As the actuator of control system, servo motor is one of the three crucial parts to industrial robot and its development is bound up with industrial robots. Given the slow progress of 3C electronics a...
Global and China Industrial Laser Industry Report, 2020-2026
As one of the most advanced manufacturing and processing technologies in the world, laser technology has been widely used in industrial production, communications, information processing, medical beau...
Global and China Mining-use Autonomous Driving Industry Report, 2020-2021
Demand and policies speed up landing of Autonomous Driving in Mining
Traditional mines have problems in recruitment, efficiency, costs, and potential safety hazards, while which can be solved by aut...
Autonomous Agricultural Machinery Research Report, 2020
Autonomous Agricultural Machinery Research: 17,000 sets of autonomous agricultural machinery systems were sold in 2020, a year-on-year increase of 188%
Autonomous agricultural machinery relies heavil...
Global and China CNC Machine Tool Industry Report, 2020-2026
As a typical type of mechatronic products, CNC machine tools combine mechanical technology with CNC intelligence. The upstream mainly involves castings, sheet weldments, precision parts, functional pa...
Global and China Hydraulic Industry Report, 2020-2026
Hydraulic parts, essential to modern equipment manufacturing, are mostly used in mobile machinery, industrial machinery and large-sized equipment. Especially, construction machinery consumes the overw...
Global and China Industrial Robot Speed Reducer Industry Report, 2020-2026
Controller, servo motor and speed reducer, three core components of industrial robot, technologically determine key properties of an industrial robot, such as work accuracy, load, service life, stabil...
Global and China Industrial Robot Servo Motor Industry Report, 2020-2026
As the actuator of control system, servo motor is one of the three crucial parts to industrial robot and its development is bound up with industrial robots. Given the agonizingly slow progress of 3C e...
Global and China Laser Processing Equipment Industry Report, 2020-2026
Laser processing which offers centralized and stable laser beams is applicable to high hardness, high melting point materials that are hard to be processed with traditional technologies. By purpose, l...