Global and China Optical Fiber Preform Industry Report, 2019-2025
-
Aug.2019
- Hard Copy
- USD
$3,400
-
- Pages:160
- Single User License
(PDF Unprintable)
- USD
$3,200
-
- Code:
CYH089
- Enterprise-wide License
(PDF Printable & Editable)
- USD
$4,800
-
- Hard Copy + Single User License
- USD
$3,600
-
Optical fiber preform, playing an important role in the optical fiber and cable industry chain, seizes about 70% profits of optical fiber. Global demand for optical fiber preform stood at 16.2kt in 2018, a mere 5.5% growth, far lower than in 2017, as optical fiber market slowed down, but is projected to hit 25kt in 2025 with the growing demand from large-scale 5G construction, among others. China, as a key consumer of optical fiber preform, accounted for 56.7% of the global total demand in 2018, a share projected to be 60% in 2025.
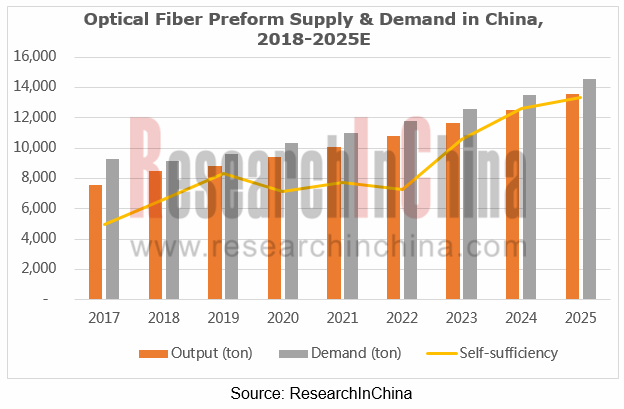
Optical fiber preform is still in short supply in China, a large supplier worldwide. Yet, as more optical fiber preform projects become operational, the supply gap in the country will be narrowed, and over 85% will be self-sufficient in 2025, compared with 81.9% in 2018.
China’s imports of optical fiber preform slumped in 2018, and the gloomy picture continues to 2019. That’s because China still carries out the optical fiber preform anti-dumping policy (on July 10, 2018, Chinese government announced to continue imposing anti-dumping duties on optical fiber preform from Japan and the United States for 5 years), and furthermore, trade tensions between China and the US have yet to be eased.
Global optical fiber preform industry features a high concentration. There are just around 20 manufacturers, largely in Japan, the United States and China and typically Corning, Sumitomo Electric Industries, Shin-Etsu Chemical, YOFC and Hengtong Optic-electric. By capacity, YOFC boasts the largest share in the global market, followed by Corning.
Both of the two giants had optical fiber preform capacity expansion projects in recent two years. In YOFC’s case, in late 2018, Phase II of YOFC Qianjiang Co., Ltd.’s 500 t/a OVD optical fiber preform capacity expansion project went into production, sending YOFC’s total capacity to 3,500t/a; YOFC also has such projects under construction as YOFC Qianjiang Phase III and Shin-Etsu YOFC (Hubei) Optical Preform Co., Ltd.’s Phase II and YOFC SDG (Hubei) Optical Preform Co., Ltd.’s new project. As for Corning, following operation of its optical fiber preform technological upgrading project in Hainan province in 2018, it pushed on with construction of optical fiber preform technological upgrading and capacity expansion project which drew to an end in August 2019, with a capacity of 1,066 t/a.
A combination of factors like anti-dumping policy are at play in rapid growth of Chinese optical fiber preform companies which already have stronger competence in research and development and enlarge their capacity. As with large manufacturers YOFC, Hengtong Optic-electric, Futong Group and Corning (Hainan) Optical Communication, in 2019 other main optical fiber preform suppliers in China, like Jiangsu Etern, Tianjin Futong Xinmao Science & Technology, Hangzhou Cable, STL-Sterlite Technologies and Hebei Far East Communication System Engineering (HBFEC), also have deployed optical fiber preform projects. According to the disclosed projects, it is predicted that China’s optical fiber preform capacity will outstrip 25kt/a in 2025, a sign of excess capacity.
In 2019, price of optical fiber preform products has dropped a bit in China due to higher risk of overcapacity, smaller supply gap and fiercer competition in the market.
Global and China Optical Fiber Preform Industry Report, 2019-2025 highlights the following:
 Global optical fiber preform market (supply & demand, regional distribution, price, competitive pattern, and development trend);
Chinese optical fiber preform market (policy, patents, supply & demand, import & export, competitive pattern, price, and development trend);
Developments of global and China optical fiber & cable markets;
13 global and Chinese optical fiber preform companies (operation, optical fiber preform business, etc.).
1. Overview of Optical Fiber Preform
1.1 Definition
1.2 Production Technology
1.3 Industry Chain
1.3.1 Upstream
1.3.2 Downstream
2. Global Optical Fiber Preform Industry
2.1 Status Quo
2.2 Supply & Demand
2.2.1 Supply
2.2.2 Demand
2.3 Regional Structure
2.3.1 USA
2.3.2 Japan
2.3.3 Europe
2.4 Price
2.5 Competitive Landscape
3. Optical Fiber Preform Industry in China
3.1 Policy Environment
3.1.1 Major Policies
3.1.2 Anti-Dumping Investigation
3.2 Development History
3.2.1 Development Overview
3.2.2 Patents
3.3 Supply & Demand
3.3.1 Supply
3.3.2 Demand
3.4 Import & Export
3.4.1 Import
3.4.2 Export
3.5 Price Trend
3.5.1 Raw Materials
3.5.2 Optical Fiber Preform
3.6 Competitive Landscape
4. Global and Chinese Optical Fiber & Cable Market
4.1 Global
4.1.1 Market Development
4.1.2 Regional Structure
4.1.3 Price
4.1.4 Company
4.2 China
4.2.1 Market Development
4.2.2 Price
4.2.3 Competitive Landscape
5. Major Global Optical Fiber Preform Companies
5.1 Corning
5.1.1 Profile
5.1.2 Operation
5.1.3 Optical Fiber Preform Business
5.1.4 Development in China
5.1.5 Corning Optical Fiber Cable Chengdu Co. Ltd.
5.1.6 Corning (Hainan) Optical Communication Co., Ltd.
5.2 Sumitomo Electric Industries
5.2.1 Profile
5.2.2 Operation
5.2.3 Optical Fiber Preform Business
5.2.4 Development in China
5.2.5 Chengdu SEI Optical Fiber
5.3 Shin-Etsu Chemical
5.3.1 Profile
5.3.2 Operation
5.3.3 Optical Fiber Preform Business
5.3.4 Development in China
5.4 Fujikura
5.4.1 Profile
5.4.2 Operation
5.4.3 Optical Fiber Preform Business
5.4.4 Development in China
5.4.5 Fujikura FiberHome Opto-Electronic Material Technology
5.5 Prysmian
5.5.1 Profile
5.5.2 Operation
5.5.3 Optical Fiber Preform Business
5.5.4 Development in China
5.6 Furukawa Electric
5.6.1 Profile
5.6.2 Operation
5.6.3 Optical Fiber Preform Business
5.6.4 Development in China
5.7 TwentscheKabel Holding (TKH)
5.7.1 Profile
5.7.2 Operation
5.7.3 Optical Fiber Preform Business
5.7.4 Development in China
5.7.5 Twentsche (Nanjing) Fibre Optics
6. Major Chinese Optical Fiber Preform Companies
6.1 YOFC
6.1.1 Profile
6.1.2 Operation
6.1.3 Optical Fiber Preform Business
6.2 Hengtong Optic-electric
6.2.1 Profile
6.2.2 Operation
6.2.3 Optical Fiber Preform Business
6.3 Jiangsu Zhongtian Technology (ZTT)
6.3.1 Profile
6.3.2 Operation
6.3.3 Optical Fiber Preform Business
6.4 FiberHome Technologies
6.4.1 Profile
6.4.2 Operation
6.4.3 Optical Fiber Preform Business
6.5 Futong Group
6.5.1 Profile
6.5.2 Operation
6.5.3 Projects under Construction
6.5.4 Optical Fiber Preform Business
6.6 Potevio Fasten Optical Communication
6.6.1 Profile
6.6.2 Operation
6.6.3 Optical Fiber Preform Business
7. Summary and Forecast
7.1 Enterprise
7.2 Market
Optical Fiber Preform Mandrel and Cladding Diagram
Optical Fiber Preform Mandrel Process Distribution Proportion, 2018
Optical Fiber Preform Industry Chain
Cost Structure of Optical Fiber Preform in China
Downstream Industrial Chain of Optical Fiber Preform
Global Capacity and Output of Optical Fiber Preform, 2013-2025F
Global Demand for Optical Fiber Preform, 2013-2025F
Price of Optical Fiber Preform Worldwide, 2000-2019
Optical Fiber Preform Output and YoY Growth in China, 2009-2019
Optical Fiber Preform Demand and YoY Growth in China, 2010-2019
Optical Fiber Preform Self-sufficiency in China, 2007-2019
Optical Fiber Preform Import Volume and YoY Growth in China, 2010-2018
Structure of China’s Optical Fiber Preform Import Volume (by Country), 2013-2018
Optical Fiber Preform Import Value and YoY Growth in China, 2010-2018
Optical Fiber Preform Export Volume and YoY Growth in China, 2010-2018
Structure of China’s Optical Fiber Preform Export Volume (by Country), 2013-2018
Optical Fiber Preform Export Value and YoY Growth in China, 2010-2018
Price Trend of Germanium in China, 2010-2018
Average Price of Optical Fiber Preform in China, 2010-2019
Import and Export Prices of Optical Fiber Preform in China, 2010-2018
Structure and Production Processes of Optical Fiber and Cable
Optical Fiber Output in China and Worldwide, 2010-2018
Optical Cable Output in China and Worldwide, 2010-2018
Global Demand for Optical Fiber and Cable, 2011-2025E
Global Optical Fiber Demand Structure in the World’s Major Regions, 2014-2019
Demand for Optical Fiber and Cable in the World’s Major Regions, 2020E
Demand for Optical Fiber and Cable in the World’s Major Three Regions, 2010-2018
Global Submarine Optical Cable Revenue by Region, 2014-2022E
Demand for Optical Cable in the United States, 2008-2020E
U.S. Optical Cable Exports and YoY Growth
Price Trend of Optical Fiber Worldwide, 2014-2018
Optical Fiber and Cable Demand and YoY Growth in China, 2011-2025E
Centralized Purchasing by Major Chinese Telecom Carriers, 2018
Completed Centralized Purchase Amount of Three Chinese Telecom Carriers, 2013-2018
Optical Fiber Price Trend in China, 2012-2018 (RMB/fkm)
Centralized Procurement Price for Optical Fiber in China, 2004-2019
Revenue and Net Income of Corning, 2009-2019
R&D Costs and % of Total Revenue of Corning, 2009-2019
Revenue Breakdown (by Product) of Corning’s Telecom Business Segment, 2011-2018
Corning’s Revenue in China and As a Percentage of Total, 2009-2018
Revenue and Net Income of Sumitomo Electric, FY2008-FY2019
Revenue Breakdown (by Business) of Sumitomo Electric, FY2008-FY2019
Strategies (by Business) of Sumitomo Electric, FY2019
Revenue Breakdown (by Region) of Sumitomo Electric, FY2008-FY2018
R&D Costs of Sumitomo Electric, FY2013-FY2022
R&D Expenditures of Sumitomo Electric (by Business), FY2018
Development Visions of Sumitomo Electric, FY2022
Operating Income Structure of Sumitomo Electric (by Segment), FY2022
R&D Strategies of Sumitomo Electric (by Segment), FY2022
Sumitomo Electric’s Revenue from Information and Communications Business, FY2013-FY2019
Development Strategy of Sumitomo Electric’s Information and Communications Business, FY2020
Sumitomo Electric’s Revenue in China, FY2011-FY2018
Revenue of Chengdu SEI Optical Fiber Co., Ltd., 2009-2018
Products of Shin-Etsu Chemical (by Division), 2019
Shin-Etsu Chemical’s Plants by Business Division/by Region, 2019
Revenue and Net Income of Shin-Etsu Chemical, FY2010-FY2018
Revenue Structure of Shin-Etsu Chemical by Business, FY2013-FY2018
Revenue and Operating Income of Shin-Etsu Chemical’s Electronic and Functional Materials Division, FY2009-FY2018
Investment of Shin-Etsu Chemical’s Electronic and Functional Materials Division, FY2016-FY2018
Shin-Etsu Chemical’s Revenue in China and Percentage, FY2012-FY2018
Revenue and Net Income of Fujikura, FY2009-FY2019
Fujikura’s Business Layout, FY2019
Fujikura’s R&D Costs by Business, FY2012-FY2018
Fujikura’s Power & Telecommunications Revenue by Business, FY2017-FY2019E
Fujikura’s Revenue in China, FY2011-FY2018
Revenue and Net Income of Fujikura FiberHome Opto-Electronic Material Technology, 2011-2018
Equity Structure of Prysmian, 2019
Global Presence of Prysmian
Business Operations of Prysmian
Development & Acquisition Course of Prysmian
Revenue and Net Income of Prysmian, 2008-2018
Business Performance of Prysmian, 2019Q1
Global R&D Centers of Prysmian by the End of 2018
Revenue Structure of Prysmian by Business, 2018
Revenue Structure of Prysmian by Region, 2018
Performance of Prysmian’s Telecommunications Business, 2016-2018
Performance of Prysmian’s Telecommunications Business, 2019Q1
Telecommunications Business Revenue of Prysmian by Business, 2018
Telecommunications Business Revenue of Prysmian by Region, 2018
Telecommunications Business Structure and Key Clients of Prysmian
Performance of Prysmian’s General Cable Business, 2016-2018
Prysmian’s Presence in China
Global Presence of Furukawa Electric, FY2018
Business Planning of Furukawa Electric, 2020E
Furukawa Electric’s Planning for Global Presence, 2020E
Net Revenue and Operating Income of Furukawa Electric, FY2010-FY2019
Revenue of Furukawa Electric by Business, FY2017-FY2019
Revenue Forecast of Furukawa Electric by Business, FY2017-FY2025E
R&D Expenses of Furukawa Electric by Business, FY2019
Revenue Structure by Region of Furukawa Electric, FY2017-FY2018
Revenue and Operating Income of Furukawa Electric’s Communications Solutions, FY2009-FY2018
Net Sales and Operating Income of Furukawa Electric’s Communications Solutions, FY2017-FY2019
Sales and Operating Income of Furukawa Electric’s Communications Solutions, FY2017-2025E
Furukawa Electric’s Communications Growth, FY2018 & FY2021E
Furukawa Electric’s Communications Solutions and Related Subsidiaries
Application of Optical Fiber and Optical Cable Products of Furukawa Electric
Optical Fiber Development Trends of Furukawa Electric
Optical Cable Development Trends of Furukawa Electric
Optical Fiber and Cable Business Expansion of Furukawa Electric, FY2018-FY2020E
Main Optical Fiber Production Bases and Projects under Construction of Furukawa Electric, 2019
Global Presence of TKH
Revenue and Net Income of TKH, 2009-2018
Revenue Structure of TKH by Segment, 2016-2018
Revenue Structure of TKH by Region, 2012-2018
R&D Expenditure of TKH, 2008-2018
Revenue and Business Model of TKH’s Telecom Division by Business, 2017-2018
Prospects for Fibre Optics Networks
Business Structure of YOFC
Revenue and Net Income of YOFC, 2008-2018
Revenue Structure of YOFC by Product, 2011-2018
Operating Revenue of YOFC by Region, 2011-2018
Gross Margin of YOFC by Product, 2011-2018
YOFC’s R&D Costs and % of Total Revenue, 2013-2018
Optical Fiber Preform Output and Growth Rate of YOFC, 2008-2018
Global Marketing Network of Hengtong Optic-Electric
Revenue and Net Income of Hengtong Optic-Electric, 2008-2018
Gross Margin of Hengtong Optic-Electric’s Optical Communications Products, 2011-2018
Revenue of Hengtong Optic-Electric by Region, 2009-2018
Overseas Operations of Hengtong Optic-Electric, 2018
R&D Costs and % of Total Revenue of Hengtong Optic-Electric, 2009-2018
Optical Fiber Preform Capacity of Hengtong Optic-Electric, 2010-2018
Optical Fiber Preform Output and Sales of Hengtong Optic-Electric, 2010-2018
Evolution of ZTT’s Primary Business
Revenue and Net Income of ZTT, 2009-2018
Revenue of ZTT by Region, 2008-2018
R&D Costs and % of Total Revenue of ZTT, 2009-2018
Optical Fiber Preform Capacity of ZTT, 2012-2025E
Optical Fiber Preform Output of ZTT, 2010-2018
Milestones of FiberHome
Business and Subsidiaries of FiberHome
Revenue and Net Income of FiberHome Technologies, 2008-2018
Revenue of FiberHome Technologies by Product, 2008-2018
Revenue Structure of FiberHome Technologies by Business, 2018
Revenue of FiberHome Technologies by Region, 2008-2018
Gross Margin of FiberHome Technologies by Product, 2008-2018
R&D Costs and % of Total Revenue of FiberHome Technologies, 2011-2018
Optical Fiber Preform Output of FiberHome Technologies, 2010-2018
Equity Structure of Futong Group, 2019
Distribution of Futong Group’s Production Bases
Revenue and Net Income of Futong Group, 2009-2019
Global Marketing Network of Futong Group
Revenue of Futong Group by Business, 2010-2019
Gross Margin of Futong Group by Business, 2009-2019
Optical Fiber Preform Capacity and Output of Futong Group, 2009-2019
Average Prices of Optical Fiber Preform of Futong Group, 2011-2018
Equity Structure of Potevio Fasten Optical Communication, 2019
Revenue and Net Income of Potevio Fasten Optical Communication, 2013-2018
Optical Fiber Preform Capacity and Output of Potevio Fasten Optical Communication, 2006-2018
Competitive Landscape of Global Optical Fiber Preform Market, 2018
Competitive Landscape of China Optical Fiber Preform Market, 2018-2019
Global Optical Fiber Preform Capacity Structure, 2018&2025E
Global and China Optical Fiber Preform Demand Growth, 2011-2025E
Optical Fiber Preform Output and Demand in China, 2017-2025E
Manufacturing Process Comparison of Optical Fiber Preform Mandrel
Manufacturing Process Comparison of Optical Fiber Preform Mandrel in China
Global Optical Fiber Preform Capacity and Market Share (by Country/Region), 2014-2019
Global Demand for Optical Fiber Preform (by Country/Region), 2010-2019
Optical Fiber Preform Capacity, Output and Demand in the United States, 2010-2018
Optical Fiber Preform Export in the United States, 2010-2018
Optical Fiber Preform Capacity, Output and Demand in Japan, 2010-2018
Optical Fiber Preform Export in Japan, 2010-2018
Policies on Optical Fiber Preform Industry in China, 2010-2019
Anti-dumping Results of Optical Fiber Preform in China, 2018
Development History of Optical Fiber Preform in China
Key Optical Fiber Preform Projects Planned and under Construction in China, 2019
Shareholding Structure and Technologies Applied of Main Optical Fiber Preform Manufacturers in China
Optical Fiber Preform Capacity of Key Optical Fiber Preform Producers in China, 2013-2019
Optical Fiber Preform Output of Key Optical Fiber Preform Producers in China, 2013-2019
Global Top10 Most Competitive Optical Fiber and Cable Enterprises, 2018
Market Share of Optical Fiber Enterprises in China, 2018
Market Share of Optical Cable Enterprises in China, 2018
Revenue Breakdown and Structure of Corning (by Product), 2013-2019
Revenue Breakdown and Structure of Corning (by Country/Region), 2014-2018
Revenue Structure of Shin-Etsu Chemical by Region, FY2013-FY2018
Overview of New Optical Fiber Preform Joint Ventures in China
Revenue Structure of Fujikura by Business, FY2014-FY2018
Revenue Structure of Fujikura by Region, FY2014-FY2018
Prysmian’s Subsidiaries in China by the End of 2018
Revenue Structure of Furukawa Electric’s Communications Solutions by Product
Revenue Structure of TKH by Business, 2014-2018
Revenue of TKH by Product, 2012-2018
TKH’s Subsidiaries in China by the End of 2018
Revenue Breakdown of YOFC by Product, 2015-2018
Optical Fiber Preform and Optical Fiber Projects of YOFC in Qianjiang Science Park
Key Suppliers of Raw Materials for YOFC
Self-produced and Outsourced Output and Sales Volume of YOFC (by Product), 2015-2018
Self-produced and Outsourced Sales Volume of YOFC (by Product), 2015-2018
Output, Sales Volume and Sales-Output Ratio of Hengtong Optic-Electric by Product, 2012-2018
Operating Revenue, Operating Cost and Gross Margin of Hengtong Optic-Electric by Product, 2018
Optical Fiber Preform Procurement and Self-Supply Quantity of Hengtong Optic-Electric, 2013-2018
Optical Fiber Preform Capacity Expansion History of Hengtong Optic-Electric, 2010-2019
Operating Revenue and Gross Margin of ZTT by Business, 2016-2018
Capacity, Output and Sales Volume of Optical Fiber and Cable Products of ZTT, 2015-2018
Net Income of Major Optical Fiber Preform Manufacturing Companies of FiberHome Technologies, 2015-2018
Revenue, Gross Profit and Gross Margin of Futong Group, 2014-2018
Capacity and Output of Futong Group’s Optical Communications Business by Product, 2014-2018
Sales and Selling Prices of Futong Group’s Optical Communications Business by Product, 2014-2018
Key Projects under Construction of Futong Group, 2019
Optical Fiber Preform Production Bases of Futong Group
Optical Fiber Preform Import Volume and Value of Futong Group, 2015-2018
Futong Group’s Procurement of Raw Materials for Optical Fiber Preform from Top 5 Suppliers and % of Total Procurement, 2014-2019
Operation of Key Optical Fiber Preform Producers in China, 2018
Global and China Photoresist Industry Report, 2021-2026
Since its invention in 1959, photoresist has been the most crucial process material for the semiconductor industry. Photoresist was improved as a key material used in the manufacturing process of prin...
Global and China Needle Coke Industry Report, 2021-2026
Needle coke is an important carbon material, featuring a low thermal expansion coefficient, a low electrical resistivity, and strong thermal shock resistance and oxidation resistance. It is suitable f...
Global and China 3D Glass Industry Report, 2021-2026
3D curved glass is light and thin, transparent and clean, anti-fingerprint, anti-glare, hard and scratch-resistant, and performs well in weather resistance. It is applicable to terminals such as high-...
Global and China Graphene Industry Report, 2020-2026
Graphene, a kind of 2D carbon nanomaterial, features excellent properties such as mechanical property and super electrical conductivity and thermal conductivity. Its downstream application ranges from...
Global and China 3D Glass Industry Report, 2020-2026
Global 3D glass market has been enlarging over the recent years amid demetallization of smartphone back covers and popularity of smart wearables, to approximately $2.86 billion in 2019 and to an estim...
Global and China Photoresist Industry Report, 2020-2026
In 2019, global photoresist market was valued at $8.3 billion, growing at a compound annual rate of 5.1% or so since 2010, and it will outnumber $12.7 billion in 2026 with advances in electronic techn...
Global and China Synthetic Diamond Industry Report, 2020-2026
While its mechanical property is given full play in fields like grinding and cutting, diamond with acoustic, optical, magnetic, thermal and other special properties, as superconducting material, intel...
Global and China Needle Coke Industry Report, 2020-2026
With the merits like small resistivity, excellent resistance to impact and good anti-oxidation property, needle coke has been widely used in ultra-high power graphite electrodes, nuclear reactor decel...
Global and China Optical Fiber Preform Industry Report, 2019-2025
Optical fiber preform, playing an important role in the optical fiber and cable industry chain, seizes about 70% profits of optical fiber. Global demand for optical fiber preform stood at 16.2kt in 20...
China Silicon Carbide Industry Report, 2019-2025
Silicon carbide (SiC) is the most mature and the most widely used among third-generation wide band gap semiconductor materials. Over the past two years, global SiC market capacity, however, hovered ar...
Global and China Photoresist Industry Report, 2019-2025
Photoresist, a sort of material indispensable to PCB, flat panel display, optoelectronic devices, among others, keeps expanding in market size amid the robust demand from downstream sectors. In 2018, ...
Global and China Graphene Industry Report, 2019-2025
Graphene is featured with excellent performance and enjoys a rosy prospect. The global graphene market was worth more than $100 million in 2018, with an anticipated CAGR of virtually 45% between 2019 ...
Global and China 3D Glass Industry Chain Report, 2019-2025
The evolution of AMOLED conduces to the steady development of 3D curved glass market. In 2018, the global 3D glass market expanded 37.7% on an annualized basis and reached $1.9 billion, a figure proje...
China Wood Flooring Industry Report, 2019-2025
With the better standard of living and the people’s desire for an elegant life, wood flooring sees a rising share in the flooring industry of China, up from 33.9% in 2009 to 38.9% in 2018, just behind...
Global and China Photovoltaic Glass Industry Report, 2019-2025
In China, PV installed capacity has ramped up since the issuance of photovoltaic (PV) subsidy policies, reaching 53GW in 2017, or over 50% of global total. However, the domestic PV demand was hit by t...
Global and China ITO Targets Industry Chain Report, 2019-2025
Featured by good electrical conductivity and transparency, ITO targets are widely applied to fields of LCD, flat-panel display, plasma display, touch screen, electronic paper, OLED, solar cell, antist...
Global and China MO Source Industry Report, 2019-2025
MO source is a key raw material for metal-organic chemical vapor deposition (MOCVD) process. Global MO source output ranged at 102.6 tons in 2018, a rise of roughly 4.6% from a year earlier, a figure ...
Global and China Bi-Metal Band Saw Blade Industry Report, 2018-2023
Chinese manufacturing rebounded in the wake of a pick-up in infrastructure construction between 2016 and 2018, so did the bi-metal band saw blade as a key integral of metal processing industry. In 201...