Global and China MO Source Industry Report, 2014-2015
-
Mar./2014
- Hard Copy
- USD
$1,700
-
- Pages:71
- Single User License
(PDF Unprintable)
- USD
$1,600
-
- Code:
CHW012
- Enterprise-wide License
(PDF Printable & Editable)
- USD
$2,450
-
- Hard Copy + Single User License
- USD
$1,900
-
Global demand for MO source from LED industry has accounted for more than 90% of the aggregate demand for MO source. New-generation solar cell, phase change memory, semiconductor laser and other areas are still in their infancy, and have not yet formed massive market demand.
Because of a higher gross margin of MO source product in the early days, the world’s four major suppliers of MO source involving Dow Chemical, AKZO Nobel, SAFC Hitech and NATA expanded production over the past three years, resulting in the mushrooming of new entrants and increasing fierce market competition, and MO source product prices began to fall sharply.
Downstream of MO source mainly refers to the LED epitaxial chip industry, which in 2013 suffered mid/low-end overcapacity, causing chip price to ceaselessly fall; finally, most companies witnessed a continuous decline in profitability, at a loss. The downturn in epitaxial chip companies also directly affected the profitability of MO source manufacturers.
In February 2014, NATA released a newsletter about its 2013-year performance, according to which the company’s revenue reached RMB135 million in 2013, down 23.81% YoY; and net income attributable to shareholders of the listed company decreased by 33.08% YoY to RMB60.3596 million.
In 2014, along with technological progress and falling prices of LED lighting products, LED lighting application demand will grow rapidly; MOCVD equipment capacity utilization will continue to rise and stimulate recovery in demand for upstream MO source. Therefore, MO source companies are expected to bottom out in 2014.
NATA, the domestic MO leader, has sufficient upstream raw materials of MO source such as gallium and indium with low cost. By virtue of cost advantage, NATA is likely to turn around performance in 2014.
Global and China MO Source Industry Report, 2014-2015 focuses on the followings:
 Development (industrial policies, laws and regulations) of MO source industry;
Market size, market structure, supply and demand, competition pattern, etc. of MO source industry;
Influences from upstream and downstream sectors on global and China MO source industry
Operation, development strategy, etc. of eight MO companies at home and abroad.
1 Overview of MO Source Industry
1.1 Introduction
1.2 Classification and Application
1.3 Industry Chain
1.4 Industry Characteristics
1.4.1 High Concentration
1.4.2 High Growth
2 Development of Global MO Source Industry
2.1 Overview
2.2 Supply
2.3 Demand
2.3.1 Downstream Demand Restores Growth
2.3.2 Midstream & Upstream Capacity Gradually Digested
2.3.3 Demand Volume
2.3.4 Demand Structure
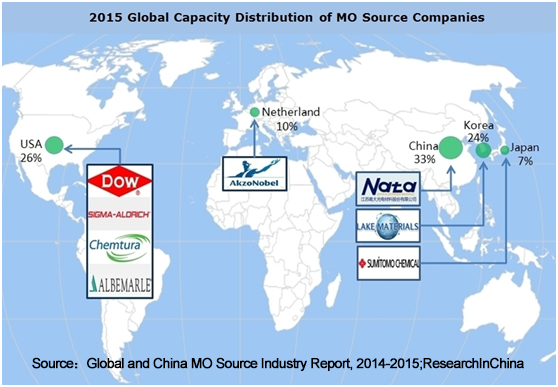
2.4 Market Competition Pattern
2.5 USA
2.6 Taiwan
2.7 South Korea
2.8 Europe
2.9 Japan
3 Development of MO Source Industry in China
3.1 Development Environment
3.1.1 Policy Environment
3.1.2 Trade Environment
3.1.3 Technical Environment
3.2 Supply
3.2.1 Production Capacity
3.2.2 Capacity Structure
3.3 Demand
3.4 Price Trend
4 Upstream and Downstream Industries of MO Source in China
4.1 Upstream Sectors
4.1.1 Gallium
4.1.2 Indium
4.1.3 Related Policies and Influence
4.2 LED Industry
4.2.1 LED Market Scale
4.2.2 MOCVD and LED Chip Market
4.2.3 LED Encapsulation Market
4.2.4 LED Application Market
4.2.5 Competition Pattern
4.3 Other Downstream Sectors
4.3.1 New Solar Cell
4.3.2 Phase Change Memory
4.3.3 Semiconductor Laser
4.3.4 RFIC (Radio Frequency Integrated Circuit) Chip
5 Key Enterprises Worldwide
5.1 DOW
5.1.1 Profile
5.1.2 Operation
5.1.3 Revenue Structure
5.1.4 MO Source Business
5.1.5 Business in China
5.2 SAFC Hitech
5.2.1 Profile
5.2.2 Operation
5.2.3 Business Structure
5.2.4 MO Source Business
5.3 AKZO Nobel
5.3.1 Profile
5.3.2 Operation
5.3.3 Revenue Structure
5.3.4 MO Source Business
5.3.5 Business in China
5.4 Sumitomo Chemical
5.4.1 Profile
5.4.2 Operation
5.4.3 MO Source Business
5.4.4 Business in China
5.5 Albemarle
5.5.1 Profile
5.5.2 Operation
5.5.3 MO Source Business
5.5.4 Business in China
5.6 Chemtura
5.6.1 Profile
5.6.2 Operation
5.6.3 MO Source Business
5.6.4 Business in China
5.7 Lake LED Materials
5.7.1 Profile
5.7.2 MO Source Business
5.8 Nata Opto-electronic
5.8.1 Profile
5.8.2 Operation
5.8.3 Revenue Structure
5.8.4 Gross Margin
5.8.5 Production and Marketing
5.8.6 Key Projects
6 Summary
6.1 Global MO Source Market Prospect
6.2 China MO Source Market Prospect
Application of MO Source
Industrial Chain of MO Source
Output of MO Source Worldwide, 2010-2015E
Global TV LED Backlight Output Value, 2012-2015E
Output Value and Growth Rate of Global HB LED Products, 2010-2015E
Number of Newly Added MOCVD Machines and Ownership Worldwide, 2010-2015E
Share of Newly Added MOCVD Machines Worldwide, 2015E
Global MO Source Demand, 2010-2015E
Global MO Source Demand by Industry, 2010-2015E
Developments of Major MO Source Suppliers Worldwide, 2012-2013
Number of Newly Added MOCVD Machines and Ownership in Taiwan, 2009-2015E
Number of Newly Added MOCVD Machines in South Korea, 2009-2012
Production Bases and Major Customers of MO Source in Japan
Policies about MO Source Industry in China, 2011-2013
Production Capacity of MO Source in China, 2010-2015E
Production Capacity of MO Source in China by Product, 2010-2015E
Number of Newly Added MOCVD Machines and Ownership in China, 2009-2015E
Mergers and Acquisitions of Companies, 2012-2013
MOCVD Purchase Plan of China's Local Governments, 2010-2015E
Demand for MO Source in China, 2010-2015E
Average Price of MO Source Products in China, 2009-2015E
Price of Gallium in China, 2004-2014
Output and Sales Volume of Indium in China, 2009-2015 E
Market Price of Indium (Purity ≥99.99%) in China, 2004-2014
LED Industry Chain
Total Output Value of LED Industry in China, 2010-2015E
Ownership of MOCVD Machines in China, 2010-2013
Output Value and Growth Rate of LED Epitaxial Wafer in China, 2010-2013
Output Value and Growth Rate of LED Encapsulation Industry in China, 2010-2013
Proportions of LED Applications, 2013
Businesses of Key LED Manufacturers in China
Performance Comparison of Different Types of Solar Cells
Output of GaAs Solar Cell in China, 2010-2020E
Sales and EBITDA of Dow,2009-2013
Revenue Breakdown of Dow by Business, 2013
Revenue Breakdown of Dow by Region, 2012
Production Bases of Dow Electronic Materials
Revenue of Electronic & Functional Materials of Dow, 2010-2013
Revenue Breakdown of Dow Electronic Materials by Region, 2012
Revenue Breakdown of Dow Electronic Materials by Business, 2012
Sales and Net income of SAFC Hitech, 2009-2013
Revenue Breakdown of SAFC Hitech by Business, 2013
MO Source Production Bases of SAFC Hitech
Revenue and Net Income of AKZO Nobel, 2009-2013
Revenue Breakdown of Speciality Chemicals by Business, 2013
Production Bases of Functional Chemical Products of AKZO Nobel in China
Revenue and Net Income of Sumitomo Chemical, FY2009- FY2013
Revenue Breakdown of Sumitomo Chemical by Business, FY2009-FY2013
Branch Companies of Sumitomo Chemical and Their Primary Businesses
Revenue and Net Income of Albemarle, 2010-2013
Revenue Breakdown of Albemarle by Business, 2009-2013
Sales and Net Income of Chemtura, 2009-2013
Revenue Breakdown of Chemtura by Business, 2013
Main Products of Lake LED Materials
Sales and Net Income of Nata, 2009-2013
Revenue Breakdown of Nata by Product, 2009-2013
Revenue Breakdown of Nata by Region, 2009-2013
Gross Margin of Nata by Product, 2009-2013
Sales Volume and Unit Price of Nata, 2010-2015E
Key Projects of Nata, 2011-2013
Production Capacity and Global Market Share of Nata, 2010-2015E
Global MO Source Production and Demand, 2010-2015E
China MO Source Production and Demand, 2010-2015E
Total Output Value of LED Chip in China, 2010-2015E
Global and China Photoresist Industry Report, 2021-2026
Since its invention in 1959, photoresist has been the most crucial process material for the semiconductor industry. Photoresist was improved as a key material used in the manufacturing process of prin...
Global and China Needle Coke Industry Report, 2021-2026
Needle coke is an important carbon material, featuring a low thermal expansion coefficient, a low electrical resistivity, and strong thermal shock resistance and oxidation resistance. It is suitable f...
Global and China 3D Glass Industry Report, 2021-2026
3D curved glass is light and thin, transparent and clean, anti-fingerprint, anti-glare, hard and scratch-resistant, and performs well in weather resistance. It is applicable to terminals such as high-...
Global and China Graphene Industry Report, 2020-2026
Graphene, a kind of 2D carbon nanomaterial, features excellent properties such as mechanical property and super electrical conductivity and thermal conductivity. Its downstream application ranges from...
Global and China 3D Glass Industry Report, 2020-2026
Global 3D glass market has been enlarging over the recent years amid demetallization of smartphone back covers and popularity of smart wearables, to approximately $2.86 billion in 2019 and to an estim...
Global and China Photoresist Industry Report, 2020-2026
In 2019, global photoresist market was valued at $8.3 billion, growing at a compound annual rate of 5.1% or so since 2010, and it will outnumber $12.7 billion in 2026 with advances in electronic techn...
Global and China Synthetic Diamond Industry Report, 2020-2026
While its mechanical property is given full play in fields like grinding and cutting, diamond with acoustic, optical, magnetic, thermal and other special properties, as superconducting material, intel...
Global and China Needle Coke Industry Report, 2020-2026
With the merits like small resistivity, excellent resistance to impact and good anti-oxidation property, needle coke has been widely used in ultra-high power graphite electrodes, nuclear reactor decel...
Global and China Optical Fiber Preform Industry Report, 2019-2025
Optical fiber preform, playing an important role in the optical fiber and cable industry chain, seizes about 70% profits of optical fiber. Global demand for optical fiber preform stood at 16.2kt in 20...
China Silicon Carbide Industry Report, 2019-2025
Silicon carbide (SiC) is the most mature and the most widely used among third-generation wide band gap semiconductor materials. Over the past two years, global SiC market capacity, however, hovered ar...
Global and China Photoresist Industry Report, 2019-2025
Photoresist, a sort of material indispensable to PCB, flat panel display, optoelectronic devices, among others, keeps expanding in market size amid the robust demand from downstream sectors. In 2018, ...
Global and China Graphene Industry Report, 2019-2025
Graphene is featured with excellent performance and enjoys a rosy prospect. The global graphene market was worth more than $100 million in 2018, with an anticipated CAGR of virtually 45% between 2019 ...
Global and China 3D Glass Industry Chain Report, 2019-2025
The evolution of AMOLED conduces to the steady development of 3D curved glass market. In 2018, the global 3D glass market expanded 37.7% on an annualized basis and reached $1.9 billion, a figure proje...
China Wood Flooring Industry Report, 2019-2025
With the better standard of living and the people’s desire for an elegant life, wood flooring sees a rising share in the flooring industry of China, up from 33.9% in 2009 to 38.9% in 2018, just behind...
Global and China Photovoltaic Glass Industry Report, 2019-2025
In China, PV installed capacity has ramped up since the issuance of photovoltaic (PV) subsidy policies, reaching 53GW in 2017, or over 50% of global total. However, the domestic PV demand was hit by t...
Global and China ITO Targets Industry Chain Report, 2019-2025
Featured by good electrical conductivity and transparency, ITO targets are widely applied to fields of LCD, flat-panel display, plasma display, touch screen, electronic paper, OLED, solar cell, antist...
Global and China MO Source Industry Report, 2019-2025
MO source is a key raw material for metal-organic chemical vapor deposition (MOCVD) process. Global MO source output ranged at 102.6 tons in 2018, a rise of roughly 4.6% from a year earlier, a figure ...
Global and China Bi-Metal Band Saw Blade Industry Report, 2018-2023
Chinese manufacturing rebounded in the wake of a pick-up in infrastructure construction between 2016 and 2018, so did the bi-metal band saw blade as a key integral of metal processing industry. In 201...