China Plastic Pipe Industry Report, 2014-2017
-
Aug.2014
- Hard Copy
- USD
$2,350
-
- Pages:98
- Single User License
(PDF Unprintable)
- USD
$2,200
-
- Code:
CYH030
- Enterprise-wide License
(PDF Printable & Editable)
- USD
$3,300
-
- Hard Copy + Single User License
- USD
$2,550
-
China has become the world's largest producer and consumer of plastic pipes. In 2013, China’s plastic pipe output and demand reached 12.1 million tons and 11.117 million tons respectively, representing the respective year-on-year increase of 10.0% and 7.1%. The output of PVC pipes is higher than that of other plastic pipe varieties in China, followed by the output of PE pipes and PP pipes. In 2013, China’s PVC pipe output hit 6.59 million tons, accounting for 54.5% of China’s total plastic pipe output, while the output of PE pipes and PP pipes shared 40.5% together.
Municipal water supply and drainage, building water supply and drainage and other fields act as the downstream of China plastic pipe industry. In 2013, the downstream demand accounted for 69.8% of China's total demand for plastic pipes together. Propelled by the construction of Chinese municipal underground pipe network and drinking water facilities, the share of the downstream demand is expected to rise to 75.4% in 2017.
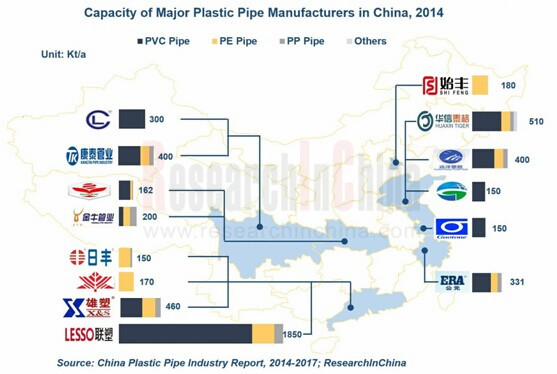
Currently, numerous Chinese plastic pipe enterprises are small-sized. 300 companies achieve the annual capacity of more than 10,000 tons each, while only about 15 enterprises have the annual capacity of 200,000 tons or more. To improve competitiveness and market share, China Lesso, Yonggao, Weixing New Building Materials, Cangzhou Mingzhu, Newchoice Pipe Technology, Goody Science & Technology and Shandong Huaxin Plastic Pipe have expanded capacity in a successive way.
China Lesso is China's largest manufacturer of plastic pipes. By the end of 2013, the company had set up 18 production bases in Guangdong, Guizhou, Sichuan, Hubei and other places, with the annual capacity of 1.8 million tons. In 2014, the company established new production bases in Hainan, Yunnan and Shandong. The additional plastic pipe capacity of 50,000 tons is expected to be realized at the end of 2014.
Yonggao is one of major producers of plastic pipes in China. As of the end of 2013, the company had been able to produce 231,000 tons of plastic pipes each year. The company is building an 80,000 tons/a plastic pipe project in Huangyan and a 50,000 tons/a plastic pipe project in Tianjin, both of which are expected to go into operation at the end of 2014. In 2011-2013, the company acquired Anhui Guangde Jinpeng Science and Technology Development Co., Ltd., Guangde Jiahe New Materials Co., Ltd and other companies to constantly improve its industrial chain layout.
Newchoice Pipe Technology is one of key HDPE reinforced winding pipe and related fitting enterprises in China, with the main products DN600-DN1400 series. In June 2013, the company began a 4,800 tons/a HDPE reinforced winding pipe project in Jiangsu, which is expected to go into production before the end of 2014. Besides, the company will start building a 4,800 tons/a HDPE reinforced winding pipe project in Sichuan in the second half of 2014. Once these two projects are put into production, the company’s annual capacity of HDPE reinforced winding pipes will hit 35,100 tons.
?
The report focuses on the followings:
 Supply & demand, import & export, product mix, regional structure, competitive landscape, price, etc of China plastic pipe industry;
Supply & demand, import & export, competition pattern and development trends of Chinese plastic pipe market segments (PVC pipe, PE pipe and PP pipe);
Development, demand for downstream plastic pipes and development trends of China plastic pipe downstream industries (municipal drains, water supply pipes and gas pipes, etc.);
Operation, plastic pipe business (capacity, output, sales volume, projects under construction, etc.) and development prospects of 12 Chinese plastic pipe manufacturers;
Forecast for China’s plastic pipe trends in 2014-2017.
1 Overview of Plastic Pipe Industry
1.1 Definition
1.2 Classification
2 Development of Chinese Plastic Pipe Market
2.1 Global Market
2.2 China’s Market Supply and Demand
2.2.1 Supply
2.2.2 Demand
2.3 China’s Import and Export
2.3.1 Import
2.3.2 Export
2.4 Product Structure
2.5 Regional Structure
2.6 Competition Pattern
2.7 Price
3 Development of Chinese Plastic Pipe Market Segments
3.1 PVC Pipe
3.1.1 Supply and Demand
3.1.2 Import
3.1.3 Export
3.1.4 Development Trend
3.2 PE Pipe
3.2.1 Supply and Demand
3.2.2 Import
3.2.3 Export
3.2.4 Competition Pattern
3.2.5 Development Trend
3.3 PP Pipe
3.3.1 Supply and Demand
3.3.2 Import
3.3.3 Export
3.3.4 Competition Pattern
4 Development of China Plastic Pipe Downstream Industry
4.1 Municipal Water Supply Pipe
4.1.1 Status Quo
4.1.2 Development Trend
4.2 Municipal Drainage Pipe
4.3 Municipal Gas Pipe
4.4 Others
5 Major Chinese Plastic Pipe Enterprises
5.1 China Lesso (2128.HK)
5.1.1 Profile
5.1.2 Operation
5.1.3 Revenue Structure
5.1.4 Plastic Pipe Business
5.1.5 Prospect
5.2 Yonggao (002641)
5.2.1 Profile
5.2.2 Operation
5.2.3 Revenue Structure
5.2.4 Gross Margin
5.2.5 Clients and Suppliers
5.2.6 R & D and Projects under Construction
5.2.7 Prospect
5.3 Zhejiang Weixing New Building Materials (002372)
5.3.1 Profile
5.3.2 Operation
5.3.3 Revenue Structure
5.3.4 Gross Margin
5.3.5 R & D and Projects under Construction
5.3.6 Prospect
5.4 Cangzhou Mingzhu Plastic (002108)
5.4.1 Profile
5.4.2 Operation
5.4.3 Revenue Structure
5.4.4 Gross Margin
5.4.5 Clients and Suppliers
5.4.6 R & D and Projects under Construction
5.4.7 Plastic Pipe Business
5.4.8 Prospect
5.5 Goody Science & Technology (002694)
5.5.1 Profile
5.5.2 Operation
5.5.3 Revenue Structure
5.5.4 Gross Margin
5.5.5 Clients and Suppliers
5.5.6 R & D and Projects under Construction
5.5.7 Capacity, Output and Sales Volume
5.5.8 Prospect
5.6 Qinglong Pipe Industry (002457)
5.6.1 Profile
5.6.2 Operation
5.6.3 Revenue Structure
5.6.4 Gross Margin
5.6.5 Clients and Suppliers
5.6.6 R & D and Projects under Construction
5.6.7 Plastic Pipe Business
5.6.8 Prospect
5.7 Xinjiang Guotong Pipeline (002205)
5.7.1 Profile
5.7.2 Operation
5.7.3 Revenue Structure
5.7.4 Gross Margin
5.7.5 Clients and Suppliers
5.7.6 R & D
5.7.7 Prospect
5.8 Newchoice Pipe Technology (300198)
5.8.1 Profile
5.8.2 Operation
5.8.3 Revenue Structure
5.8.4 Gross Margin
5.8.5 Capacity, Output and Sales Volume
5.8.6 R & D and Projects under Construction
5.8.7 Clients and Suppliers
5.8.8 Prospect
5.9 Anhui Guotong Hi-Tech Pipes Industry (600444)
5.9.1 Profile
5.9.2 Operation
5.9.3 Revenue Structure
5.9.4 Gross Margin
5.9.5 Prospect
5.10 Sinopipe Holdings Limited
5.10.1 Profile
5.10.2 Operation
5.10.3 Revenue Structure
5.11 Shandong Huaxin Plastic Pipe
5.12 Shandong Luyu Plastic Industry
6 Summary and Forecast
6.1 Summary
6.2 Forecast
Classification and Application of Plastic Pipes (by Material)
Global Plastic Pipe Demand (by Region), 2013
Global Plastic Pipe Output and Per Capita Consumption (by Country/Year)
China’s Plastic Pipe Capacity and YoY Growth, 2004-2014
China’s Plastic Pipe Output and YoY Growth, 2004-2014
China’s Plastic Pipe Demand Structure (by Application), 2011&2013&2017
China’s Import Volume and Value of Plastic Pipes and Accessories, 2009-2014
China’s Import Volume Structure of Plastic Pipes and Accessories (by Country), 2013
China’s Export Volume and Value of Plastic Pipes and Accessories, 2009-2014
Share of Top 10 Export Destinations of Chinese Plastic Pipes and Accessories by Export Volume, 2013
China’s Plastic Pipe Output (by Type), 2013&2017E
Proportion of Total Plastic Pipe Output of Top Three Regions in China, 2001-2013
Market Share of Top 20 Enterprises in China Plastic Pipe Industry by Output, 2003-2014
Capacity Proportion of Top 10 Plastic Pipe Companies in China, 2013-2014
China's Plastic Pipe Guiding Price (by Product), 2008-2014
China's PVC Pipe Output and YoY Growth, 2011-2017E
China's PVC Rigid Pipe Import Volume and YoY Growth, 2009-2014
China's PVC Rigid Pipe Import Value and YoY Growth, 2009-2014
China's PVC Rigid Pipe Export Volume and YoY Growth, 2009-2014
China's PVC Rigid Pipe Export Value and YoY Growth, 2009-2014
China's PE Pipe Output and YoY Growth, 2011-2017E
Global HDPE Pipe Demand (by Region), 1990-2010
China's PE Rigid Pipe Import Volume and YoY Growth, 2009-2014
China's PE Rigid Pipe Import Value and YoY Growth, 2009-2014
China's PE Rigid Pipe Export Volume and YoY Growth, 2009-2014
China's PE Rigid Pipe Export Value and YoY Growth, 2009-2014
Capacity of Major Chinese PE Pipe Enterprises, 2010-2014
China's PP Pipe Output and YoY Growth, 2011-2017E
China's PP Rigid Pipe Import Volume and YoY Growth, 2009-2014
China's PP Rigid Pipe Import Value and YoY Growth, 2009-2014
China's PP Rigid Pipe Export Volume and YoY Growth, 2009-2014
China's PP Rigid Pipe Export Value and YoY Growth, 2009-2014
Capacity and Sources of Raw Materials of Major Chinese PP-R Pipe Enterprises, 2010 & 2013
Application of Plastic Pipes
China's Urban Water Supply Pipe Length and YoY Growth, 2003-2013
China's Urban Hot Water Pipe Length and YoY Growth, 2003-2013
China's Demand for Municipal Water Supply Plastic Pipes and YoY Growth, 2007-2017E
China's Urban Drainage Pipe Length and Density, 2006-2013
China's Demand for Municipal Drainage Plastic Pipes and YoY Growth, 2007-2017E
China's Urban Pipe Length (by Gas), 2005-2013
China's Demand for Municipal Gas Plastic Pipes and YoY Growth, 2007-2017E
Revenue and Net Income of China Lesso, 2007-2013
Revenue of China Lesso (by Product), 2009-2013
Revenue Structure of China Lesso (by Region), 2009-2013
Plastic Pipe Sales Volume and YoY Growth of China Lesso (by Product), 2009-2013
Average Selling Price of Plastic Pipe of China Lesso (by Product), 2009-2013
Plastic Pipe Revenue Breakdown and Percentage of China Lesso (by Application), 2010-2013
Revenue and Net Income of China Lesso, 2013-2017E
Yonggao's Capacity (by Region / Product), 2013
Yonggao's Revenue and Net Income, 2008-2014
Yonggao's Operating Revenue Structure (by Product), 2009-2013
Yonggao's Operating Revenue (by Region), 2009-2013
Yonggao's Gross Margin (by Product), 2008-2013
Yonggao's Procurement from Top 5 Suppliers and % of Total Procurement, 2008-2013
Yonggao's Revenue from Top 5 Clients and % of Total Revenue, 2008-2013
R & D Costs and % of Total Revenue of Yonggao, 2008-2013
Yonggao's Main Projects under Construction, 2014
Yonggao's Revenue and Net Income, 2013-2017E
Capacity of Zhejiang Weixing New Building Materials (by Product), 2007-2014
Revenue and Net Income of Zhejiang Weixing New Building Materials, 2008-2014
Operating Revenue Structure of Zhejiang Weixing New Building Materials (by Product), 2009-2013
Operating Revenue Structure of Zhejiang Weixing New Building Materials (by Region), 2009-2013
Gross Margin of Zhejiang Weixing New Building Materials (by Product), 2009-2013
R & D Costs and % of Total Revenue of Zhejiang Weixing New Building Materials, 2008-2013
Revenue and Net Income of Zhejiang Weixing New Building Materials, 2013-2017E
Revenue and Net Income of Cangzhou Mingzhu Plastic, 2008-2014
Operating Revenue of Cangzhou Mingzhu Plastic (by Product), 2009-2013
Operating Revenue of Cangzhou Mingzhu Plastic (by Region), 2009-2013
Gross Margin of Cangzhou Mingzhu Plastic (by Product), 2009-2013
Procurement of Cangzhou Mingzhu Plastic from Top 5 Suppliers and % of Total Procurement, 2010-2013
Top 5 Clients and Contribution of the Largest Client of Cangzhou Mingzhu Plastic, 2010-2013
R & D Costs and % of Total Revenue of Cangzhou Mingzhu Plastic, 2009-2013
Major Projects of Cangzhou Mingzhu Plastic, 2014
PE Pipe Capacity of Cangzhou Mingzhu Plastic (by Base), 2010-2015E
PE Pipe Output and Sales Volume of Cangzhou Mingzhu Plastic, 2005-2013
Revenue and Net Income of Cangzhou Mingzhu Plastic, 2013-2017E
Revenue and Net Income of Goody Science & Technology, 2009-2014
Operating Revenue of Goody Science & Technology (by Product), 2009-2013
Operating Revenue of Goody Science & Technology (by Region), 2009-2013
Gross Margin of Goody Science & Technology (by Product), 2009-2013
Procurement of Goody Science & Technology from Top 5 Suppliers and % of Total Procurement, 2009-2013
Goody Science & Technology’s Revenue from Top 5 Clients and % of Total Revenue, 2009-2013
R & D Costs and % of Total Revenue of Goody Science & Technology, 2009-2013
Major Projects under Construction of Goody Science & Technology, 2014
Capacity of Goody Science & Technology (by Product), 2013-2014
Output of Goody Science & Technology (by Product), 2009-2013
Sales Volume of Goody Science & Technology (by Product), 2009-2013
Revenue and Net Income of Goody Science & Technology, 2013-2017E
Revenue and Net Income of Qinglong Pipe Industry, 2008-2014
Operating Revenue of Qinglong Pipe Industry (by Product), 2009-2013
Revenue of Qinglong Pipe Industry (by Region), 2009-2013
Gross Margin of Qinglong Pipe Industry (by Product), 2009-2013
Procurement of Qinglong Pipe Industry from Top 5 Suppliers and % of Total Procurement, 2007-2013
Revenue of Qinglong Pipe Industry from Top 5 Clients and % of Total Revenue, 2007-2013
R & D Costs and % of Total Revenue of Qinglong Pipe Industry, 2009-2013
Major Projects under Construction of Qinglong Pipe Industry, 2014
Plastic Pipe Revenue and YoY Growth of Qinglong Pipe Industry (by Product), 2007-2013
Plastic Pipe Output, Sales Volume and Sales-output Ratio of Qinglong Pipe Industry, 2012-2013
Revenue and Net Income of Qinglong Pipe Industry, 2013-2017E
Revenue and Net Income of Xinjiang Guotong Pipeline, 2008-2014
Operating Revenue of Xinjiang Guotong Pipeline (by Product), 2009-2013
Operating Revenue Structure of Xinjiang Guotong Pipeline (by Region), 2013
Gross Margin of Xinjiang Guotong Pipeline (by Product), 2009-2013
Top 5 Suppliers and Contribution of the Largest Supplier of Xinjiang Guotong Pipeline, 2010-2013
Top 5 Clients and Contribution of the Largest Client of Xinjiang Guotong Pipeline, 2010-2013
R & D Costs and % of Total Revenue of Xinjiang Guotong Pipeline, 2008-2013
Revenue and Net Income of Xinjiang Guotong Pipeline, 2013-2017E
HDPE Reinforced Winding Pipe Capacity of Newchoice Pipe Technology (by Base), 2007-2014
Revenue and Net Income of Newchoice Pipe Technology, 2008-2014
Operating Revenue of Newchoice Pipe Technology (by Product), 2009-2013
HDPE Pipe Revenue Breakdown and Percentage of Newchoice Pipe Technology (by Region), 2012-2013
Gross Margin of Newchoice Pipe Technology (by Product), 2009-2013
HDPE Reinforced Winding Pipe Capacity and YoY Growth of Newchoice Pipe Technology, 2007-2015E
Plastic Pipe Output and Sales Volume of Newchoice Pipe Technology, 2007-2013
R & D Costs and % of Total Revenue of Newchoice Pipe Technology, 2008-2013
Main Projects under Construction of Newchoice Pipe Technology, 2014
Procurement of Newchoice Pipe Technology from Top 5 Suppliers and % of Total Procurement, 2007-2013
Revenue of Newchoice Pipe Technology from Top 5 Clients and % of Total Revenue, 2007-2013
Revenue and Net Income of Newchoice Pipe Technology, 2007-2013
Revenue and YoY Growth of Anhui Guotong Hi-Tech Pipes Industry, 2009-2014
Operating Revenue of Anhui Guotong Hi-Tech Pipes Industry (by Product), 2009-2013
Operating Revenue of Anhui Guotong Hi-Tech Pipes Industry (by Region), 2009-2013
Gross Margin of Anhui Guotong Hi-Tech Pipes Industry (by Product), 2009-2013
Revenue and Net Income of Anhui Guotong Hi-Tech Pipes Industry, 2013-2017E
Revenue and Net Income of Sinopipe Holdings Limited, 2011-2014
Revenue Breakdown and Percentage of Sinopipe Holdings Limited (by Application), 2012-2014
Capacity of Shandong Huaxin Plastic Pipe (by Product), 2013-2014
Revenue and CAGR of Major Chinese Plastic Pipe Enterprises, 2009-2014
Capacity of Top 30 Plastic Pipe Enterprises in China, 2010-2014
China’s Plastic Pipe Capacity and Output, 2013-2017E
China’s Plastic Pipe Development Trend (by Application)
Global and China Photoresist Industry Report, 2021-2026
Since its invention in 1959, photoresist has been the most crucial process material for the semiconductor industry. Photoresist was improved as a key material used in the manufacturing process of prin...
Global and China Needle Coke Industry Report, 2021-2026
Needle coke is an important carbon material, featuring a low thermal expansion coefficient, a low electrical resistivity, and strong thermal shock resistance and oxidation resistance. It is suitable f...
Global and China 3D Glass Industry Report, 2021-2026
3D curved glass is light and thin, transparent and clean, anti-fingerprint, anti-glare, hard and scratch-resistant, and performs well in weather resistance. It is applicable to terminals such as high-...
Global and China Graphene Industry Report, 2020-2026
Graphene, a kind of 2D carbon nanomaterial, features excellent properties such as mechanical property and super electrical conductivity and thermal conductivity. Its downstream application ranges from...
Global and China 3D Glass Industry Report, 2020-2026
Global 3D glass market has been enlarging over the recent years amid demetallization of smartphone back covers and popularity of smart wearables, to approximately $2.86 billion in 2019 and to an estim...
Global and China Photoresist Industry Report, 2020-2026
In 2019, global photoresist market was valued at $8.3 billion, growing at a compound annual rate of 5.1% or so since 2010, and it will outnumber $12.7 billion in 2026 with advances in electronic techn...
Global and China Synthetic Diamond Industry Report, 2020-2026
While its mechanical property is given full play in fields like grinding and cutting, diamond with acoustic, optical, magnetic, thermal and other special properties, as superconducting material, intel...
Global and China Needle Coke Industry Report, 2020-2026
With the merits like small resistivity, excellent resistance to impact and good anti-oxidation property, needle coke has been widely used in ultra-high power graphite electrodes, nuclear reactor decel...
Global and China Optical Fiber Preform Industry Report, 2019-2025
Optical fiber preform, playing an important role in the optical fiber and cable industry chain, seizes about 70% profits of optical fiber. Global demand for optical fiber preform stood at 16.2kt in 20...
China Silicon Carbide Industry Report, 2019-2025
Silicon carbide (SiC) is the most mature and the most widely used among third-generation wide band gap semiconductor materials. Over the past two years, global SiC market capacity, however, hovered ar...
Global and China Photoresist Industry Report, 2019-2025
Photoresist, a sort of material indispensable to PCB, flat panel display, optoelectronic devices, among others, keeps expanding in market size amid the robust demand from downstream sectors. In 2018, ...
Global and China Graphene Industry Report, 2019-2025
Graphene is featured with excellent performance and enjoys a rosy prospect. The global graphene market was worth more than $100 million in 2018, with an anticipated CAGR of virtually 45% between 2019 ...
Global and China 3D Glass Industry Chain Report, 2019-2025
The evolution of AMOLED conduces to the steady development of 3D curved glass market. In 2018, the global 3D glass market expanded 37.7% on an annualized basis and reached $1.9 billion, a figure proje...
China Wood Flooring Industry Report, 2019-2025
With the better standard of living and the people’s desire for an elegant life, wood flooring sees a rising share in the flooring industry of China, up from 33.9% in 2009 to 38.9% in 2018, just behind...
Global and China Photovoltaic Glass Industry Report, 2019-2025
In China, PV installed capacity has ramped up since the issuance of photovoltaic (PV) subsidy policies, reaching 53GW in 2017, or over 50% of global total. However, the domestic PV demand was hit by t...
Global and China ITO Targets Industry Chain Report, 2019-2025
Featured by good electrical conductivity and transparency, ITO targets are widely applied to fields of LCD, flat-panel display, plasma display, touch screen, electronic paper, OLED, solar cell, antist...
Global and China MO Source Industry Report, 2019-2025
MO source is a key raw material for metal-organic chemical vapor deposition (MOCVD) process. Global MO source output ranged at 102.6 tons in 2018, a rise of roughly 4.6% from a year earlier, a figure ...
Global and China Bi-Metal Band Saw Blade Industry Report, 2018-2023
Chinese manufacturing rebounded in the wake of a pick-up in infrastructure construction between 2016 and 2018, so did the bi-metal band saw blade as a key integral of metal processing industry. In 201...