Global and China Carbon Fiber Industry Report, 2014-2017
-
Jan.2015
- Hard Copy
- USD
$2,500
-
- Pages:116
- Single User License
(PDF Unprintable)
- USD
$2,350
-
- Code:
HK054
- Enterprise-wide License
(PDF Printable & Editable)
- USD
$3,700
-
- Hard Copy + Single User License
- USD
$2,700
-
Carbon fiber is the new-generation reinforced fiber, mainly used in the fields of aerospace, industry, sports and leisure. In 2014, the global industrial applications like natural gas, wind power and automobiles showed the largest demand for carbon fiber, 64% or so.
In 2014, the global carbon fiber capacity totaled approximately 130 kt, mainly contributed by Japan, Europe and the U.S.. The world's top five companies -- Toray, Teijin, Mitsubishi Rayon, Germany SGL and Formosa Plastics shared 60% of the global carbon fiber capacity together.
Due to excellent performance, the market demand for carbon fiber has been strong. The global carbon fiber demand amounted to 70kt or more in 2014. Specifically, the demand from automotive lightweight grows faster, which attracts many companies to get involved in this field. SGL and BMW cooperate to make use of carbon fiber materials in the body structure of BMW i3 and i8. Toyota will use Toray’s carbon fiber for Mirai fuel cell vehicles.
In 2014, China carbon fiber industry took shape, the T300 carbon fiber made in China partially replaced the imported one, and T700 and T800 technologies made breakthroughs. However, the Chinese producers hold backward technologies and pay high production costs; coupled with the declining international carbon fiber price in recent three years, Chinese carbon fiber enterprises are confronted with operating difficulties with a low operating rate. In 2014, China's output of carbon fiber only reached about 3kt, and the self-sufficiency rate was less than 20%.
In 2014, there were more than 30 Chinese carbon fiber manufacturers, but only Jiangsu Hengshen Fiber Material and Zhongfu Shenying Carbon Fiber achieved the respective output of above 1 kt, while the carbon fiber devices of some enterprises were in a shutdown state. At present, China’s planned / ongoing carbon fiber capacity hits 30 kt or more, but Chinese carbon fiber companies will delay or cancel some projects under greater pressure incurred by foreign competitors.
Despite China's low output growth rate, the demand for carbon fiber grows quickly and may ascend at the expected growth rate of more than 20% during 2015-2017. The favorable national policies and huge market potentials have prompted a number of listed companies to step in the field of carbon fiber, such as Kingfa, Fangda Carbon, Beijing Urban Construction, Hebang, Kangdexin and so forth.
?
The report mainly covers the followings:
 Supply and demand, competition pattern, price analysis and development trend of the global carbon fiber industry;
Supply and demand, competition pattern, import and export, price analysis and development trend of Chinese carbon fiber industry;
Operation and carbon fiber business of nine overseas carbon fiber manufacturers;
Operation, carbon fiber business and development trend of eight carbon fiber manufacturers as well as the developments of 28 carbon fiber producers in Mainland China.
1 Overview of Carbon Fiber
1.1 Definition and Properties
1.2 Technological Process
1.3 Classification
1.4 Application
2 Global Carbon Fiber Market
2.1 Status Quo
2.2 Supply and Demand
2.2.1 Supply
2.2.2 Demand
2.3 Competition Pattern
2.4 Price
3 Chinese Carbon Fiber Market
3.1 Status Quo
3.2 Supply and Demand
3.2.1 Supply
3.2.2 Demand
3.3 Import and Export
3.3.1 Carbon Fiber
3.3.2 Other Carbon Fiber Products
3.4 Price
4 Key Overseas Companies
4.1 Toray
4.1.1 Profile
4.1.2 Operation
4.1.3 Operation of Carbon Fiber Division
4.1.4 Carbon Fiber Business
4.1.5 Business in China
4.2 Zoltek
4.2.1 Profile
4.2.2 Operation
4.2.3 Carbon Fiber Business
4.2.4 Development of Carbon Fiber Business
4.3 Teijin
4.3.1 Profile
4.3.2 Operation
4.3.3 Carbon Fiber Business
4.3.4 Business in China
4.4 Mitsubishi Chemical Corporation
4.4.1 Profile
4.4.2 Operation
4.4.3 Carbon Fiber Business
4.5 Kureha
4.5.1 Profile
4.5.2 Operation
4.5.3 Operation of Advanced Materials Division
4.5.4 Carbon Fiber Business
4.6 Hexcel
4.6.1 Profile
4.6.2 Operation
4.6.3 Revenue Structure
4.6.4 Carbon Fiber Business
4.7 CYTEC
4.7.1 Profile
4.7.2 Operation
4.7.3 Operation of Engineering Materials Division
4.7.4 Carbon Fiber Business
4.8 SGL
4.8.1 Profile
4.8.2 Operation
4.8.3 Operation of Carbon Fiber and Composite Materials Division
4.8.4 Carbon Fiber Business
4.9 Formosa Plastics
4.9.1 Profile
4.9.2 Operation
4.9.3 Carbon Fiber Business Operation
4.9.4 Carbon Fiber Output and Sales Volume
5 Key Enterprises in Mainland China
5.1 Sinosteel Jilin Carbon Co., Ltd.
5.1.1 Profile
5.1.2 Operation
5.1.3 Revenue Structure
5.1.4 Gross Margin
5.1.5 Customers
5.1.6 Carbon Fiber Business
5.1.7 Forecast and Prospect
5.2 Jilin Qifeng Chemical Fiber Co., Ltd.
5.2.1 Profile
5.2.2 Operation
5.2.3 Revenue Structure
5.2.4 Gross Margin
5.2.5 Output and Sales Volume
5.2.6 Selling Price
5.2.7 Carbon Fiber Business
5.2.8 Forecast and Prospect
5.3 Kingfa
5.3.1 Profile
5.3.2 Operation
5.3.3 Carbon Fiber Business
5.4 Fangda Carbon
5.4.1 Profile
5.4.2 Operation
5.4.3 Carbon Fiber Business
5.5 Beijing Urban Construction
5.5.1 Profile
5.5.2 Operation
5.5.3 Carbon Fiber Business
5.6 Swan Fiber
5.6.1 Profile
5.6.2 Operation
5.6.3 Carbon Fiber Business
5.7 Ningxia Dayuan Chemical Co., Ltd.
5.7.1 Profile
5.7.2 Operation
5.7.3 Revenue Structure
5.7.4 Gross Margin
5.7.5 Customers
5.7.6 Carbon Fiber Business
5.7.7 Forecast and Prospect
5.8 Jiangsu Tianniao
5.8.1 Profile
5.8.2 Operation
5.8.3 Revenue Structure
5.8.4 Gross Margin
5.8.5 Carbon Fiber Business
5.9 Other Manufacturers
5.9.1 Zhongfu Shenying Carbon Fiber
5.9.2 Shanxi Hengtian
5.9.3 Weihai Tuozhan
5.9.4 PetroChina Jilin Petrochemical
5.9.5 Anshan Sinocarb
5.9.6 Jiangsu Hengshen Fiber Material
5.9.7 Anhui Xinfeng
5.9.8 Tianshun Chemical
5.9.9 Handan Silicon Valley (HSVC)
5.9.10 HNEC Yongmei Carbon Fiber
5.9.11 Shenyang Zhongheng New Materials
5.9.12 Sichuan Xinwanxing Carbon Fiber Composites
5.9.13 Xi'an Carbon Materials
5.9.14 Zhejiang Juxin Carbon Fiber
5.9.15 Anhui Shouwen
5.9.16 Gansu Haoshi
5.9.17 Sinofibers Technology
5.9.18 Dalian Xingke
5.10 Proposed and Ongoing Projects
5.10.1 Shanghai Petrochemical
5.10.2 Ordos Yaxin Carbon Fiber
5.10.3 Shanxi Hongte
5.10.4 Shandong Xintian
5.10.5 Xinjiang Chuangyue
5.10.6 Dalian Guorui
5.10.7 Taiyuan Iron & Steel Group
5.10.8 Bluestar Weibang
5.10.9 Hebang
5.10.10 Kangdexin
6 Summary and Forecast
6.1 Summary
6.2 Forecast for Supply and Demand
6.2.1 Global Market
6.2.2 Chinese Market
PAN-based Carbon Fiber Production Process
Classification of Carbon Fiber Products by Number of Carbon Fibers per Tow
Classification of Carbon Fiber by Mechanical Properties
Classification and Main Application of Carbon Fiber and Its Composites
Specific Applications of Deep-processed Carbon Fiber Composite Products
Global Carbon Fiber Capacity and Growth Rate, 2009-2014
Global Carbon Fiber Demand and Growth Rate, 2009-2014
Global Carbon Fiber Application Structure, 2014
Global Carbon Fiber Capacity Structure by Manufacturer (by Capacity of Carbon Fiber Tow), 2014
Average Selling Price of Carbon Fiber of Formosa Plastics, 2007-2014
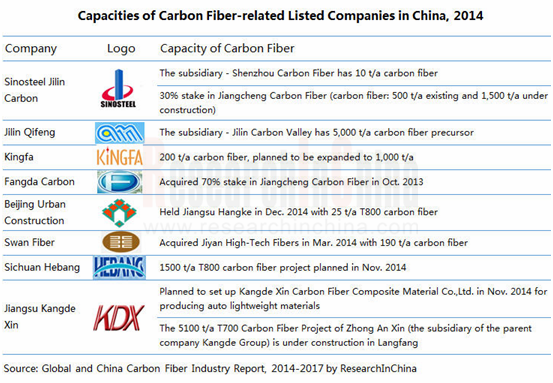
Major Carbon Fiber Manufacturers and Their Capacities in China, 2014
Carbon Fiber Projects under Planning/Construction in China, 2015
China's Carbon Fiber Demand and YoY Growth Rate, 2009-2014
China's Carbon Fiber Consumption Structure, 2014
China's Carbon Fiber Import and Export Volume, 2010-2014
Average Prices of China's Carbon Fiber Imports and Exports, 2010-2014
China's Carbon Fiber Import Source Structure (by Import Volume), Jan-Nov 2014
China's Carbon Fiber Export Destination Structure (by Export Volume), Jan-Nov 2014
China's Import and Export Volume of Other Carbon Fiber Products, 2010-2014
Average Import and Export Prices of China's Other Carbon Fiber Products, 2010-2014
Import Source Structure of China's Other Carbon Fiber Products (by Import Volume), Jan-Nov 2014
Export Destination Structure of China's Other Carbon Fiber Products (by Export Volume), Jan-Nov 2014
China’s Carbon Fiber Price, 2011-2013
Toray's Net Sales and Net Income, FY2010-FY2014
Toray's Sales Percentage (by Division), H1 FY2014
Net Sales and Operating Income of Toray's Carbon Fiber Division, FY2010-FY2014
Sales of Toray's Carbon Fiber Division (by Application), FY2012-FY2014
Sales Percentage of Toray's Carbon Fiber Division (by Application), FY2012-FY2014
Toray's Carbon Fiber Projects under Planning/Construction, 2015
Zoltek's Net Sales and Operating Income, FY2008-FY2013
Zoltek's Sales Percentage (by Product), FY2010-FY2013
Zoltek's Sales Percentage (by Region), FY2010-FY2012
Zoltek's Carbon Fiber Sales and Operating Income, FY2008-FY2013
Sales and Operating Income of Zoltek's Preoxidized Fiber and Special Carbon Fiber, FY2008-FY2013
Teijin's Net Sales and Net Income, FY2010-FY2014
Teijin's Sales Percentage (by Division), H1 FY2014
Sales and Operating Income of Teijin's Advanced Fiber and Composite Materials Division, FY2011-FY2014
Teijin's Carbon Fiber Subsidiaries
Toho's Main Carbon Fiber Applications
Net Sales and Net Income of Mitsubishi Chemical, FY2010-FY2014
Business Scope and Sales Percentage of Mitsubishi Chemical, H1 FY2014
Profile of Mitsubishi Rayon
Carbon Fiber Subsidiaries of Mitsubishi Rayon
Main Carbon Fiber Applications of Mitsubishi Rayon
Development of Carbon Fiber Business of Mitsubishi Rayon
Kureha's Net Sales and Net Income, FY2010-FY2014
Kureha's Sales Percentage (by Business), FY2012-FY2014
Sales and Operating Income of Kureha's Advanced Materials Division, FY2010-FY2014
Sales of Main Products of Kureha's Advanced Materials Division, FY2011-FY2013
Hexcel's Net Sales and Net Income, 2010-2014
Hexcel's Sales (by Market), 2012-2014
Hexcel's Sales Percentage (by Market), 2012-2014
Hexcel's Sales Percentage (by Region), 2011-2013
Cytec's Net Sales and Net Income, 2010-2014
Cytec's Sales Percentage (by Division), 2012-2014
Cytec's Sales Percentage (by Region), 2011-2013
Sales and Operating Income of Cytec's Aerospace Materials Division, 2011-2014
Sales Percentage of Cytec's Aerospace Materials Division (by Region), 2011-2013
SGL's Sales and EBITDA, 2010-2014
SGL's Sales Percentage (by Division), 2012-2014
SGL's Sales Percentage (by Region), 2011-2013
SGL's Sales Percentage (by Market), 2013
Sales and EBITDA of SGL's Carbon Fiber and Composite Materials Division, 2010-2014
Sales Percentage of SGL's Carbon Fiber and Composite Materials Division (by Business), 2013
Sales Percentage of SGL's Carbon Fiber and Composite Materials Division (by Market), 2013
Divisions of Formosa Plastics and Their Main Business
Revenue and Net Income of Formosa Plastics, 2010-2014
Revenue Structure of Formosa Plastics (by Division), 2013
Carbon Fiber Revenue and Average Price of Formosa Plastics, 2009-2013
Carbon Fiber Revenue Structure of Formosa Plastics (by Region), 2011-2013
Carbon Fiber Capacity, Output and Operating Rate of Formosa Plastics, 2009-2013
Carbon Fiber Sales Volume and Sales/Output Ratio of Formosa Plastics, 2009-2013
Revenue and Net Income of Sinosteel Jilin Carbon, 2010-2014
Revenue Breakdown of Sinosteel Jilin Carbon (by Product), 2012-2014
Revenue Structure of Sinosteel Jilin Carbon (by Product), 2012-2014
Revenue Breakdown of Sinosteel Jilin Carbon (by Region), 2012-2014
Revenue Structure of Sinosteel Jilin Carbon (by Region), 2012-2014
Gross Margin of Main Products of Sinosteel Jilin Carbon, 2012-2014
Revenue of Sinosteel Jilin Carbon from Top 5 Clients and % of Total Revenue, 2012-2014
Name List and Revenue Contribution of Top 5 Clients of Sinosteel Jilin Carbon, H1 2014
Revenue and Net Income of Shenzhou Carbon Fiber, 2012-2014
Revenue and Net Income of Jiangcheng Carbon Fiber, 2012-2014
Revenue and Net Income of Jilin Qifeng Chemical Fiber, 2010-2014
Revenue Breakdown of Jilin Qifeng Chemical Fiber (by Product), 2011-2013
Revenue Structure of Jilin Qifeng Chemical Fiber (by Product), 2011-2013
Gross Margin of Main Products of Jilin Qifeng Chemical Fiber, 2011-2013
Output, Sales Volume and Sales/Output Ratio of Jilin Qifeng Chemical Fiber, 2011-2013
Sales Volume of Main Products of Jilin Qifeng Chemical Fiber, 2011-2013
Product Average Selling Prices, Acrylonitrile Purchase Price and Price Difference of Jilin Qifeng Chemical Fiber, 2011-2013
Average Selling Price of Main Products of Jilin Qifeng Chemical Fiber, 2011-2013
Revenue and Net Income of Jilin Qifeng Chemical Fiber, 2013-2017E
Kingfa’s Revenue and Net Income, 2010-2014
Kingfa’s Carbon Fiber Revenue and Net Income, 2013-2014
Revenue and Net Income of Fangda Carbon, 2010-2014
Revenue and Net Income of Beijing Urban Construction, 2010-2014
Revenue and Net Income of Ningxia Dayuan Chemical, 2010-2014
Revenue Breakdown of Ningxia Dayuan Chemical (by Product), 2012-2014
Revenue Structure of Ningxia Dayuan Chemical (by Product), 2012-2014
Gross Margin of Carbon Fiber Products of Ningxia Dayuan Chemical, 2010-2014
Revenue of Ningxia Dayuan Chemical from Top 5 Clients and % of Total Revenue, 2012-2014
Name List and Revenue Contribution of Top 5 Clients of Ningxia Dayuan Chemical, H1 2014
Revenue and Net Income of Jiaxing Sino-Dia Carbon Fiber, 2012-2014
Output of Main Products of Jiaxing Sino-Dia Carbon Fiber, 2012-2014
Revenue and Net Income of Jiangsu Tianniao, 2011-2013
Revenue Breakdown of Jiangsu Tianniao (by Product), 2011-2013
Revenue Structure of Jiangsu Tianniao (by Product), 2011-2013
Revenue Breakdown of Jiangsu Tianniao (by Region), 2011-2013
Gross Margin of Main Products of Jiangsu Tianniao, 2011-2013
Capacity of Main Products of Jiangsu Tianniao, 2011-2013
Output of Main Products of Jiangsu Tianniao, 2011-2013
Sales Volume of Main Products of Jiangsu Tianniao, 2011-2013
Selling Price of Main Products of Jiangsu Tianniao, 2011-2013
Major Carbon Fiber Precursor Clients of Shanxi Hengtian New Textile Fiber Tech
Carbon Fiber Operation Comparison between Global and Chinese Major Companies, 2013
Major Global Carbon Fiber Projects under Planning/Construction, 2015
Supply and Demand of Global Carbon Fiber Industry, 2014 vs 2017E
Development of Major Global Carbon Fiber Manufacturers in the Automotive Industry, 2011-2014
Supply and Demand of China Carbon Fiber Industry, 2014 vs 2017E
China's Carbon Fiber Consumption Structure, 2014, 2017E vs 2020E
Global and China Photoresist Industry Report, 2021-2026
Since its invention in 1959, photoresist has been the most crucial process material for the semiconductor industry. Photoresist was improved as a key material used in the manufacturing process of prin...
Global and China Needle Coke Industry Report, 2021-2026
Needle coke is an important carbon material, featuring a low thermal expansion coefficient, a low electrical resistivity, and strong thermal shock resistance and oxidation resistance. It is suitable f...
Global and China 3D Glass Industry Report, 2021-2026
3D curved glass is light and thin, transparent and clean, anti-fingerprint, anti-glare, hard and scratch-resistant, and performs well in weather resistance. It is applicable to terminals such as high-...
Global and China Graphene Industry Report, 2020-2026
Graphene, a kind of 2D carbon nanomaterial, features excellent properties such as mechanical property and super electrical conductivity and thermal conductivity. Its downstream application ranges from...
Global and China 3D Glass Industry Report, 2020-2026
Global 3D glass market has been enlarging over the recent years amid demetallization of smartphone back covers and popularity of smart wearables, to approximately $2.86 billion in 2019 and to an estim...
Global and China Photoresist Industry Report, 2020-2026
In 2019, global photoresist market was valued at $8.3 billion, growing at a compound annual rate of 5.1% or so since 2010, and it will outnumber $12.7 billion in 2026 with advances in electronic techn...
Global and China Synthetic Diamond Industry Report, 2020-2026
While its mechanical property is given full play in fields like grinding and cutting, diamond with acoustic, optical, magnetic, thermal and other special properties, as superconducting material, intel...
Global and China Needle Coke Industry Report, 2020-2026
With the merits like small resistivity, excellent resistance to impact and good anti-oxidation property, needle coke has been widely used in ultra-high power graphite electrodes, nuclear reactor decel...
Global and China Optical Fiber Preform Industry Report, 2019-2025
Optical fiber preform, playing an important role in the optical fiber and cable industry chain, seizes about 70% profits of optical fiber. Global demand for optical fiber preform stood at 16.2kt in 20...
China Silicon Carbide Industry Report, 2019-2025
Silicon carbide (SiC) is the most mature and the most widely used among third-generation wide band gap semiconductor materials. Over the past two years, global SiC market capacity, however, hovered ar...
Global and China Photoresist Industry Report, 2019-2025
Photoresist, a sort of material indispensable to PCB, flat panel display, optoelectronic devices, among others, keeps expanding in market size amid the robust demand from downstream sectors. In 2018, ...
Global and China Graphene Industry Report, 2019-2025
Graphene is featured with excellent performance and enjoys a rosy prospect. The global graphene market was worth more than $100 million in 2018, with an anticipated CAGR of virtually 45% between 2019 ...
Global and China 3D Glass Industry Chain Report, 2019-2025
The evolution of AMOLED conduces to the steady development of 3D curved glass market. In 2018, the global 3D glass market expanded 37.7% on an annualized basis and reached $1.9 billion, a figure proje...
China Wood Flooring Industry Report, 2019-2025
With the better standard of living and the people’s desire for an elegant life, wood flooring sees a rising share in the flooring industry of China, up from 33.9% in 2009 to 38.9% in 2018, just behind...
Global and China Photovoltaic Glass Industry Report, 2019-2025
In China, PV installed capacity has ramped up since the issuance of photovoltaic (PV) subsidy policies, reaching 53GW in 2017, or over 50% of global total. However, the domestic PV demand was hit by t...
Global and China ITO Targets Industry Chain Report, 2019-2025
Featured by good electrical conductivity and transparency, ITO targets are widely applied to fields of LCD, flat-panel display, plasma display, touch screen, electronic paper, OLED, solar cell, antist...
Global and China MO Source Industry Report, 2019-2025
MO source is a key raw material for metal-organic chemical vapor deposition (MOCVD) process. Global MO source output ranged at 102.6 tons in 2018, a rise of roughly 4.6% from a year earlier, a figure ...
Global and China Bi-Metal Band Saw Blade Industry Report, 2018-2023
Chinese manufacturing rebounded in the wake of a pick-up in infrastructure construction between 2016 and 2018, so did the bi-metal band saw blade as a key integral of metal processing industry. In 201...