Global and China Animation Industry Report, 2014
-
June 2014
- Hard Copy
- USD
$2,500
-
- Pages:135
- Single User License
(PDF Unprintable)
- USD
$2,300
-
- Code:
LMX052
- Enterprise-wide License
(PDF Printable & Editable)
- USD
$3,800
-
- Hard Copy + Single User License
- USD
$2,700
-
China’s animation industry output value continued to grow and exceeded RMB90 billion in 2013, showing a year-on-year increase of around 21.0%. Despite the overall sustained growth, each link of the industrial chain is developing to varying degrees.
From the production and broadcast market, China’s animation production suffered three consecutive years of decline (2011-2013). In 2013 China produced 358 domestic TV cartoons, a total of 204,732 minutes long, respectively down 9.37% and 8.17% year on year, mainly because it was difficult for government subsidiaries to cover the increasingly higher costs of production. In addition, the original IP resource scarcity has been a tough and unbreakable bottleneck for domestic animation.
As another major play position for animation, the Chinese animation film market has shown a rising trend in both quantity and price since 2011. In 2013, there were a total of 33 animation films released in Chinese mainland theatres, including 24 homemade and 9 imported, generating total box office of about RMB1.64 billion, up 13.34% year on year.
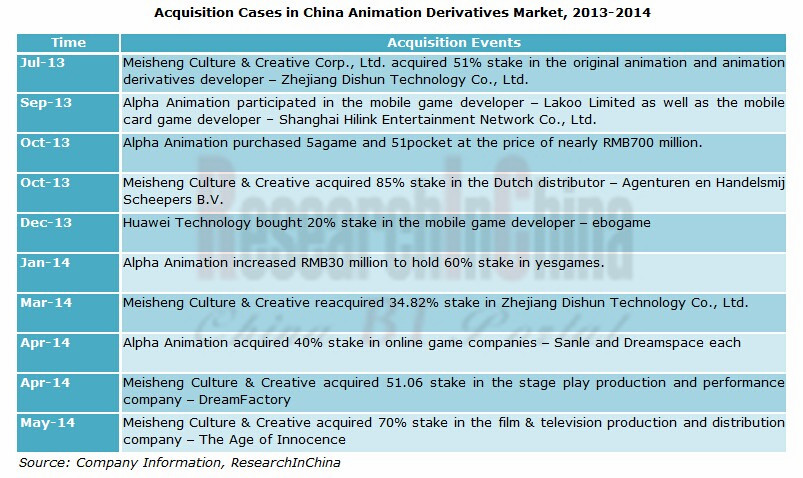
With respect to the animation derivatives market, in 2013 the domestic market size approximated RMB26.4 billion, up 20% year on year. As the core of China’s animation industry chain, the derivatives market has encountered stormy mergers and acquisitions since 2013, thus constantly improving and extending the animation industry chain. Representative firms are Guangdong Alpha Animation and Culture Co., Ltd. (Alpha Animation), Huawei Technology Co.,Ltd and Meisheng Culture & Creative Corp., Ltd.
Of which, Alpha Animation as the leader with a complete animation industry chain has continuously extended its industrial chain through the layout of online game and mobile game since 2013. In the first quarter of 2014, it gained revenue of RMB375 million (up 18.15% YoY) and net income of RMB49.8 million (up 10.28% YoY).
The toy export-oriented Huawei Technology Co.,Ltd suffered a sharp decline of 25.64% in net income in 2013, affected by the export market downturn. The performance got improved by acquiring 20% stake in ebogame in December 2012. In the first quarter of 2014, its revenue and net income climbed 10.28% and 0.82% year on year to RMB60.1 million and RMB3.6 million, respectively.
Meisheng Culture & Creative Corp., Ltd., has focusing on anime apparel, but seeing frequent mergers and acquisitions since its listing in 2013, thus realizing the full cut-through from content (Zhejiang Dishun Technology Co., Ltd.), media (DreamFactory + The Age of Innocence) to derivatives sales (the Dutch distributor). In the first quarter of 2014, its revenue and net income saw substantial increases of 218.76% and 37.36% to RMB50.7 million and RMB4 million, respectively.
Global and China Animation Industry Report, 2014 by ResearchInChina mainly covers the followings:
 Overview of global animation industry, mainly involving supportive policies, industrial pattern, as well as development model and profit model of U.S. and Japanese animation industries;
Overview of Chinese animation industry, including supportive policies, output value, company type, competition patter, etc.;
Chinese animation production and distribution markets, mainly aimed at television animation, animation film, cartoon game, caricature, new media market and animation industry base;
Chinese animation derivatives industries, involving cartoon toys, anime apparel, theme park, etc.;
Operation, anime works, business model, development strategy, performance forecast of eight transnational companies and 13 Chinese animation companies.
Preface
1. Overview of Animation Industry
1.1 Definition
1.2 Industrial Chain
1.3 Business Model
1.4 Economic Characteristics
1.5 Development Features
2. Global Animation Industry Development
2.1 Overview
2.1.1 Support Policy
2.1.2 Market Pattern
2.2 United States
2.2.1 Overview
2.2.2 Development History
2.3 Japan
2.3.1 Overview
2.3.2 Development History
2.3.3 Industrial Chain and Profit Model
2.3.4 Animation Products Analysis
3. China Animation Industry Development
3.1 Policy Support
3.2 Output Value
3.3 Enterprises Analysis
3.3.1 Major Participants
3.3.2 Production Type
3.3.3 Media Type
3.3.4 Integrated Type
3.3.5 Summary
3.4 Competition Pattern
3.4.1 Foreign Enterprises’ Layout in China
3.4.2 Enterprises’ IP Resources
4. Animation Production and Distribution Markets in China
4.1 TV Animation
4.2 Animated Film
4.3 Cartoon Game
4.4 Comic
4.5 New Media Market
4.6 Animation Industry Base
4.6.1 Overview
4.6.2 Operation Model
5. China Animation Derivative Industry
5.1 Overview
5.2 Animation Toy
5.3 Animation Apparel
5.4 Theme Park
6. Typical Enterprises in Global Animation Industry
6.1 Disney
6.1.1 Profile
6.1.2 Development History
6.1.3 Operation
6.1.4 Business Model
6.1.5 Competitive Advantages
6.2 Bandai Namco Group
6.2.1 Profile
6.2.2 Development History
6.2.3 Operation
6.2.4 Performance Forecast
6.2.5 Development Strategy
6.3 Hasbro
6.3.1 Profile
6.3.2 Development History
6.3.3 Brands
6.3.4 Operation
6.3.5 Strategy
6.4 DreamWorks
6.4.1 Profile
6.4.2 Operation
6.5 Pixar Animation
6.5.1 Profile
6.5.2 Development History
6.5.3 Operation
6.6 Toei Animation
6.6.1 Profile
6.6.2 Development History
6.6.3 Operation
6.7 Sotsu
6.7.1 Profile
6.7.2 Development History
6.7.3 Operation
6.8 Studio Ghibli
7. Typical Enterprises in China's Animation Industry
7.1 Guangdong Alpha Animation And Culture Co., Ltd.
7.1.1 Profile
7.1.2 Development History
7.1.3 Operation
7.1.4 Revenue Structure
7.1.5 Gross Margin
7.1.6 R & D Expense
7.1.7 Competitive Advantages
7.1.8 Strategic Layout
7.1.9 Performance Forecast
7.2 Global Digital Creations Holdings Limited
7.2.1 Profile
7.2.2 Development History
7.2.3 Operation
7.3 Fantawild Holdings Inc.
7.3.1 Profile
7.3.2 Business
7.3.3 Strategy
7.4 Taomee Holdings Limited
7.4.1 Profile
7.4.2 Development History
7.4.3 Operation
7.4.4 Partners
7.4.5 Advantages and Disadvantages
7.5 Toonmax Media Co., Ltd.
7.5.1 Profile
7.5.2 Business
7.5.3 Advantages and Disadvantages
7.6 Guangdong Creative Power Entertaining Co., Ltd.
7.7 Sparkly Key Animation Studio
7.7.1 Profile
7.7.2 Operation
7.8 Vasoon Animation
7.9 KAKU Media Inc.
7.9.1 Profile
7.9.2 Business Introduction
7.10 Sunchime Cartoon
7.11 CCTV ANIMATION.COM
7.12 Huawei Technology Co., Ltd
7.12.1 Profile
7.12.2 Products
7.12.3 Operation
7.12.4 Revenue Structure
7.12.5 Gross Margin
7.12.6 Clients and Suppliers
7.12.7 R & D Expense and Projects
7.12.8 Entering into Mobile Game Industry
7.12.9 Competitive Advantages
7.12.10 Performance Forecast
7.13 Meisheng Cultural & Creative Corp., Ltd.
7.13.1 Profile
7.13.2 Development Course
7.13.3 Products
7.13.4 Operation
7.13.5 Revenue Structure
7.13.6 Gross Margin
7.13.7 Strategic Layout
7.13.8 Performance Forecast
8. Market Overview and Development Forecast
8.1 Market Overview
8.1.1 Development Environment
8.1.2 Status of Industrial Chain
8.2 Development Forecast
8.2.1 Drivers
8.2.2 Output Value Forecast
Industrial Chain of Animation Industry
Business Model of Animation Industry
Characteristics of "Industrial Culturalization" and " Cultural Industrialization"
Themes included in Classic Cartoon Images in America and Japan
Broadcast of Classic Cartoon Images
Correlation Effects of Animation Industry
Support Policy and Influence of Animation Industry in Developed Nations
Support Measures of Overseas Animation Industry
Three Tiers of Global Animation Industry
Major Countries’ Animation Development
Development History of American Animation Industry
Development History of Japanese Animation Industry
Japanese Animation Industry Chain
TOP Five Comics in Japan, 2013
Output Value and YoY Change of China Animation Industry, 2009-2013
Major Participants in Animation Industry
Representative Companies in China Animation Industrial Chain
Major Animation Images and Producers in China, 2007-2013
Six Animation Satellite TV Channels in China
Major Listed Companies in Animation Derivative Industry
Revenue and Net Income of Major Listed Companies in China Animation Derivative Industry, 2013-2014
YoY Change in Revenue and Net Income of Major Listed Companies in China Animation Derivative Industry, 2013-2014
Foreign Animation Enterprises’ Layout in China
Consumption Structure in Chinese Animation Content Market, 2012
IP Brands of Hasbro
IP Brands of Guangdong Alpha Animation And Culture
Number of IP of Companies in China Animation Industry Chain
Number of Chinese Animation, 2007-2013
Length of Chinese Animation, 2007-2013
Production of Chinese Animation (by Provinces), 2013
Number of Chinese Animated Film, 2009-2013
Box Office Revenue of Animated Films in Chinese Market, 2008-2013
Proportion of Chinese Animated Film’s Box Office Revenue to Total Animated Film Revenue in China, 2009-2013
Market Scale of Network Game in China, 2011-2017E
Market Scale Structure of Network Game in China, 2011-2017
Mobile Animation Industry Development in China and Japan, 2013 (as of April 2014)
Animation Business of Top Three Telecom Operators in China
TOP10 Animation Images in Chinese New Media Market, 2013
Animation Production in National Animation Bases in China, 2012
Types of Animation Industry Bases in China
Operation Mode of China Animation Industry Base
Market Structure of Animation Derivative in China, 2013
Market Scale of Animation Toy in China, 2007-2013
Global Toy Market Scale and Expense Per Capita, 2012
Market Scale of Animation Apparel in China, 2007-2013
Domestic Animation Apparel Enterprises in China
Global Disneyland Distribution
Shenzhen Huaqiang’s Theme Parks
Profile of Disney
Development History of Disney
Revenue and Net Income of Disney, FY2010-FY2014
Revenue and Operating Income of Disney (by Business Segments), FY2011-FY2013
Revenue and Operating Income of Disney (by Business Segments), FY2013-FY2014
Value Chain of Disneyland Brand
Industry Structure of Disneyland Brand
Business Model of Disneyland
Development History of Bandai Namco Group
Milestone of Bandai Namco Group
Financials of BANDAI NAMCO Holdings Inc., FY2011-FY2014
Net Sales and Operating Income of BANDAI NAMCO Holdings Inc. (by Segments), FY2013-FY2014
Net Sales and Operating Income of BANDAI NAMCO Holdings Inc. (by Regions), FY2013-FY2014
Financials of Bandai Namco Holdings Inc., 2015E
Net Sales and Operating Income of BANDAI NAMCO Holdings Inc. (by Segments), FY2015
Net Sales and Operating Income of BANDAI NAMCO Holdings Inc. (by Regions), FY2015
Investment Plan of Bandai Namco Holdings Inc.
Development Plan of Bandai Namco Holdings Inc. in Mid-long Term
Development History of Hasbro
Development Phases of Hasbro Brands
Brands of Hasbro
Revenue of Hasbro, 2003-2013
Revenue of Hasbro, Q1 2013 and Q1 2014
Gross Margin of Hasbro, 2003-2013
Revenue Structure of Hasbro (by Region), 2010-2013
Revenue Structure of Hasbro (by Region), Q1 2013 and Q1 2014
Revenue Structure of Hasbro (by Products), 2010-2013
Revenue Structure of Hasbro (by Products), Q1 2013 and Q1 2014
Branding Plan of Hasbro
Key Promotion Brands of Hasbro, 2014
Box Office of Animated Films of DreamWorks, 1998-2014
Development History of Pixar Animation Studios
Box Office of Animated Films of Pixar Animation
Basic Information of Toei Animation
Development History of Toei Animation
Production Process of Cartoon Images of Toei Animation
Business of Toei Animation
Global Distribution of Toei Animation
Financials of Toei Animation, FY2010-FY2014
Development History of Sotsu
Revenue and Net Income of Sotsu, FY2010-FY2014
Box Office of Animated Films of Studio Ghibli
Development History of Alpha Animation, 2011-2014
Revenue and Net Income of Alpha Animation, 2009-2014
Revenue Structure of Alpha Animation (by Segments), 2010-2013
Revenue Structure of Alpha Animation (by Regions), 2006-2013
Gross Margin of Alpha Animation (by Segments), 2010-2013
R & D Expense and % of Total Revenue of Alpha Animation, 2011-2013
Industry Chain of Alpha Animation
Development Direction of Mobile Terminal Business of Alpha Animation
Business Distribution of "Jia Jia Cartoon
Distribution Channels of Alpha Animation
Cooperation between Alpha Animation and Disney
Revenue and Net Income of Alpha Animation, 2014E-2016E
Group Structure of GDC
Development History of GDC
Financials of GDC, 2009-2013
Financials of GDC, 2013-2014
Revenue Structure of GDC (by Business Segments), 2013
Revenue Structure of GDC (by Regions), 2013
Industry Base of Fantawild
Theme Park Distribution of Fantawild in China
Culture Content Products and Service of Fantawild
Development Plan of Fantawild
Development History of Taomee
Financials of Taomee, 2012-2014
Major Partners of Taomee
Business Structure of Toonmax Media
Operating Business of Toonmax Media
Partners of Toonmax Media
Overview of Creative Power Entertaining
Introduction of Sparkly Key Animation Studio
Main Products of Vasoon Animation
Operating Indicators of KAKU Media Inc.
Business of KAKU Media Inc.
Business of Suzhou KAKU Film Animation Technology Co., Ltd
Major Partners of KAKU Media Inc.
Development Overview of Sunchime Cartoon Group
Development Overview of CCTV Animation Co., Ltd
Animated Works of CCTV Animation
Major Products of Huawei Technology
Revenue and Net Income of Huawei Technology, 2009-2014
Revenue Structure of Huawei Technology (by Products), 2009-2013
Revenue Structure of Huawei Technology (by Regions), 2010-2013
Gross Margin of Huawei Technology (by Products), 2009-2013
Revenue from Top Five Clients and % of Total Revenue of Huawei Technology, 2013
Procurement from Top Five Suppliers and % of Total Procurement of Huawei Technology, 2013
R & D Expense and % of Total Revenue of Huawei Technology, 2009-2013
Diyibo’s Game Products Adapted by Core IP
Revenue and Net Income of Huawei Technology, 2014E-2016E
Development Course of Meisheng Cultural & Creative
Meisheng Cultural & Creative’s Apparel Products
Revenue and Net Income of Meisheng Cultural & Creative, 2010-2014
Revenue Structure of Meisheng Cultural & Creative (by Products), 2009-2013
Revenue Structure of Meisheng Cultural & Creative (by Regions), 2009-2013
Gross Margin of Meisheng Cultural & Creative, 2009-2013
Revenue and Net Income of Meisheng Cultural & Creative, 2014E-2016E
Distribution Channels Contrast of Animation Products
Urban Per Capita Disposable Income of Urban Resident in China, 2005-2013
Urban Residents' Per Capita Consumption Expenditure and Per Capita Expense on Education and Cultural Entertainment Services in China, 2005-2013
Birth Rate in China, 2002-2013
% of Population Aged 0-14 to Total Population in China, 2013
Output Value of China Animation Industry, 2014E-2016E
Global and China Animation Industry Report, 2019-2025
Up to date, the global animation market is still firmly dominated by the United States and Japan, followed by South Korea that springs up. The global animation output value approximates USD250 billion...
Global and China Animation Industry Report, 2017-2021
In 2016, the global animation industry recorded output value of approximately USD220 billion, of which, the United States made the greatest contribution and claimed about 38% market share, with animat...
Global and China Animation Industry Report, 2015
Chinese animation industry has maintained the momentum of robust growth from 2014 on, thanks to the government's supportive policies on animation industry and booming Internet-based new media distribu...
Global and China Animation Industry Report, 2014
China’s animation industry output value continued to grow and exceeded RMB90 billion in 2013, showing a year-on-year increase of around 21.0%. Despite the overall sustained growth, each link of the in...
China Digital Publishing Industry Report, 2013-2014
As an emerging publishing industry, digital publishing is characterized by digitization of content production, management process and product form as well as networked communication channels.With the ...
China TV Drama Industry Report,2013-2016
In recent years, a series of favorable policies issued by the Chinese government in finance, intellectual property protection and culture industries stimulate the rapid expansion of Chinese TV drama m...
China TV Shopping Industry Report, 2013
In 2009, the State Administration of Radio Film and Television (SARFT) released Opinions on TV Shopping Channel Construction and Management and Notice concerning Strengthening Management over TV Shopp...
Global and China Animation Industry Report, 2012-2015
So far, the output value of global animation industry has reached US$222.8 billion, and animation-related derivatives have exceeded US$500 billion. The animation industry has gradually become a pillar...
China Film Industry Report, 2012-2015
From January to October of 2012, China film industry gained the box office of RMB13.27 billion. Taking into account the contribution of the traditional Lunar New Year holiday, China’s film box office ...
China TV Drama Industry Report, 2011-2012
TV drama industry is a policy-sensitive sector in China. From 2006 to 2010, the value of Chinese drama transactions increased from RMB4.85 billion to RMB5.92 billion, with a CAGR of just 5.11%. As the...
China TV Shopping Industry Report, 2011
TV shopping entered China in the early 1990s, and ushered in its first golden era from 1996 to 2000, during which, there emerged more than 1,000 TV shopping companies, with industry revenue already ab...
Global and China Animation Industry Report, 2011
In 2010, the total output value of animation industry in China increased by 27.8% year-on-year to RMB47.084 billion. In 2015, the total output value is expected to reach RMB 120 billion, and the marke...
China Film Industry Report, 2011
In 2010, the consolidated revenue of China film industry approximated RMB16 billion, an increase of 48%. Currently, box office, which was about RMB 5.7 billion in H1 2011, is still the main revenue so...
China Advertising Industry Report, 2010-2011
The sustained economic growth ensures the healthy development of advertising industry in China. The advertising market size of China totaled RMB343.7 billion in 2010, up 22.5% from a year earlier. How...
China Film Industry Report, 2009-2010
Currently, China’s film industry is experiencing a golden period. No matter what film production, box office, financing and cinema construction witness the explosive growth. In 2009, Chinese mainland ...
China Advertising Industry Report, 2009-2010
Chinese traditional media witnessed steady progression in 2009, while online advertising outshined the others, characterizing high degree of brand penetration, high accuracy, huge target audience, etc...
China Listed Media Companies Report, 2008-2009
With the continuous development of economy and society, China has become the largest media consumer market in the world and China's media output has exceeded the media giant -- the United States. But,...
China Mobile Multimedia Broadcasting (CMMB) Industry Chain Report, 2008
CMMB industry chain involved the CMMB chip, CMMB operation, CMMB terminal, etc. By Jan 2009, the quantity of CMMB chip manufacturers in China has amounted to eight, including Innofidei, Telepath, Spre...