Global and China Photovoltaic Inverter Industry Report, 2016-2020
-
July 2016
- Hard Copy
- USD
$2,350
-
- Pages:96
- Single User License
(PDF Unprintable)
- USD
$2,200
-
- Code:
ZHP042
- Enterprise-wide License
(PDF Printable & Editable)
- USD
$3,400
-
- Hard Copy + Single User License
- USD
$2,550
-
As the core device of PV system, PV inverter can convert DC to AC. PV inverters are divided into on-grid inverters and off-grid inverters.
In 2015, the global PV inverter shipment hit 56.0GW, a year-on-year surge of 44.7%, mainly thanks to rapidlygrowing demand in the United States and China. The global PV inverter shipment is expected to be 66.0GW in 2016 and over 90GW in 2020.
China is a major PV inverter market in the world. In 2015, its PV inverter shipment reached 26.5GW, accounting for 47.3% globally and soaring by 99.2% over the previous year. In 2016-2020, China's PV inverter shipment is expected to show a CAGR of about 13.0%.
In recent years, PV inverter prices have shown a ceaselessdownward trend in the wake of the decline in PV power generation prices. In 2015, the average price of centralized inverter in China fell to 0.2 Yuan/W, and the string inverter price 0.5 Yuan/W or so. In the short term, the prices will keep dropping.
The development of PV inverters mainly relies on the construction of PV power plants. In 2015, Chinese PV power plants added 15.16 million kilowatts of installed capacity, of which ground PV power plants accounted for 90.6% and distributed PV power plants 9.4%. Distributed power plants can not only take advantage of the surface of buildings, but also act as effective interfaces between smart grid and micro grid, so they are encouraged by national policies; in 2020, the installed capacity will reach 70GW.
World renownedPV inverter manufacturers include Germany-based SMA, Switzerland-based ABB, Israel-based SolarEage, Japan-based TMEIC, China-based Huawei, Sungrow Power Supply, TBEA, etc. In 2015, Huawei ranked first by PV inverter shipment, while SMA was the champion by sales.
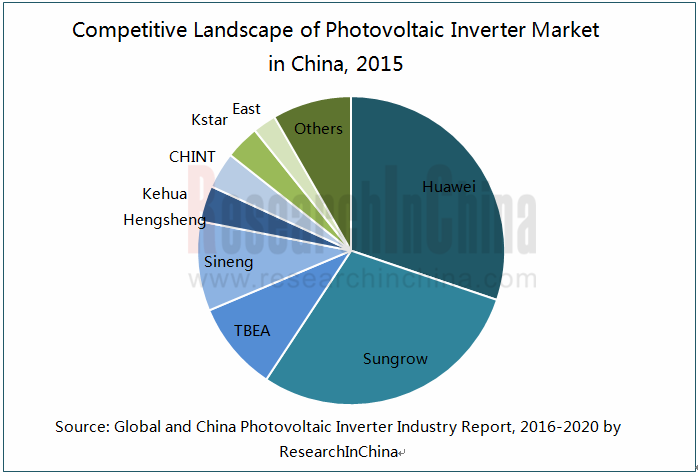
CR5 of the highly concentrated Chinese PV inverter market was up to 81.9% in 2015. Wherein, Huawei ranked first in China with 30.2% market share.
SMA’s PV inverters have a wide power range from 700W to 1,120MW. In 2015, its PV inverter shipment amounted to 7.3GW, representing a 43.7% increase over the same period of last year.
Huawei entered the PV field in 2012 and became the largest PV inverter manufacturer by shipment in China and the world in 2015. In January 2016, the company decided to cooperate with Sino-American Silicon Products Inc. in the field of solar PV inverters.
Sungrow Power Supply Co., Ltd. shipped 8.9GW of PV inverters in 2015, including 7.73GW in China. In May 2016, it launched China's first integrated medium-voltage system -- 3MW SG3000HV-MV box-type medium-voltage inverter in Shanghai.
Shenzhen KSTAR Science and Technology Co., Ltd. decided to set up Anhui Kstar Science and Technology Co., Ltd. in June 2016, and planned to build at least 300MW PV inverter and electric vehicle charging facilities as well.
Global and China Photovoltaic Inverter Industry Report, 2016-2020 by ResearchInChina mainly cover the followings:
 Market size, market structure, supply and demand, market prices and competitive landscape of the global PV inverter industry;
Market environments, market size, supply and demand, market structure, market prices, competitive landscape and development factors of China PV inverter industry;
Market overview, market size and market structure of main PV inverter upstream industries (IGBT, transformer, integrated circuit, resistor, capacitor, etc.) and downstream applications (PV power plants, etc.);
Operation, layout in China, revenue structure and PV inverter business of 12 foreign and 17 Chinese PV inverter companies.
1. Overview of Photovoltaic Inverter
1.1 Introduction
1.2 Classification
1.3 Technological Development
1.3.1 Evolution
1.3.2 Technique Features
1.3.3 Development Trend
1.4 Industry Chain
1.5 Cost Structure
1.6 Business Model
1.7 Industry Barrier
2. Global Photovoltaic Inverter Market
2.1 Status Quo
2.1.1 Market Size
2.1.2 Market Structure
2.1.3 Price
2.2 Supply & Demand
2.2.1 Supply
2.2.2 Demand
2.3 Market Pattern
2.3.1 Manufacturer Pattern
2.3.2 Regional Distribution
2.3.3 Development Characteristics
3. Chinese Photovoltaic Inverter Market
3.1 Marketing Environment
3.1.1 International Environment
3.1.2 Domestic Environment
3.2 Market Status
3.2.1 Market Size
3.2.2 Supply and Demand
3.2.3 Market Price
3.2.4 Market Structure
3.3 Competition Pattern
3.3.1 Local Chinese Enterprises
3.3.2 Foreign Companies
3.4 Influencing Factors
3.4.1 Favorable Factors
3.4.2 Negative Factors
4 Main Upstream Industries
4.1 IGBT
4.1.1 Application in PV Inverter
4.1.2 Market Size
4.1.3 Competition Pattern
4.2 Others
4.2.1 Integrated Circuit
4.2.2 Transformer
4.2.3 Resistor
4.2.4 Capacitor
5 Downstream Industries
5.1 PV
5.1.1 Global
5.1.2 China
5.2 PV Power Plant
5.2.1 Classification
5.2.2 Construction Costs
5.2.3 Industry Planning
5.2.4 Main Enterprises
6. Key Foreign Companies
6.1 SMA
6.1.1 Profile
6.1.2 Operation
6.1.3 PV Inverter Business
6.1.4 Business in China
6.2 ABB
6.2.1 Profile
6.2.2 Operation
6.2.3 PV Inverter Business
6.2.4 Business in China
6.3 SolarEage
6.3.1 Profile
6.3.2 Operation
6.3.3 PV Inverter Business
6.4 TMEIC
6.4.1 Profile
6.4.2 PV Inverter Business
6.4.3 Business in China
6.5 Enphase
6.5.1 Profile
6.5.2 Operation
6.5.3 PV Inverter Business
6.6 AE
6.6.1 Profile
6.6.2 Operation
6.6.3 Business in China
6.7 Danfoss
6.7.1 Profile
6.7.2 Operation
6.8 Omron
6.8.1 Profile
6.8.2 Operation
6.8.2 Business in China
6.9 Others
6.9.1 Schneider
6.9.2 Fronius
6.9.3SolarMax
6.9.4 KACO
7 Key Chinese Enterprises
7.1 Sungrow Power Supply Co., Ltd.
7.1.1 Profile
7.1.2 Operation
7.1.3 PV Inverter Business
7.2 Huawei
7.2.1 Profile
7.2.2 Operation
7.2.3 PV Inverter Business
7.3 Tebian Electric Apparatus Stock Co., Ltd. (TBEA)
7.3.1 Profile
7.3.2 Operation
7.3.3 PV Inverter Business
7.4 Shenzhen KSTAR Science and Technology Co., Ltd.
7.4.1 Profile
7.4.2 Operation
7.4.3 PV Inverter Business
7.5 Xiamen KehuaHengsheng Co., Ltd.
7.5.1 Profile
7.5.2 Operation
7.5.3 PV Inverter Business
7.6 Guangdong East Power Co., Ltd.
7.6.1 Profile
7.6.2 Operation
7.6.3 PV Inverter Business
7.7 Ningbo Ginlong Technologies Co., Ltd.
7.7.1 Profile
7.7.2 Operation
7.7.3 PV Inverter Business
7.8 GoodWe (Jiangsu) Power Supply Technology Co., Ltd.
7.8.1 Profile
7.8.2 Operation
7.8.3 PV Inverter Business
7.9 Shenzhen Clou Electronics Co., Ltd.
7.9.1 Profile
7.9.2 Operation
7.9.3 PV Inverter Business
7.10 Rongxin Power Electronic Co., Ltd.
7.10.1 Profile
7.10.2 Operation
7.10.3 PV Inverter Business
7.11 Others
7.11.1 Sineng Power Co., Ltd.
7.11.2 Shanghai Chint Power Systems
7.11.3 Growatt New Energy Technology Co., Ltd
7.11.4 Samil Power Co., Ltd.
7.11.5 Guanya Power Equipment Co., Ltd
7.11.6 Anhui EHE New Energy Tech. Co., Ltd
7.11.7 Beijing Corona Science & Technology Co., Ltd.
8 Summary and Forecast
8.1 Market
8.2 Enterprises
Functions of Inverter
Principle of PV Off-grid System
Principle of PV Grid-connected System
Evolution of Inverter Technologies
Development Trend of PV Inverter Technologies
Impact of Shield on Generating Electricity
PV Inverter Industry Chain
Main Applications of PV Inverter in China
Cost Structure of String Inverter
Global PV Inverter Sales, 2008-2020E
Global PV Inverter Revenue Structure (by Power), 2012-2018 E
Average Price of PV Inverters Worldwide, 2013-2020E
Global PV Inverter Shipment, 2013-2020E
Global Major PV Inverter Manufacturers
Global PV Inverter Demand, 2013-2020E
Classification of Global PV Inverter Manufacturers
Ranking of Global Top 10 Inverter Enterprises by Shipment and Revenue, 2015
Distribution of Major Global PV Inverter Consumer Countries, 2015
Top 10 Solar Inverter Companies in the United States, 2014
Final Results of USA's Anti-dumping and Countervailing Measures against Chinese Crystalline Silicon Solar Cells
Timetable of EU's Anti-dumping and Countervailing Measures against Chinese PV Products
China’s Major PV Industrial Policies, 2015-2016
China’s PV Inverter Market Size, 2010-2020E
China’s PV Inverter Shipment, 2013-2020E
Classification of Chinese PV Inverter Manufacturers
Average Price of PV Inverters in China, 2012-2020E
China’s PV Inverter Sales Structure (by Product), 2014-2020E
Market Share of PV Inverter Enterprises in China (by Shipment), 2015
Development of Major Global Inverter Enterprises in China
PV Inverter IGBT Brands
IGBT Supporting of PV Inverter Manufacturers
IGBT Applications
Global IGBT Market Size, 2010-2020E
Global IGBT Application Structure, 2011-2018E
Applications of Various Power Components
Major IGBT Manufacturers in China
Global PCB Output Value and Growth Rate, 2011-2020E
PCB Output Value and Growth Rate in Mainland China, 2010-2020E
Distribution of China PCB Industry
Global PCB Market Competition Pattern, 2014
Revenue of China Transformer Industry, 2010-2020E
Global PV Installed Capacity, 2005-2020E
Global New PV Installed Capacity (by Region), 2000-2015
Global Cumulative PV Installed Capacity (by Country), 2010-2015
Proportion of PV System Generating Capacity in Total Electricity Consumption in Major Countries Worldwide, 2015
New PV On-grid Capacity of Major European Countries, 2000-2015
China’s PV Installed Capacity, 2006-2020E
Operating Modes of PV Power Plants
Advantages and Disadvantages of Centralized and Distributed Power Plants
Construction Cost Structure of PV Power Plant
Investment Budget of 1MW Distributed Architecture PV
China’s Solar PV Demand, 2015/2020E
China’s Solar PV Scale Layout (by Region), 2020E
Top 20 PV Power Plant Enterprises in China (Miscellaneous), 2016
Top 20 PV Power Plant Investment Enterprises in China, 2016
Business Structure of SMA
SMA’s Global Layout
SMA’s Revenue and Net Income, 2009-2015
SMA's Revenue Structure (by Business), 2015
SMA's Revenue Structure (by Region), 2015
SMA's PV Inverter Shipment, 2009-2015
ABB's Operation, 2013-2015
ABB's Revenue (by Business), 2013-2015
ABB's Revenue (by Region), 2013-2015
ABB’s Business in China, by 2015
SolarEdge’s Main Economic Indicators, FY2014- FY2016
SolarEdge’s PV Inverters
TMEIC’s Global Footprint
TMEIC’s PV Inverter Shipment, FY2009- FY2015
Enphase’s Revenue and Net Income, 2012-2015
Enphase’s Micro Inverter Shipment, 2013-2015
AE’s Operation, 2013-2015
AE’s Revenue (by Region), 2013-2015
AE’s Sales in China, 2008-2015
Revenue of Danfoss, 2010-2015
Revenue Structure of Danfoss (by Region), 2015
Omron’s Global Business Layout
Omron’s Sales and Net Income, FY2008- FY2015
Omron’s Sales (by Business), FY2014- FY2015
Distribution of Enterprises Invested by Omron in China
PV Inverter Series of Fronius
Sungrow’s Revenue and Net Income, 2010-2016
Sungrow’s Revenue and Gross Margin (by Product), 2014-2015
Sungrow’s PV Inverter Product Categories
Sungrow’s Shipment, 2011-2015
Huawei’s Revenue and Net Income, 2011-2015
Huawei’s Revenue Structure (by Business), 2015
Huawei’s Revenue Structure (by Region), 2015
Huawei’s PV Inverter Business Development Process, 2012-2016
TBEA’s Revenue and Net Income, 2009-2016
TBEA’s Operating Revenue and Gross Margin (by Business), 2015
TBEA’s PV Product Production and Capacity under Construction, 2015
Shenzhen Kstar’s Revenue and Net Income, 2008-2015
Shenzhen Kstar’s Revenue Structure (by Business), 2014-2015
Power, Working Methods and Applications of Shenzhen Kstar’s Main PV Inverter Products
Revenue and Net Income of Shenzhen Kstar’s PV Inverter Subsidiaries, 2015
Shenzhen Kstar’s PV Inverter Output and Sales Volume, 2011-2015
Shenzhen Kstar’s PV Inverter Revenue and Gross Margin, 2011-2015
Revenue and Net Income of Xiamen KehuaHengsheng, 2010-2016
Revenue of Xiamen KehuaHengsheng (by Product), 2014-2015
Revenue and Net Income of Guangdong East Power, 2013-2015
Revenue and Gross Margin of Guangdong East Power (by Product), 2014-2015
PV Inverter Shipment of Guangdong East Power, 2012-2015
Revenue and Net Income of Ginlong Technologies, 2013-2015
Revenue Breakdown and Percentage of Ginlong Technologies (by Product), 2014-2015
Products and Applications of Ginlong Technologies
GoodWe’s Revenue and Net Income, 2013-2015
GoodWe’s Operating Revenue (by Product), 2014-2015
Revenue and Net Income of Shenzhen Clou Electronics, 2008-2015
Revenue of Main Products of Shenzhen Clou Electronics, 2014-2015
Revenue and Net Income of Rongxin Power Electronic, 2008-2015
Revenue of Main Products of Rongxin Power Electronic, 2014-2015
Sineng Power’s Distributed Inverters
Revenue and Net Income of Shanghai Chint Power Systems, 2013-2015
Main PV Inverter Equipment of Shanghai Chint Power Systems
Main PV Inverter Products of Growatt New Energy Technology
Main PV Inverter Products of Samil Power
Main PV Inverter Products of Guanya Power Equipment
Main PV Inverter Products of Anhui EHE New Energy Tech
Main PV Inverter Products of Beijing Corona Science & Technology
Growth Rate of Global and Chinese PV Inverter Markets, 2010-2020E
Prices of Global and Chinese PV Inverter Markets, 2013-2020E
Revenue Growth Rate of Major Global PV Inverter Manufacturers, 2010-2015
Competition Pattern of Chinese PV Inverter Market, 2015
Robot Controllers (Brain & Cerebellum) Research Report, 2025
Robot Controller Research: Brain-Cerebellum Integration Becomes a Trend, and Automotive-Grade Chips Migrate to Robots
ResearchInChina has released the Robot Controllers (Brain & Cerebellum) Resea...
Tactile Sensor Research Report, 2025
ResearchInChina has released the "Tactile Sensor Research Report, 2025", which conducts research, analysis and summary on the basic concepts, technical principles, advantages and disadvantages o...
Embodied AI and Humanoid Robot Market Research 2024-2025: Product Technology Outlook and Supply Chain Analysis
Six Trends in the Development of Embodied AI and Humanoid Robots
In 2025, the global humanoid robot industry is at a critical turning point from technology verification to scenario penetration, and t...
Global and China Smart Meters Industry Report, 2022-2027
Meters are widely used in the national economy and are an important part of metering to promote the development of metering. As a legal measuring tool, meters are mainly used in the supply process of ...
China Smart Agriculture and Autonomous Agricultural Machinery Market Report, 2022
Research on smart agriculture and autonomous agricultural machinery: top-level design, agricultural digitization and automation present a potential marketAmid the pandemic, the conflict between Russia...
Global and China Heat Meters Industry Report, 2022-2027
A heat meter is an instrument used to measure, calculate and display the value of heat released or absorbed by water flowing through a heat exchange system, and is mainly used for measuring the heatin...
Global and China CNC Machine Tool Industry Report, 2022-2027
As typical mechatronics products, CNC machine tools are a combination of mechanical technology and CNC intelligence. The upstream mainly involves castings, sheet metal parts, precision parts, function...
Global and China Hydraulic Industry Report, 2021-2026
Hydraulic components are key parts for mobile machineries including construction machinery, agricultural and forestry machinery, material handling equipment and commercial vehicle. The global construc...
China Motion Controller Industry Report, 2021-2026
The motion control system is the core component of intelligent manufacturing equipment, usually composed of controllers, motors, drivers, and human-computer interaction interfaces. Through the control...
Global and China Industrial Robot Servo Motor Industry Report, 2021-2026
As the actuator of control system, servo motor is one of the three crucial parts to industrial robot and its development is bound up with industrial robots. Given the slow progress of 3C electronics a...
Global and China Industrial Laser Industry Report, 2020-2026
As one of the most advanced manufacturing and processing technologies in the world, laser technology has been widely used in industrial production, communications, information processing, medical beau...
Global and China Mining-use Autonomous Driving Industry Report, 2020-2021
Demand and policies speed up landing of Autonomous Driving in Mining
Traditional mines have problems in recruitment, efficiency, costs, and potential safety hazards, while which can be solved by aut...
Autonomous Agricultural Machinery Research Report, 2020
Autonomous Agricultural Machinery Research: 17,000 sets of autonomous agricultural machinery systems were sold in 2020, a year-on-year increase of 188%
Autonomous agricultural machinery relies heavil...
Global and China CNC Machine Tool Industry Report, 2020-2026
As a typical type of mechatronic products, CNC machine tools combine mechanical technology with CNC intelligence. The upstream mainly involves castings, sheet weldments, precision parts, functional pa...
Global and China Hydraulic Industry Report, 2020-2026
Hydraulic parts, essential to modern equipment manufacturing, are mostly used in mobile machinery, industrial machinery and large-sized equipment. Especially, construction machinery consumes the overw...
Global and China Industrial Robot Speed Reducer Industry Report, 2020-2026
Controller, servo motor and speed reducer, three core components of industrial robot, technologically determine key properties of an industrial robot, such as work accuracy, load, service life, stabil...
Global and China Industrial Robot Servo Motor Industry Report, 2020-2026
As the actuator of control system, servo motor is one of the three crucial parts to industrial robot and its development is bound up with industrial robots. Given the agonizingly slow progress of 3C e...
Global and China Laser Processing Equipment Industry Report, 2020-2026
Laser processing which offers centralized and stable laser beams is applicable to high hardness, high melting point materials that are hard to be processed with traditional technologies. By purpose, l...