Global and China Copper Clad Laminate (CCL) Industry Report, 2016-2020
-
Oct. 2016
- Hard Copy
- USD
$2,500
-
- Pages:111
- Single User License
(PDF Unprintable)
- USD
$2,300
-
- Code:
ZHP047
- Enterprise-wide License
(PDF Printable & Editable)
- USD
$3,600
-
- Hard Copy + Single User License
- USD
$2,700
-
Copper clad laminate (CCL) is made up of copper foil, glass fiber, resin and other materials. As the essential material for fabricating PCB, CCL is chiefly divided into rigid and flexible CCL.
The global CCL output was 750 million square meters in 2015, down 0.9% year on year, mainly due to the decline in growth rate of the downstream market. In 2016, the rising raw material costs bring greater pressure on the development of the downstream sectors, and the market has not yet shown a sign of obvious recovery. For this, the global output is expected to continue to drop a bit by 0.4%.
China, the world's largest CCL production base, produced 520 million square meters in 2015, edging up 0.3% year on year and accounting for 69.6% of the global total. In 2016-2020, China’s CCL output is expected to grow at a compound annual rate of about 1.5% thanks to the slight rebounding of the downstream PCB industry under the impetus of automotive electronics, 4G / 5G communication terminals and other high-growth fields over the next few years.
In 2016, China’s CCL price stops falling to rise by about 2.5% as a result of the more expensive copper foil which is much sought after. It will take 1-2 years to build the copper foil capacity, so the market will still be in short supply in the next two years, thereby promoting the CCL price to go high.
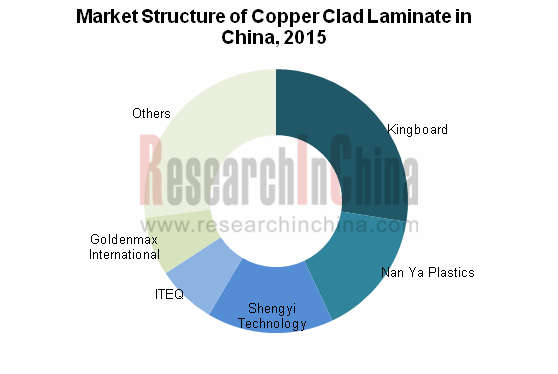
The Chinese CCL market is highly concentrated, with the stable competitive landscape. In 2015, the industry’s CR5 was 73.0%, wherein Kingboard Chemical ranked first with 27.5% market share, followed closely by Nan Ya Plastics Corporation and Shengyi Technology with 15.5% each.
The CCL industry mainly relies on the PCB market whose future development will be propelled by automotive electronics, communications terminals and other emerging high-growth fields in China.
Automotive electronics: As per the cost structure, new energy vehicles see automotive electronics hold a much higher proportion of the total costs than traditional cars (compact cars witness 15%, medium and high-end sedans 28%, hybrid sedans 47%, and battery electric sedans 65%). In recent years, with the support of the national policies, China's new energy vehicle industry has been developing quickly at an average annual growth rate of 50.0%, which can facilitate automotive electronics further.
Communications terminals: The number of Chinese 4G users swelled from 97 million in 2014 to 386 million in 2015, showing explosive growth. The market growth rate in 2016 is expected to exceed that in 2015. 4G (or above) intelligent terminal module hardware needs to be integrated in PCB for the purpose of wireless reception, transmission and other functions. Accordingly, the future upgrading of intelligent terminals will prompt the demand for PCB to grow.
Global and China Copper Clad Laminate Industry Report, 2016-2020 by ResearchInChina focuses on the followings:
 Overview, market size, market structure, competitive landscape, etc. of the global CCL industry;
Policies, development trends, market scale, market structure, market price, competition pattern, import and export , etc. of China CCL industry;
Overview, market size, market structure, competitive landscape, driving factors and the like of the upstream copper foil industry;
Downstream PCB market size, market structure, competitive landscape, market drivers and so on;
Operation, CCL Business, etc. of 5 global and 18 Chinese CCL manufacturers.
1 Overview of CCL Industry
1.1 Types of CCL
1.2 Industry Characteristics
1.3 Industry Chain
2 Global CCL Market
2.1 Industry Overview
2.2 Market Size
2.2.1 Output Value
2.2.2 Output
2.3 Market Structure
2.4 Competitive Landscape
2.4.1 CCL
2.4.2 Rigid CCL
2.4.3 Halogen-free CCL
3 Environments for CCL Industry Development in China
3.1 Industrial Policies
3.2 Influencing Factors
3.2.1 Favorable Factors
3.2.2 Negative Factors
3.3 Entry Barriers
3.4 Development Trends
4 Chinese CCL Market
4.1 Market Size
4.1.1 Capacity
4.1.2 Output and Sales Volume
4.1.3 Revenue
4.2 Market Structure
4.2.1 Rigid CCL
4.2.2 Flexible CCL
4.3 Competitive Landscape
4.4 Market Price
4.5 Import & Export
4.5.1 Import
4.5.2 Export
5 Upstream - Copper Foil Market
5.1 Overview
5.1.1 Classification
5.1.2 Development Course
5.1.3 Cost Proportion
5.2 Global Market
5.2.1 Market Size
5.2.2 Market Structure
5.2.3 Competitive Landscape
5.2.4 Lithium Battery Copper Foil
5.3 Chinese Market
5.3.1 Market Size
5.3.2 Market Structure
5.3.3 Market Price
5.3.4 Lithium Battery Copper Foil
6 Downstream -PCB Market
6.1 Market Size
6.1.1 Global
6.1.2 China
6.2 Market Structure
6.2.1 Global
6.2.2 China
6.3 Competitive Landscape
6.3.1 Global
6.3.2 China
6.4 Impetus
6.4.1 The Trend of Automotive Electronics Drives the Rapid Growth of Automotive PCB
6.4.2 Small High-density Base Stations Stimulate the Demand for High Value-added Sheets and PCB
7 Major Foreign CCL Manufacturers
7.1 Hitachi Chemical
7.1.1 Profile
7.1.2 Operation
7.1.3 Revenue Structure
7.1.4 R & D
7.1.5 CCL Business
7.2 Rogers
7.2.1 Profile
7.2.2 Operation
7.2.3 Revenue Structure
7.2.4 CCL Business
7.3 Others
7.3.1 Isola
7.3.2 Arlon
7.3.3 Panasonic Electric Works
8 Major Chinese CCL Manufacturers
8.1 Kingboard Chemical
8.1.1 Profile
8.1.2 Operation
8.1.3 Revenue Structure
8.1.4 Gross Margin
8.1.5 CCL Business
8.1.6 Competitive Edges
8.2 Shengyi Technology
8.2.1 Profile
8.2.2 Operation
8.2.3 Revenue Structure
8.2.4 Gross Margin
8.2.5 CCL Business
8.2.6 Development Plan
8.3 Goldenmax International Technology
8.3.1 Profile
8.3.2 Operation
8.3.3 Revenue Structure
8.3.4 Gross Margin
8.3.5 CCL Business
8.3.6 Main Projects
8.4 Guangdong ChaoHua Technology
8.4.1 Profile
8.4.2 Operation
8.4.3 Revenue Structure
8.4.4 Gross Margin
8.4.5 CCL Business
8.4.6 Major Dynamics
8.5 ITEQ Corporation
8.5.1 Profile
8.5.2 Operation
8.5.3 Revenue Structure
8.5.4 CCL Business
8.6 Guangdong Goworld
8.6.1 Profile
8.6.2 Operation
8.6.3 Revenue Structure
8.6.4 Gross Margin
8.6.5 CCL Business
8.7 Zhejiang Huazheng New Material
8.7.1 Profile
8.7.2 Operation
8.7.3 Major Customers and Suppliers
8.7.4 CCL Business
8.8 Shanghai Nanya Copper Clad Laminate
8.8.1 Profile
8.8.2 Operation
8.8.3 CCL Business
8.9 Elite Material
8.9.1 Profile
8.9.2 Operation
8.9.3 Revenue Structure
8.9.4 Gross Margin
8.9.5 CCL Business
8.10 Changzhou Zhongying Science & Technology
8.10.1 Profile
8.10.2 CCL Business
8.11 Others
8.11.1 Nan Ya Plastics Corporation
8.11.2 Formosa Laboratories, Inc.
8.11.3 Grace Electron Corp. (Guangzhou)
8.11.4 Shandong Jinbao Electronics Co., Ltd
8.11.5 VENTEC Electronics (Suzhou) Co., Ltd.
8.11.6 Shandong LaiwuJinding Electronic Materials Co., Ltd.
8.11.7 ChangChun Group
8.11.8 Jiangsu Roda Electron Material
Structure of Copper Clad Laminate
Structure and Materials of Main Copper Clad Laminates
Classification of Copper Clad Laminate
Copper Clad Laminate Industry Chain
Output Value and Growth Rate of Global CCL Industry, 2013-2020E
Output Value and Growth Rate of Global Rigid CCL Industry, 2013-2020E
Global CCL Output, 2010-2020E
Global Rigid CCL Output, 2014-2020E
Structure of Global CCL Output Value (by Product), 2013-2020E
Structure of Global CCL Output Value (by Region), 2011-2020E
Competitive Landscape of Global CCL Market, 2015
Competitive Landscape of Global Rigid CCL Market, 2015
Competitive Landscape of Global Halogen-Free CCL Market, 2015
Policies on China CCL Industry, 2008-2016
CCL Capacity in China, 2011-2020E
CCL Output and Sales Volume in China, 2011-2020E
Sales and Growth Rate of China CCL Industry, 2010-2020E
Area Distribution of CCL Manufacturers in China, 2015
Structure of China’s CCL Output (by Product), 2014-2020E
Output of Rigid CCL in China (by Product), 2011-2020E
Sales Volume of Rigid CCL in China (by Product), 2014-2020E
Output and Growth Rate of Flexible CCL in China, 2008-2020E
Capacity Distribution of Flexible CCL in China, 2015
Major Flexible CCL Manufacturers in China
Competitive Landscape of China CCL Market, 2014-2015
Operating Revenue of Chinese CCL Manufacturers (by Product)
China CCL Market Price Trends, 2011-2020E
China (Mainland) Copper Clad Laminate Imports and Exports, 2011-2016
Structure of China (Mainland) CCL Import Volume (by Country/Region), 2013-2015
Structure of China (Mainland) CCL Import Value (by Country/Region), 2013-2015
Structure of China (Mainland) CCL Export Volume (by Country/Region), 2013-2015
Structure of China (Mainland) CCL Export Value (by Country/Region), 2013-2015
Classification and Application of Copper Foil
Comparison between Rolled Copper Foil and Electrolytic Copper Foil
Structure of Thick CCL Costs
Structure of Thin CCL Costs
Global Copper Foil Capacity, 2015-2020E
Global PCB/CCL Copper Foil Capacity, 2015-2020E
Global PCB/CCL Copper Foil Demand, 2015-2020E
Structure of Global Copper Foil Demand (by Product), 2015/2020E
Output of Major Global Copper Foil Producers, 2014-2015
Global Lithium Battery Copper Foil Capacity, 2015-2020E
Global Lithium Battery Copper Foil Demand, 2015-2020E
Output of Copper Foil in China, 2009-2020E
Output of Electrolytic Copper Foil in China, 2014-2020E
Structure of Copper Foil Output in China (by Product), 2012-2016
Price of Electrolytic Copper Foil in China, 2014-2020E
Output of Lithium Battery Copper Foil in China, 2014-2020E
Demand for Lithium Battery Copper Foil in China, 2015-2020E
Capacities and Production Expansion Plans of Major Lithium Battery Copper Foil Manufacturers in China, 2015
Cost of PCB Costs
Output Value and Growth Rate of Global PCB Industry, 2009-2020E
Output Value of PCB Industry in China, 2010-2020E
Structure of Global PCB Output Value (by Region), 2006/2015/2020
Structure of Global PCB Output Value (by Product), 2012-2016
Distribution of China PCB Industry
Major International Producers of PCB Industry
Competitive Landscape of Global PCB Market, 2015
Capacities of Major PCB Vendors in China, 2015
Automotive Electronics as a Percentage in Vehicle Costs, 2015
Total Number of 4G Base Station Constructions in China, 2015-2016
Global Marketing Outlets of Hitachi Chemical
Net Revenue and Net Income of Hitachi Chemical, FY2009-FY2016
Distribution of Hitachi Chemical’s Subsidiaries Worldwide
Revenue Structure of Hitachi Chemical (by Product), FY2013-FY2015
Revenue Breakdown of Hitachi Chemical (by Region), FY2008-FY2015
Major R&D Centers of Hitachi Chemical
R&D Cost Stricture of Hitachi Chemical (by Product), FY2012-FY2014
CCL BusinessRevenue of Hitachi Chemical, 2011-2016
Global CCCL Product Marketing Network of Hitachi Chemical
Marketing Outputs of Hitachi Chemical in China
CCL Subsidiaries of Hitachi Chemical in China
Revenue and Net Income of Rogers, 2009-2016
Revenue Breakdown of Rogers (by Product), 2013-2016
Revenue Structure of Rogers (by Region), 2013-2015
CCL Business Revenue of Rogers, 2011-2016
CCL Business Revenue of Isola, 2011-2016
Global Marketing Network of Isola Group
CCL Business Revenue of Panasonic Electric Works, 2011-2016
CCL BusinessRevenue and Growth Rate of Panasonic Industrial Devices Materials (Suzhou), 2011-2015
Revenue and Net Income of Kingboard Chemical, 2007-2016
Revenue Structure of Kingboard Chemical (by Product), 2012-2015
Revenue Structure of Kingboard Chemical (by Region), 2012-2015
Gross Profit and Gross Margin of Kingboard Chemical, 2008-2016
Categories of Major CCL Products of Kingboard Chemical
CCL Sales Volume of Kingboard Chemical, 2010-2016
CCL Business Revenue and Growth Rate of Kingboard Chemical, 2008-2016
CCL Business Revenue Structure of Kingboard Chemical (by Product), 2012-2016
Major CCL Production Plants/Companies of Kingboard Chemical
Ownership Structure of Shengyi Technology, 2016
Revenue and Net Income of Shengyi Technology, 2009-2016
Revenue Breakdown of Shengyi Technology (by Product), 2012-2016
Revenue Structure of Shengyi Technology (by Region), 2012-2016
Gross Margin of Shengyi Technology (by Product), 2010-2016
Categories of Major CCL Products of Shengyi Technology
CCL Output and Sales Volume of Shengyi Technology, 2009-2016
CCL Business Revenue and Growth Rate of Shengyi Technology, 2009-2016
Structure of CCL Sales Volume of Shengyi Technology (by Product), 2016
Major CCL Production Bases, Output and Sales Volume of Shengyi Technology, 2015
Ownership Structure of Goldenmax International Technology, 2016
Revenue and Net Income of Goldenmax International Technology, 2009-2016
Revenue Structure of Goldenmax International Technology (by Product), 2012-2016
Revenue Structure of Goldenmax International Technology (by Region), 2012-2016
Gross Margin of Goldenmax International Technology (by Product), 2010-2016
CCL Output and Sales Volume of Goldenmax International Technology, 2010-2016
CCL Business Revenue and Growth Rate of Goldenmax International Technology, 2010-2016
Major CCL Production Bases of Goldenmax International Technology, 2015
Ownership Structure of Guangdong ChaoHua Technology, 2016
Revenue and Net Income of Guangdong ChaoHua Technology, 2008-2016
Revenue Structure of Guangdong ChaoHua Technology (by Product), 2012-2016
Revenue Structure of Guangdong ChaoHua Technology (by Region), 2013-2016
Gross Margin of Guangdong ChaoHua Technology (by Product), 2010-2016
CCL Output and Sales Volume of Guangdong ChaoHua Technology, 2011-2015
CCL Business Revenue and Growth Rate of Guangdong ChaoHua Technology, 2008-2016
Global Marketing Outlets of ITEQ Corporation
Revenue and Net Income of ITEQ Corporation, 2010-2016
Revenue Structure of ITEQ Corporation (by Product), 2012-2016
Revenue and Growth Rate of Copper Clad Laminate Business of ITEQ Corporation, 2011-2016
Structure of Copper Clad Laminate Output of ITEQ Corporation, 2015
Ownership Structure of Guangdong Goworld, 2016
Revenue and Net Income of Guangdong Goworld, 2009-2016
Revenue Structure of Guangdong Goworld (by Product), 2012-2016
Revenue Structure of Guangdong Goworld (by Region), 2012-2016
Gross Margin of Guangdong Goworld (by Product), 2011-2016
CCL Output and Sales Volume of Guangdong Goworld, 2011-2015
CCL Business Revenue and Growth Rate of Guangdong Goworld, 2011-2015
Ownership Structure of Zhejiang Huazheng New Material, 2015
Revenue and Net Income of Zhejiang Huazheng New Material, 2011-2015
Major Customers of Zhejiang Huazheng New Material
Major Suppliers of Zhejiang Huazheng New Material
Major CCL Subsidiaries of Zhejiang Huazheng New Material
CCL Output and Sales Volume of Zhejiang Huazheng New Material, 2011-2015
Revenue and Growth Rate of CCL Business of Zhejiang Huazheng New Material, 2011-2015
Revenue and Growth Rate of Shanghai Nanya Copper Clad Laminate, 2003-2015
CCL Business Revenue of Shanghai Nanya Copper Clad Laminate, 2011-2015
Global Marketing Network of Elite Material
Revenue and Net Income of Elite Material, 2010-2016
Revenue Structure of Elite Material (by Product), 2012-2015
Revenue Structure of Elite Material (by Region), 2013-2016
Consolidated Gross Margin of Elite Material, 2010-2016
CCL Production Bases and Capacity Distribution of Elite Material
CCL BusinessRevenue of Elite Material, 2010-2015
Capacities of Main Products of Changzhou Zhongying Science & Technology
CCL Revenue of Nan Ya Plastics Corporation, 2012-2015
CCL Output and Sales Volume of Nan Ya Plastics Corporation, 2013-2014
Major CCL Production Bases of Nan Ya Plastics Corporation
Global Marketing Network of Taiwan Union Technology Corporation
CCL Production Bases of Taiwan Union Technology Corporation
CCL Revenue and Growth Rate of Grace Electron Corp., 2011-2016
CCL Revenue and Growth Rate of Kinpo Electronics Inc., 2011-2015
CCL Revenue and Growth Rate of VENTEC Electronics, 2011-2015
CCL Capacity of ChangChun Group
Main CCL Products of Jiangsu Roda Electron Material
Revenue of CCL Business of Jiangsu Roda Electron Material, 2013-2015
Global and China Photoresist Industry Report, 2021-2026
Since its invention in 1959, photoresist has been the most crucial process material for the semiconductor industry. Photoresist was improved as a key material used in the manufacturing process of prin...
Global and China Needle Coke Industry Report, 2021-2026
Needle coke is an important carbon material, featuring a low thermal expansion coefficient, a low electrical resistivity, and strong thermal shock resistance and oxidation resistance. It is suitable f...
Global and China 3D Glass Industry Report, 2021-2026
3D curved glass is light and thin, transparent and clean, anti-fingerprint, anti-glare, hard and scratch-resistant, and performs well in weather resistance. It is applicable to terminals such as high-...
Global and China Graphene Industry Report, 2020-2026
Graphene, a kind of 2D carbon nanomaterial, features excellent properties such as mechanical property and super electrical conductivity and thermal conductivity. Its downstream application ranges from...
Global and China 3D Glass Industry Report, 2020-2026
Global 3D glass market has been enlarging over the recent years amid demetallization of smartphone back covers and popularity of smart wearables, to approximately $2.86 billion in 2019 and to an estim...
Global and China Photoresist Industry Report, 2020-2026
In 2019, global photoresist market was valued at $8.3 billion, growing at a compound annual rate of 5.1% or so since 2010, and it will outnumber $12.7 billion in 2026 with advances in electronic techn...
Global and China Synthetic Diamond Industry Report, 2020-2026
While its mechanical property is given full play in fields like grinding and cutting, diamond with acoustic, optical, magnetic, thermal and other special properties, as superconducting material, intel...
Global and China Needle Coke Industry Report, 2020-2026
With the merits like small resistivity, excellent resistance to impact and good anti-oxidation property, needle coke has been widely used in ultra-high power graphite electrodes, nuclear reactor decel...
Global and China Optical Fiber Preform Industry Report, 2019-2025
Optical fiber preform, playing an important role in the optical fiber and cable industry chain, seizes about 70% profits of optical fiber. Global demand for optical fiber preform stood at 16.2kt in 20...
China Silicon Carbide Industry Report, 2019-2025
Silicon carbide (SiC) is the most mature and the most widely used among third-generation wide band gap semiconductor materials. Over the past two years, global SiC market capacity, however, hovered ar...
Global and China Photoresist Industry Report, 2019-2025
Photoresist, a sort of material indispensable to PCB, flat panel display, optoelectronic devices, among others, keeps expanding in market size amid the robust demand from downstream sectors. In 2018, ...
Global and China Graphene Industry Report, 2019-2025
Graphene is featured with excellent performance and enjoys a rosy prospect. The global graphene market was worth more than $100 million in 2018, with an anticipated CAGR of virtually 45% between 2019 ...
Global and China 3D Glass Industry Chain Report, 2019-2025
The evolution of AMOLED conduces to the steady development of 3D curved glass market. In 2018, the global 3D glass market expanded 37.7% on an annualized basis and reached $1.9 billion, a figure proje...
China Wood Flooring Industry Report, 2019-2025
With the better standard of living and the people’s desire for an elegant life, wood flooring sees a rising share in the flooring industry of China, up from 33.9% in 2009 to 38.9% in 2018, just behind...
Global and China Photovoltaic Glass Industry Report, 2019-2025
In China, PV installed capacity has ramped up since the issuance of photovoltaic (PV) subsidy policies, reaching 53GW in 2017, or over 50% of global total. However, the domestic PV demand was hit by t...
Global and China ITO Targets Industry Chain Report, 2019-2025
Featured by good electrical conductivity and transparency, ITO targets are widely applied to fields of LCD, flat-panel display, plasma display, touch screen, electronic paper, OLED, solar cell, antist...
Global and China MO Source Industry Report, 2019-2025
MO source is a key raw material for metal-organic chemical vapor deposition (MOCVD) process. Global MO source output ranged at 102.6 tons in 2018, a rise of roughly 4.6% from a year earlier, a figure ...
Global and China Bi-Metal Band Saw Blade Industry Report, 2018-2023
Chinese manufacturing rebounded in the wake of a pick-up in infrastructure construction between 2016 and 2018, so did the bi-metal band saw blade as a key integral of metal processing industry. In 201...