Global and China Lithium Carbonate Industry Report, 2017-2020
-
May 2017
- Hard Copy
- USD
$2,600
-
- Pages:120
- Single User License
(PDF Unprintable)
- USD
$2,400
-
- Code:
LYJ006
- Enterprise-wide License
(PDF Printable & Editable)
- USD
$3,700
-
- Hard Copy + Single User License
- USD
$2,800
-
Global lithium carbonate output was 244.2 kilotons in 2016, and will increase rapidly as new NEV capacity is fully released. Meanwhile, thanks to rapid development of the NEV industry, the demand for power batteries also surges. Global lithium carbonate consumption stood at 226 kilotons in 2016, 27% of which went into the battery industry, in contrast to 41% in China’s lithium carbonate consumption mix.
Domestic output of lithium extracted from salt lake brine is 28 kt/a with production facilities not operating at full capacity, and new capacity will be approximately 65 kt/a. China’s production of lithium extracted from ores is 55.2 kt/a, compared with designed one of 67.5 kt/a. The reason for a high output of lithium extracted from ores is that adequate supply of lithium ores from Talison solves the bottleneck of raw material shortage, enabling the release of most small and medium-sized enterprises’ capacity. It is expected new capacity will be roughly 32 kt/a.
Despite capacity expansions by Chinese lithium carbonate producers in recent years, the enterprises concerned run actual capacity far lower than designed one, exacerbated a slower capacity release, resulting in a short supply of lithium carbonate in the Chinese market. In addition, as domestic enterprises mostly import Australian ores as raw materials, capacity may be limited by rising costs of raw materials in the long run. Lithium carbonate output was 54 kilotons and apparent consumption 87 kilotons in China in 2016, indicating a supply gap of up to 33 kilotons. Domestic demand for lithium carbonate will rise at a rate of 20% over the next couple of years, a pace faster than the global average, approximating 167 kilotons in 2020.

Global and China Lithium Carbonate Industry Report, 2017-2020 highlights the followings:
 Global and China’s lithium carbonate supply and demand, supply gap, the demand for lithium carbonate from downstream sectors, especially new energy vehicles, energy storage, and consumer electronics;
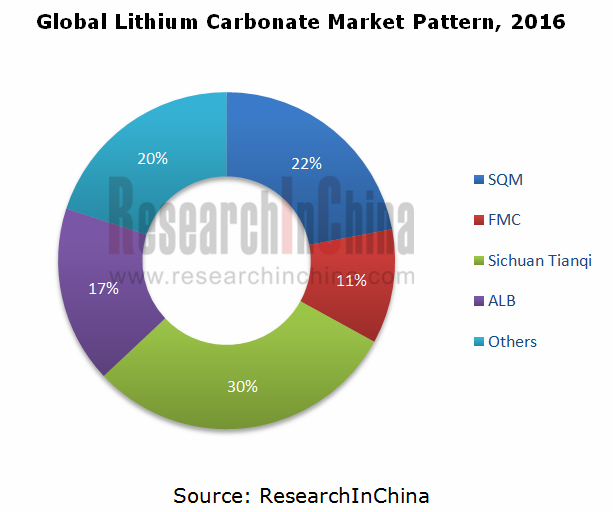
Global and China’s competitive landscape, including market share of foreign and domestic companies, capacity planning, market pattern, etc.;
China’s lithium carbonate imports and exports, covering import/export value, prices, sources, destinations, etc.;
China’s production costs of lithium carbonate with lithium extracted from ores and from salt lake brine, price trends, etc.;
China’s lithium battery industry, including shipments, technology routes, market pattern, etc.;
Operation, technology, development planning, and output & sales of 8 lithium carbonate players in the United States, Chile, Australia, etc.;
Operation, technology, development planning, and output & sales of 14 Chinese lithium carbonate companies.
1 Overview of Lithium Carbonate
1.1 Definition of Lithium
1.1.1 Distribution of Lithium Resources Worldwide
1.1.2 Distribution of Lithium Resources in China
1.2 Application and Product Type
1.3 Industry Chain
1.4 Production Technology
2 Development of Global Lithium Carbonate Industry
2.1 Supply
2.2 Demand
2.2.1 New Energy Vehicle’s Demand for Lithium Carbonate
2.2.2 3C Consumer Electronics’ Demand for Lithium Carbonate
2.2.3 Energy Storage Equipment’s Demand for Lithium Carbonate
2.2.4 Industry’s Demand for Lithium Carbonate
2.3 Competitive Landscape
3 Development of China Lithium Carbonate Industry
3.1 Supply
3.2 Demand
3.2.1 Total Demand
3.2.2 New Energy Vehicle’s Demand for Lithium Carbonate
3.2.3 Industrial Energy Storage’s Demand for Lithium Carbonate
3.3 Status Quo of Industrial Development
3.4 Competitive Landscape
3.5 Technology Trend- High-purity Lithium Carbonate
4 Import & Export of Lithium Carbonate in China
4.1 Overview
4.2 Import
4.2.1 Import Volume
4.2.2 Import Value
4.3 Export
4.3.1 Export Volume
4.3.2 Export Value
5 Production Costs and Prices
5.1 Costs of Lithium Carbonate
5.1.1 Lithium Extracted from Ores
5.1.2 Lithium Extracted from Salt Lake Brine
5.2 Prices and Trend
6 Chinese Lithium Battery Market
6.1 Overview
6.2 Industry Chain
6.3 Output
6.4 Technology Route
6.5 Market Pattern
6.6 Electric Vehicle’s Demand for Lithium Battery
6.6.1 Chinese EV Market
6.6.2 EV Development Trend in China
7 Global Lithium Carbonate Producers
7.1 SQM
7.1.1 Profile
7.1.2 Operation
7.1.3 Capacity
7.1.4 Sales Volume
7.1.5 Development Trend
7.2 Albemarle
7.2.1 Profile
7.2.2 Operation
7.2.3 Lithium Carbonate Business
7.2.4 Development Trend
7.2.5 Competitive Edge
7.3 FMC
7.3.1 Profile
7.3.2 Operation
7.3.3 Lithium Carbonate Business
7.4 Orocobre
7.4.1 Profile
7.4.2 Lithium Carbonate Business
7.5 Galaxy Resources
7.5.1 Profile
7.5.2 Lithium Carbonate Business
7.6 Simbol Materials
7.6.1 Profile
7.6.2 Lithium Carbonate Business
7.7 Sentient
7.7.1 Profile
7.7.2 Lithium Carbonate Business
7.7.3 Enirgi
7.8 Nordic Mining
7.8.1 Profile
7.8.2 Lithium Carbonate Business
8 Chinese Lithium Carbonate Producers
8.1 Tianqi Lithium Corporation
8.1.1 Profile
8.1.2 Operation
8.1.3 Revenue Structure
8.1.4 Cost Analysis
8.1.5 Output and Sales Volume
8.1.6 Resource Acquisition
8.1.7 Core Competence
8.2 Qinghai Salt Lake Industry Co., Ltd.
8.2.1 Profile
8.2.2 Operation
8.2.3 Revenue Structure
8.2.4 Lithium Carbonate Business
8.2.5 Core Competence
8.3 Youngy Co., Ltd.
8.3.1 Profile
8.3.2 Operation
8.3.3 Revenue Structure
8.3.4 Cost Analysis
8.3.5 Lithium Carbonate Business
8.3.6 Core Competence
8.4 Tibet Mineral Development Co., Ltd.
8.4.1 Profile
8.4.2 Operation
8.4.3 Revenue Structure
8.4.4 Lithium Carbonate Business
8.4.5 Core Competence
8.5 Sichuan Western Resources Holding Co., Ltd.
8.5.1 Profile
8.5.2 Operation
8.5.3 Revenue Structure
8.5.4 Lithium Carbonate Business
8.5.5 Core Competence
8.6 Jiangxi Ganfeng Lithium Co., Ltd.
8.6.1 Profile
8.6.2 Industry Chain
8.6.3 Operation
8.6.4 Revenue Structure
8.6.5 Lithium Carbonate Business
8.6.6 Production Capacity
8.6.7 Core Competence
8.7 Western Mining Co., Ltd.
8.7.1 Profile
8.7.2 Operation
8.7.3 Lithium Carbonate Business
8.8 Tibet Urban Development and Investment Co., Ltd.
8.8.1 Profile
8.8.2 Operation
8.8.3 Lithium Carbonate Business
8.9 Jiangxi Special Electric Motor Co., Ltd.
8.9.1 Profile
8.9.2 Operation
8.9.3 Lithium Carbonate Business
8.10 Xinjiang Lithium Salt Plant
8.11 Sichuan Ni & Co Guorun New Materials Co., Ltd.
8.12 Sichuan Jixiang Lithium Technology Co., Ltd.
8.13 ABA Guangsheng Lithium Co., Ltd.
8.14 Shanghai China Lithium Industrial Co., Ltd.
Output of Lithium Ore by Country, 2015-2016
Distribution of Lithium Resource Reserves Worldwide
Distribution of Main Lithium Ore Resources Worldwide
Distribution and Composition of Salt Lake Lithium Resources Worldwide
Global Lithium Resource Reserves, 2004-2016
Distribution of Lithium Resources and Producers in China
Status Quo of Lithium Resource Development in China (by Producer/Location of Resource)
Lithium Carbonate Application Structure, 2020E
Schematic Diagram of Product Chain in Lithium Carbonate Industry
Features of Mainstream Lithium Carbonate Production Technologies
Lithium Extraction Technologies of Chinese Lithium Carbonate Producers
Global Supply of Lithium Carbonate, 2012-2020E
Global Supply of Lithium Carbonate (by Salt Lake Lithium and Lithium Ore), 2012-2020E
Capacity Planning of Major Lithium Carbonate Producers Worldwide, 2011-2017
Demand for Lithium Carbonate from Main Downstream End Products
Global Demand for Lithium Carbonate, 2012-2020E
Downstream Consumption Structure of Lithium Carbonate Worldwide, 2013
Downstream Consumption Structure of Lithium Carbonate Worldwide, 2016
World’s Mainstream EV Makers’ Selection of Cathode Materials
Global Electric Passenger Car (EV&PHEV) Sales Volume, 2011-2020E
Global EV’s Demand for Lithium Power Battery (by Type), 2011-2020E
Global New Energy Vehicle’s Demand for Lithium Carbonate, 2017-2020E
Use of Lithium Battery by 3C Consumer Electronics
Structure of 3C Consumer Electronics’ Demand for Lithium Battery Used Lithium Carbonate Worldwide, 2016
Global Consumer Electronics’ Demand for Lithium Battery and YoY Growth, 2013-2020E
Global Mobile Phone Sales Volume and Demand for Lithium Battery, 2012-2020E
Global Tablet PC Sales Volume and Demand for Lithium Battery, 2012-2020E
Competitive Landscape of Global Tablet PC Market, 2013-2016
Global Notebook Computer Sales Volume and Demand for Lithium Battery, 2012-2020E
Global 3C Consumer Electronics’ Demand for Lithium Carbonate, 2016-2020E
Global Energy Storage Equipment’s Demand for Lithium Carbonate, 2016-2020E
Global Consumption Structure of Lithium Carbonate for Industrial Use, 2016
Global Demand for Lithium Carbonate for Industrial Use, 2017-2020E
Distribution of Lithium Carbonate Capacities Worldwide
Global Lithium Carbonate Market Pattern, 2016
China’s Lithium Carbonate Output as a Percentage of Global Total, 2012-2020E
Output of Basic Lithium Salts in China, 2015-2016
EV’s Demand for Lithium Carbonate in China, 2011-2016
Demand for Energy Storage Lithium Battery in China, 2017/2020E
Structure of Demand for Energy Storage Lithium Battery (by Field) in China, 2020E
Market Share of Major Lithium Carbonate Companies in China, 2016
Production Planning and Technologies of Major Lithium Carbonate Producers in China
High-purity Lithium Carbonate Capacity of Some Companies in China
Main Spodumene Mines Worldwide
Main Lithium-containing Salt Lakes Worldwide
Lithium Carbonate Production Costs of Major Companies Worldwide
Lithium Ores and Purity of Brine-extracted Products
Prices of Industry-grade and Battery-grade Lithium Carbonate in China, 2013-2017
Structure of Global Demand for Lithium Battery, 2012-2020E
Cost Structure of Li-ion Battery
Li-ion Battery Industry Chain
Suppliers of Lithium Battery Upstream Materials in China
Suppliers of Lithium Battery Materials in China
Lithium Battery Downstream Companies in China
Output of Lithium Battery in China, 2008-2016
Comparison among Different Lithium Battery Production Technologies
Technology Roadmaps of Major Chinese Lithium Battery Manufacturers
Lithium Power Battery Supply System in China
Lithium Power Battery Application Structure (by Market) in China, 2016
Market Share of Main Battery Manufacturers, 2016
Shipments of Main Battery Manufacturers, 2016 (MWh)
Electric Passenger Car (EV&PHEV) Sales Volume in China, 2011-2020E
China’s Electric Passenger Car Sales Volume as a Percentage of Global Total, 2011-2020E
Output of Lithium Power Battery (by Application) in China, 2011-2020E
Lithium Carbonate Production Flow of SQM
Operating Income of SQM, 2011-2016
Net Income of SQM, 2011-2016
SQM’s Revenue from and Gross Margin of Lithium and Derivatives, 2009-2016
SQM’s Revenue Breakdown by Lithium and Derivatives, 2009-2016
Lithium Carbonate Capacity of SQM, 2010-2020E
SQM’s Sales Volume of Lithium and Derivatives, 2006-2016
SQM’s Lithium Carbonate Sales Structure by Region Worldwide, 2012-2016
Lithium Resource Reserves of Albemarle
Distribution of Albemarle’s Lithium Salt Processing Companies Worldwide
Operating Income of Albemarle, 2011-2016
Net Income of Albemarle, 2011-2016
Main Lithium Products of Albemarle
Lithium Carbonate Capacity of Albemarle, 2017-2020E
Albemarle’s Commissioning of 20kt/a Battery-grade Lithium Carbonate Plant in La Negra, Chile
Albemarle’s New Addition of 50kt/a Spodumene and Battery-grade Lithium Salts Capacity in 2020
FMC’s Hombre Muerto Salt Lake Processing Technology
Operating Income of FMC, 2012-2016
FMC’s Revenue Breakdown by Segment, 2016 (USD mln)
FMC’s Revenue Structure by Region, 2016
FMC’s Revenue from Lithium Products, 2006-2016
Lithium Carbonate Downstream Fields in Which FMC Set Foot
FMC’s Prediction of Global Demand for Lithium Carbonate, 2016-2020E
Lithium Carbonate Capacity of FMC, 2014-2020E
Olaroz Salt Lake Technological Transformation and Optimization Technology Roadmap
Lithium Carbonate Capacity of Orocobre, 2017-2020E
Distribution of Nordic Mining’s Resources
Organization Chart of Tianqi Lithium
Main Products and Their Applications of Tianqi Lithium
Total Revenue and Net Income of Tianqi Lithium, 2010-2017
Gross Margin of Lithium Salts of Tianqi Lithium, 2010-2016
Revenue Structure of Tianqi Lithium by Region, 2010-2016
Product Cost Structure of Tianqi Lithium, 2015-2016
Revenue and Net Income of Qinghai Salt Lake Industry, 2010-2017
Revenue Structure of Qinghai Salt Lake Industry by Product, 2015-2016
Transformation Process of Youngy Co., Ltd
Organization Chart of Youngy Co., Ltd, 2016
Revenue and Net Income of Youngy Co., Ltd, 2010-2017
Revenue Structure of Youngy Co., Ltd by Region, 2016
Cost Structure of Lithium Concentrate Products of Youngy Co., Ltd, 2015-2016
Lithium Ore Output, Sales Volume and Inventory of Youngy Co., Ltd, 2012-2016
Mineral Resource Reserves of Youngy Co., Ltd
Product R&D Scheme of Dongguan Tec-Rich Engineering, 2014-2018
Revenue and Net Income of Tibet Mineral Development, 2010-2017
Revenue Structure of Tibet Mineral Development by Product, 2016
Main Operating Indices of Lithium Carbonate Exploitation and Production Companies of Tibet Mineral Development, 2015-2016
Key Subsidiaries of Sichuan Western Resources Holding in New Energy Industry Chain
Revenue and Net Income of Sichuan Western Resources Holding, 2010-2017
Revenue Structure of Sichuan Western Resources Holding by Sector, 2016
Output and Sales Volume of Sichuan Western Resources Holding, 2016
Footprint of Jiangxi Ganfeng Lithium in Emerging Fields
Revenue and Net Income of Jiangxi Ganfeng Lithium, 2009-2017
Revenue and Gross Margin of Jiangxi Ganfeng Lithium by Product/Region, 2016
Product Production Flow of Jiangxi Ganfeng Lithium
Output and Sales Volume of Jiangxi Ganfeng Lithium by Product, 2016
Distribution of Lithium Resources of Jiangxi Ganfeng Lithium
Revenue and Net Income of Western Mining, 2010-2017
Revenue and Net Income of Tibet Urban Development and Investment, 2010-2017
Product Capacity Planning of Tibet Urban Development and Investment, 2013-2018
Revenue and Net Income of Jiangxi Special Electric Motor, 2009-2017
Capacities of Main Products of Xinjiang Lithium Salt Plant
Capacities of Main Products of Sichuan Ni & Co Guorun New Materials
Capacities of Main Products of Sichuan Jixiang Lithium Technology
Capacities of Main Products of ABA Guangsheng Lithium
Capacities of Main Products of Shanghai China Lithium Industrial
Global and China Synthetic Rubber Industry Report, 2021-2027
Synthetic rubber is a polymer product made of coal, petroleum and natural gas as main raw materials and polymerized with dienes and olefins as monomers, which is typically divided into general synthet...
Global and China Carbon Fiber Industry Report, 2021-2026
Carbon fiber is a kind of inorganic high performance fiber (with carbon content higher than 90%) converted from organic fiber through heat treatment. As a new material with good mechanical properties,...
Global and China Dissolving Pulp Industry Report, 2019-2025
In 2018, global dissolving pulp capacity outstripped 10 million tons and its output surged by 14.0% from a year ago to 7.07 million tons, roughly 70% of the capacity. China, as a key supplier of disso...
Global and China 1, 4-butanediol (BDO) Industry Report, 2019-2025
1,4-butanediol (BDO), an essential organic and fine chemical material, finds wide application in pharmaceuticals, chemicals, textile and household chemicals.
As of the end of 2018, the global BDO cap...
Global and China Carbon Fiber and CFRP Industry Report, 2019-2025
Among the world’s three major high performance fibers, carbon fiber features the highest strength and the highest specific modulus. It is widely used in such fields as aerospace, sports and leisure.
...
Global and China Natural Rubber Industry Report, 2019-2025
In 2018, global natural rubber industry continued remained at low ebb, as a result of economic fundamentals. Global natural rubber price presented a choppy downtrend and repeatedly hit a record low in...
Global and China Ultra High Molecular Weight Polyethylene (UHMWPE) Industry Report, 2019-2025
Ultra high molecular weight polyethylene (UHMWPE), a kind of linear polyethylene with relative molecular weight of above 1.5 million used as an engineering thermoplastic with excellent comprehensive p...
China Polyether Monomer Industry Report, 2019-2025
China has seen real estate boom and issued a raft of policies for continuous efforts in improving weak links in infrastructure sector over the years. Financial funds of RMB1,663.2 billion should be al...
Global and China Viscose Fiber Industry Report, 2019-2025
Over the recent years, the developed countries like the United States, Japan and EU members have withdrawn from the viscose fiber industry due to environmental factor and so forth, while the viscose f...
Global and China Synthetic Rubber (BR, SBR, EPR, IIR, NBR, Butadiene, Styrene, Rubber Additive) Industry Report, 2018-2023
In 2018, China boasted a total synthetic rubber capacity of roughly 6,667kt/a, including 130kt/a new effective capacity. Considering capacity adjustment, China’s capacity of seven synthetic rubbers (B...
Global and China Dissolving Pulp Industry Report, 2018-2022
With the commissioning of new dissolving pulp projects, the global dissolving pulp capacity had been up to about 8,000 kt by the end of 2017. It is worth noticing that the top six producers including ...
Global and China Carbon Fiber and CFRP Industry Report, 2018-2022
As a new generation of reinforced fiber boasting intrinsic properties of carbon material and excellent processability of textile fiber, carbon fiber is the one with the highest specific strength and s...
Global and China Ultra High Molecular Weight Polyethylene (UHMWPE) Industry Report, 2017-2021
Ultra High Molecular Weight Polyethylene (UHMWPE), a kind of linear polyethylene with relative molecular weight of above 1.5 million and an engineering thermoplastic with excellent comprehensive prope...
Global and China Aramid Fiber Industry Report, 2017-2021
Global aramid fiber output totaled 115kt with capacity utilization of 76.0% in 2016. As industries like environmental protection and military develop, the output is expected to rise to 138kt and capac...
Global and China Natural Rubber Industry Report, 2017-2021
In 2016, the global natural rubber output edged up 1.1% year on year to 12.4 million tons, and the consumption rose by 3.8% year on year to 12.6 million tons, indicating the gap of 200,000 tons betwee...
China Synthetic Rubber Industry Report, 2017-2021
Synthetic rubber is one of important strategic materials, mainly used in tyres and other industries. In 2016, the global output and consumption of synthetic rubber reached 14.822 million tons and 14.9...
Global and China 1,4-butanediol (BDO) Industry Report, 2017-2021
1,4-butanediol (BDO) is a key raw material for organic and fine chemicals, capable of generating various derivatives like THF, PTMEG and GBL. BDO and its derivatives find wide application in PBT plast...
Global and China Ethylene Oxide (EO) Industry Report, 2017-2021
Ethylene oxide (EO) is one of the major derivatives of the ethylene industry. Featured with special reactivity, it can generate a series of fine chemical products for a wide range of applications.
In...