Global and China Activated Carbon Industry Report, 2017-2021
-
Jun.2017
- Hard Copy
- USD
$2,600
-
- Pages:125
- Single User License
(PDF Unprintable)
- USD
$2,400
-
- Code:
ZHP060
- Enterprise-wide License
(PDF Printable & Editable)
- USD
$3,700
-
- Hard Copy + Single User License
- USD
$2,800
-
Global demand for activated carbon was about 1.65 million tons in 2016, up 6.7% from a year ago, and recorded a CAGR of 6.3% during 2012-2016. As the public become increasingly aware of the harm caused by air and water pollution to health, the demand for activated carbon all over the world will continue to increase, approaching an estimated 2.10 million tons in 2021.
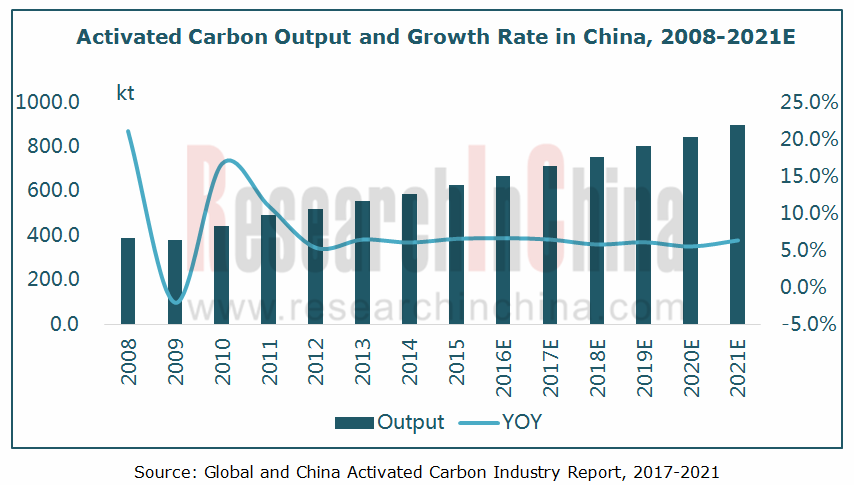
China, the world’s second largest consumer of activated carbon just behind the United States, needed about 440,000 tons in 2016, accounting for 26.7% of the global total. Still in the stage of rapid development, the country will witness a continued increase in the application of activated carbon in industry, food & beverage, and sewage treatment with the demand for activated carbon nearing an estimated 600,000 tons in 2021. Meanwhile, the country is also a big activated carbon producer (about 670,000 tons in 2016 and close to 900,000 tons as predicted in 2021).
Activated carbon, according to the material, can be divided into wood-based, coal-based, coconut shell-based, and nutshell-based ones. China produced about 430,000 tons of coal-based activated carbon and over 200,000 tons of wood-based activated carbon in 2016. Due to environmental protection and supply-side reform in the coal industry, the output of coal-based activated carbon will decline, while that of wood-based and coconut shell-based activated carbons will rise steadily.
Price: coconut shell-based activated carbon commands the highest price, above RMB10,000/t, compared with around RMB7,000/t for nutshell-based activated carbon and RMB5,000/t for coal-based activated carbon). The price of coconut shell-based activated carbon has begun falling since Jul 2016 because of enhanced supply capacity of coconut shell activated carbon enterprises and fiercer market competition.
Competitive landscape: among a large number of activated carbon producers in China, only a few have annual capacity of more than 10,000 tons. In 2016, Fujian Yuanli Active Carbon was the champion in the wood-based activated carbon field with a market share of over 20%, while Datong Coal Jinding Activated Carbon took the lead in the coal-based activated carbon field with a market share of over 15%.
The Chinese activated carbon market will feature the following:
I. Good prospects for activated carbon regeneration market, largely because: 1) mishandling of ineffective waste carbon will cause secondary pollution; 2) the costs of incineration and buying new carbon are far higher than that of activated carbon regeneration; 3) regenerated activated carbon produces only one-fifth of the carbon dioxide that the new activated carbon produces.
2. Market demand for coconut shell-based activated carbon continues to grow. Ever-growing environmental pollution increase the application of activated carbon in air and water purification fields. However, due to insufficient resources and stringent environmental protection, the demand for coal-based activated carbon trends down and thus provides certain space for growth in coconut shell-based activated carbon.
3. The application of activated carbon in environmental protection field will expand, typically, recovery of organic solvents, desulfurization & denitrification, adsorption & concentration and catalytic combustion of organic vapors, sewage treatment, deep purification, etc.
Global and China Activated Carbon Industry Report, 2017-2021 underlines the followings:
 Activated carbon industry (definition, classification, sales model, industry chain, etc.);
Global activated carbon industry (overview, market size/structure, market size in major countries, etc.);
China’s activated carbon industry (overview, development environment, market status, market structure, imports/exports, competitive landscape, development trends, etc.);
Main upstream sectors (wood cutting/processing, chemical activator, coal, etc.);
Main applications (water treatment, food & beverage, pharmaceuticals, automobile, chemical/metallurgy, etc.) (market size, product application, etc.);
Six foreign and nineteen Chinese activated carbon enterprises (operation, activated carbon business, etc.).
1 Overview of Activated Carbon Industry
1.1 Definition
1.2 Classification
1.3 Application and Sales Model
1.4 Industry Chain
2 Global Activated Carbon Industry
2.1 Overview
2.2 Market Size
2.3 Market Structure
2.4 Major Countries/Regions
2.4.1 USA
2.4.2 Japan
2.4.3 Russia
2.4.4 Western Europe
2.4.5 Asia
3 Activated Carbon Industry in China
3.1 Overview
3.2 Development Environment
3.2.1 Regulatory System
3.2.2 Industry Policy
3.2.3 Trade Policy
3.3 Market Size
3.3.1 Output/Sales
3.3.2 Patent
3.3.3 Price
3.4 Market Structure
3.5 Imports/Exports
3.5.1 Imports
3.5.2 Exports
3.6 Competitive Landscape
3.6.1 Regional
3.6.2 Enterprise
3.7 Development Trends
3.7.1 Demand for Wood-based Activated Carbon Ascends
3.7.2 Product Quality Gets Improved
3.7.3 The Activated Carbon Regeneration Market Enjoys Bright Prospects
3.7.4 The Market Demand for Coconut Shell-based Activated Carbon and Nut Shell-based Activated Carbon Keeps Growing
3.7.5 Activated Carbon Finds the Growing Application in the Environmental Protection Field
4 Main Upstream Sectors of Activated Carbon
4.1 Wood Cutting & Processing Industry
4.1.1 Output Value
4.1.2 Output
4.2 Chemical Activators (Phosphoric Acid, Zinc Chloride, etc.)
4.3 Coal Industry
4.3.1 Market Size
4.3.2 Structure
4.3.3 Price
4.3.4 Import & Export
5 Main Applications of Activated Carbon
5.1 Water Treatment Sector
5.1.1 Application of Activated Carbon in Water Treatment
5.1.2 Status Quo of Water Treatment Sector
5.2 Food & Beverage Sector
5.2.1 Application of Activated Carbon in Food & Beverage
5.2.2 Status Quo of Food & Beverage Sector
5.3 Pharmaceuticals Sector
5.3.1 Application of Activated Carbon in Pharmaceuticals
5.3.2 Status Quo of Pharmaceuticals Sector
5.4 Automobile Sector
5.4.1 Application of Activated Carbon in Automobile
5.4.2 Status Quo of Automobile Sector
5.5 Chemical and Metallurgy Sectors
6. Leading Activated Carbon Companies Worldwide
6.1 Calgon
6.1.1 Profile
6.1.2 Operation
6.1.3 Revenue Structure
6.1.4 Gross Margin
6.1.5 R & D and Investment
6.1.6 Development in China
6.1.7 Activated Carbon Business
6.2 Cabot
6.2.1 Profile
6.2.2 Operation
6.2.3 Revenue Structure
6.2.4 Gross Margin
6.2.5 Activated Carbon Business
6.3 WestRock
6.3.1 Profile
6.3.2 Operation
6.3.3 Revenue Structure
6.3.4 Gross Margin
6.3.5 Activated Carbon Business
6.4 Kuraray
6.4.1 Profile
6.4.2 Development in China
6.5 Osaka Gas Chemicals Group
6.5.1 Profile
6.5.2 Osaka Gas Chemicals (OGC)
6.5.3 Japan EnviroChemicals (JEC)
6.6 CECA
7. Leading Wooden Activated Carbon Enterprises in China
7.1 Fujian Yuanli Active Carbon
7.1.1 Profile
7.1.2 Operation
7.1.3 Revenue Structure
7.1.4 Gross Margin
7.1.5 R & D and Investment
7.1.6 Customers and Suppliers
7.1.7 Production and Sales
7.1.8 Activated Carbon Business
7.2 Fujian Xinsen Carbon
7.2.1 Profile
7.2.2 Operation
7.2.3 Development
7.3 Fujian Zhixing Activated Carbon
7.3.1 Profile
7.3.2 Operation
7.3.3 R & D
7.3.4 Major Customers
7.3.5 Development
7.4 Jiangsu Zhuxi Activated Carbon
7.4.1 Profile
7.4.2 Activated Carbon Business
7.5 Shanghai Xingchang Activated Carbon
7.5.1 Profile
7.5.2 Activated Carbon Business
7.6 Jiangsu Purestar EP Technology
7.6.1 Profile
7.6.2 Operation
7.6.3 Major Customers and Suppliers
7.7 Others
7.7.1 Chifeng Zhonglin Zhongtian Chemical Industry
7.7.2 Golden Lake Carbon
7.7.3 Datong Locomotive Coal
7.7.4 QuzhouYunhe Carbon
7.7.5 Hangzhou Hengxing Activated Carbon
7.7.6 Guizhou Qianmin Activated Carbon
8 Major Coaly Activated Carbon Enterprises in China
8.1 Ningxia Huahui Activated Carbon
8.1.1 Profile
8.1.2 Operation
8.1.3 Activated Carbon Business
8.2 Datong Municipal Yunguang Activated Carbon
8.2.1 Profile
8.2.2 Activated Carbon Business
8.3 Shanxi Xinhua Chemical
8.3.1 Profile
8.3.2 Shanxi Xinhua Activated Carbon
8.3.3 Ningxia Guanghua-Cherishmet Activated Carbon
8.4 Inner Mongolia Taixi Coal Group
8.4.1 Profile
8.4.2 Operation
8.4.3 Activated Carbon Business
8.5 Datong Coal Jinding Activated Carbon
8.5.1 Profile
8.5.2 Activated Carbon Business
8.6 Others
8.6.1 Shanxi Huaqing Activated Carbon Group
8.6.2 Huairen Huanyu Purification Materials
Classification and Brief Introduction of Activated Carbon
Difference between Wood-based Activated Carbon and Coal-based Activated Carbon
Application and Sales Model of Activated Carbon
Activated Carbon Industry Chain
History of Global Activated Carbon Development
Global Demand for Activated Carbon and YoY Growth, 2008-2021E
Global Activated Carbon Market Size, 2012-2021E
Global Activated Carbon Demand Structure, 2016
Global Activated Carbon Demand Structure by Terminal Application, 2016/2021E
Global Activated Carbon Application Structure, 2016
Global Activated Carbon Demand Structure (by Product), 2016
Activated Carbon Demand in United States, 2014-2021E
Activated Carbon Demand Structure in United States by Application, 2016
Activated Carbon Demand in Japan, 2005-2021E
Activated Carbon Demand Structure in Japan by Application, 2016
Activated Carbon Output in Russia, 2012-2021E
Activated Carbon Demand Structure in Western Europe by Application, 2016
Distribution of Main Activated Carbon Production Areas in China
Requirements on Quality of Activated Carbon in Some Current National Standards in China
Policies on Activated Carbon Industry in China, 2003-2017
Revised Results of United States on Anti-dumping of China’s Activated Carbon, 2017
Activated Carbon Output and YoY Growth in China, 2008-2021E
Apparent Consumption of Activated Carbon in China, 2010-2021E
Number of Patent Filings for Activated Carbon in China, 2004-2017
Price Trend of Main Activated Carbons in China, 2017
Price Trend of Coconut Shell-based Activated Carbon in China, 2015-2017
Activated Carbon Output Structure in China, 2016/2021E
Activated Carbon Application Structure in China, 2016/2021E
Import Volume and Value of Wood-based Activated Carbon in China, 2010-2017
Top 10 Origins (Countries/Regions) of Wood-based Activated Carbon Imports in China, 2016
Import Volume and Value of Other Activated Carbons in China, 2010-2017
Top 10 Origins (Countries/Regions) of Other Activated Carbon Imports in China, 2016
Export Volume and Value of Wood-based Activated Carbon in China, 2010-2017
Top 10 Destinations (Countries/Regions) of Exports of Wood-based Activated Carbon from China, 2016
Export Volume and Value of Other Activated Carbons in China, 2010-2017
Top 10 Destinations (Countries/Regions) of Exports of Other Activated Carbons from China, 2016
Capacity Structure of Wood-based Activated Carbon in China (by Region), 2016
Capacity Structure of Wood-based Activated Carbon in China (by Enterprise), 2016
Capacity Structure of Coal-based Activated Carbon in China (by Enterprise), 2016
Total Output Value of Forestry and YoY Growth in China, 2008-2021E
Timber Output and YoY Growth in China, 2008-2021E
Log Output and YoY Growth in China, 2008-2021E
Import Volume and Value of Log in China, 2008-2017
Price Trend of Phosphoric Acid (85% Industrial Grade) in China, 2015-2017
Distribution of Anthracite Reserves in China
Anthracite Output and YoY Growth in China, 2009-2017
Apparent Consumption of Anthracite in China, 2009-2017
Anthracite Output Structure in China (by Region), 2015
Price Trend of Thermal Coal in China, 2010-2016
Price Trend of Anthracite in China, 2010-2016
YoY Growth in Average Price of Anthracite in China, 2016-2017
Import Volume of Anthracite in China, 2009-2016
Export Volume of Anthracite in China, 2009-2016
History of Activated Carbon Application in China
Standards for Activated Carbon for Water Treatment in China
Activated Carbon Consumption in Water Treatment Industry in China, 2014-2021E
Water Consumption Per Capita and YoY Growth in China, 2008-2017
Bottled/Canned Drinking Water Output and YoY Growth in China, 2008-2017
Discharge Volume of Sanitary Sewage and Industrial Wastewater, 2008-2017
Activated Carbon Consumption in Food and Beverage Industry in China, 2014-2021E
Demand for Activated Carbon from Fermentation Industry in China (by Product), 2010-2021E
Starch Sugar Output and YoY Growth in China, 2008-2017
Sugar Output and YoY Growth in China, 2008-2017
Carbonated Beverage Output and YoY Growth in China, 2008-2017
Activated Carbon Application in Pharmaceuticals
Activated Carbon Consumption in Pharmaceutical Industry in China, 2014-2021E
CAGR of Pharmaceutical Industry in Major Countries, 2011-2015
Output Value and YoY Growth of Pharmaceutical Industry in China, 2014-2021E
Activated Carbon Consumption in Automotive Industry in China, 2015-2021E
Global Passenger Car Sales, 2005-2017
Global Commercial Vehicle Sales, 2005-2017
Automobile Sales of Major Countries, 2016
Changes in China’s Automobile Sales, 2014-2016
Sales Structure of Passenger Cars in China (by Country), 2014-2016
Competitive Pattern of Automobile Market in China, 2015-2016
Calgon's Revenue and Net Income, 2010-2016
Calgon's Revenue (by Division), 2010-2016
Calgon's Revenue (by Region), 2010-2016
Calgon's Gross Margin, 2011-2016
Calgon's R&D Costs and% of Total Revenue, 2010-2016
Calgon's Capital Expenditure and YoY Growth, 2010-2016
Calgon's Revenue in China, YoY Growth and % of Total Revenue, 2010-2016
Main Products of Calgon
Global Presence of Calgon
Revenue and Net Income of Cabot, FY2010-FY2017
Revenue of Cabot (by Segment), FY2015-FY2017
Revenue of Cabot (by Region), FY2011-FY2016
Gross Margin of Cabot, FY2011-FY2017
Activated Carbon Revenue, YoY Growth and % of Total Revenue of Cabot, FY2011-FY2016
Main Products of Cabot
Global Presence of WestRock
WestRock’s Operation, FY2012-FY2016
WestRock’s Revenue (by Product), FY2014-FY2016
WestRock’s Gross Margin, FY2014-FY2016
Ingevity’s Revenue Structure, FY2014-FY2016
Kuraray’s Subsidiaries
Kuraray’s Activated Carbon Production and R&D Bases
Global Presence of Osaka Gas Chemicals Group
Layout and Information of Activated Carbon Production Plants of Japan Enviro Chemicals
Equity Structure of Fujian Yuanli Active Carbon, 2017
Subsidiaries of Fujian Yuanli Active Carbon
Revenue and Net Income of Fujian Yuanli Active Carbon, 2010-2017
Revenue Structure of Fujian Yuanli Active Carbon (by Product), 2015-2016
Revenue of Fujian Yuanli Active Carbon (by Region), 2010-2016
Gross Margin of Fujian Yuanli Active Carbon, 2010-2016
Gross Margin of Fujian Yuanli Active Carbon (by Region), 2010-2016
R&D Costs and % of Total Revenue of Fujian Yuanli Active Carbon, 2010-2016
Main R&D Projects of Fujian Yuanli Active Carbon, 2016
Revenue from Top 5 Clients and % of Total Revenue of Fujian Yuanli Active Carbon, 2010-2016
Procurement from Top 5 Suppliers and % of Total Procurement of Fujian Yuanli Active Carbon, 2010-2016
Activated Carbon Output, Sales Volume and Inventory of Fujian Yuanli Active Carbon, 2011-2016
Main Products of Fujian Yuanli Active Carbon
Capacity of Fujian Xinsen Carbon (by Product)
Activated Carbon Applications of Fujian Xinsen Carbon
Equity Structure of Fujian Zhixing Activated Carbon, 2016
Revenue and Total Profits of Fujian Zhixing Activated Carbon, 2013-2016
Gross Margin of Fujian Zhixing Activated Carbon, 2013-2016
Total Assets and Total Liabilities of Fujian Zhixing Activated Carbon, 2013-2016
Revenue Structure of Fujian Zhixing Activated Carbon (by Product), 2015-2016
Revenue Structure of Fujian Zhixing Activated Carbon (by Region), 2015-2016
R&D Costs and % of Total Revenue of Fujian Zhixing Activated Carbon, 2015-2016
Revenue from Top 5 Clients and % of Total Revenue of Fujian Zhixing Activated Carbon, 2016
50 kt/a Activated Carbon Deep (Fine) Processing Project Planning of Jiangsu Zhuxi Activated Carbon
Properties of Main Activated Carbon Products of Jiangsu Zhuxi Activated Carbon
Equity Structure of Jiangsu Purestar EP Technology, 2016
Revenue and Gross Margin of Jiangsu Purestar EP Technology, 2014-2016
Revenue Structure of Jiangsu Purestar EP Technology (by Product), 2014-2016
Revenue from Top 5 Clients and % of Total Revenue of Jiangsu Purestar EP Technology, 2016
Procurement from Top 5 Suppliers and % of Total Procurement of Jiangsu Purestar EP Technology, 2016
Equity Structure of Ningxia Huahui Activated Carbon, 2016
Main Financial Indices of Ningxia Huahui Activated Carbon, 2011-2016
Revenue Structure of Activated Carbon Business of Ningxia Huahui Activated Carbon (by Region), 2014-2016
Main Overseas Activated Carbon Clients of Ningxia Huahui Activated Carbon
Main Clients of Datong Municipal Yunguang Activated Carbon
Main Financial Indices of Shanxi Xinhua Chemical, 2015-2016
Main Production Lines and Capacity of Shanxi Xinhua Activated Carbon
Revenue of Inner Mongolia Taixi Coal Group, 2010-2016
Activated Carbon Output and Sales Volume of Inner Mongolia Taixi Coal Group, 2010-2014
Production Process of Activated Carbon for Water Treatment of Datong Coal Jinding Activated Carbon
Production Process of Activated Carbon Briquettes of Datong Coal Jinding Activated Carbon
Production Process of Activated Carbon for Desulfurization and Denitrification of Datong Coal Jinding Activated Carbon
Revenue and Gross Margin of Datong Coal Jinding Activated Carbon, 2015-2016
Revenue and Net Income of Shanxi Huaqing Activated Carbon Group, 2013-2016
Revenue Structure of Shanxi Huaqing Activated Carbon Group (by Region), 2015-2016
Revenue from Top 5 Clients and % of Total Revenue of Shanxi Huaqing Activated Carbon Group, 2016
Procurement from Top 5 Suppliers and % of Total Procurement of Shanxi Huaqing Activated Carbon Group, 2016
Global and China Synthetic Rubber Industry Report, 2021-2027
Synthetic rubber is a polymer product made of coal, petroleum and natural gas as main raw materials and polymerized with dienes and olefins as monomers, which is typically divided into general synthet...
Global and China Carbon Fiber Industry Report, 2021-2026
Carbon fiber is a kind of inorganic high performance fiber (with carbon content higher than 90%) converted from organic fiber through heat treatment. As a new material with good mechanical properties,...
Global and China Dissolving Pulp Industry Report, 2019-2025
In 2018, global dissolving pulp capacity outstripped 10 million tons and its output surged by 14.0% from a year ago to 7.07 million tons, roughly 70% of the capacity. China, as a key supplier of disso...
Global and China 1, 4-butanediol (BDO) Industry Report, 2019-2025
1,4-butanediol (BDO), an essential organic and fine chemical material, finds wide application in pharmaceuticals, chemicals, textile and household chemicals.
As of the end of 2018, the global BDO cap...
Global and China Carbon Fiber and CFRP Industry Report, 2019-2025
Among the world’s three major high performance fibers, carbon fiber features the highest strength and the highest specific modulus. It is widely used in such fields as aerospace, sports and leisure.
...
Global and China Natural Rubber Industry Report, 2019-2025
In 2018, global natural rubber industry continued remained at low ebb, as a result of economic fundamentals. Global natural rubber price presented a choppy downtrend and repeatedly hit a record low in...
Global and China Ultra High Molecular Weight Polyethylene (UHMWPE) Industry Report, 2019-2025
Ultra high molecular weight polyethylene (UHMWPE), a kind of linear polyethylene with relative molecular weight of above 1.5 million used as an engineering thermoplastic with excellent comprehensive p...
China Polyether Monomer Industry Report, 2019-2025
China has seen real estate boom and issued a raft of policies for continuous efforts in improving weak links in infrastructure sector over the years. Financial funds of RMB1,663.2 billion should be al...
Global and China Viscose Fiber Industry Report, 2019-2025
Over the recent years, the developed countries like the United States, Japan and EU members have withdrawn from the viscose fiber industry due to environmental factor and so forth, while the viscose f...
Global and China Synthetic Rubber (BR, SBR, EPR, IIR, NBR, Butadiene, Styrene, Rubber Additive) Industry Report, 2018-2023
In 2018, China boasted a total synthetic rubber capacity of roughly 6,667kt/a, including 130kt/a new effective capacity. Considering capacity adjustment, China’s capacity of seven synthetic rubbers (B...
Global and China Dissolving Pulp Industry Report, 2018-2022
With the commissioning of new dissolving pulp projects, the global dissolving pulp capacity had been up to about 8,000 kt by the end of 2017. It is worth noticing that the top six producers including ...
Global and China Carbon Fiber and CFRP Industry Report, 2018-2022
As a new generation of reinforced fiber boasting intrinsic properties of carbon material and excellent processability of textile fiber, carbon fiber is the one with the highest specific strength and s...
Global and China Ultra High Molecular Weight Polyethylene (UHMWPE) Industry Report, 2017-2021
Ultra High Molecular Weight Polyethylene (UHMWPE), a kind of linear polyethylene with relative molecular weight of above 1.5 million and an engineering thermoplastic with excellent comprehensive prope...
Global and China Aramid Fiber Industry Report, 2017-2021
Global aramid fiber output totaled 115kt with capacity utilization of 76.0% in 2016. As industries like environmental protection and military develop, the output is expected to rise to 138kt and capac...
Global and China Natural Rubber Industry Report, 2017-2021
In 2016, the global natural rubber output edged up 1.1% year on year to 12.4 million tons, and the consumption rose by 3.8% year on year to 12.6 million tons, indicating the gap of 200,000 tons betwee...
China Synthetic Rubber Industry Report, 2017-2021
Synthetic rubber is one of important strategic materials, mainly used in tyres and other industries. In 2016, the global output and consumption of synthetic rubber reached 14.822 million tons and 14.9...
Global and China 1,4-butanediol (BDO) Industry Report, 2017-2021
1,4-butanediol (BDO) is a key raw material for organic and fine chemicals, capable of generating various derivatives like THF, PTMEG and GBL. BDO and its derivatives find wide application in PBT plast...
Global and China Ethylene Oxide (EO) Industry Report, 2017-2021
Ethylene oxide (EO) is one of the major derivatives of the ethylene industry. Featured with special reactivity, it can generate a series of fine chemical products for a wide range of applications.
In...