Global and China Dissolving Pulp Industry Report, 2018-2022
-
Sep.2018
- Hard Copy
- USD
$3,000
-
- Pages:105
- Single User License
(PDF Unprintable)
- USD
$2,800
-
- Code:
ZLC066
- Enterprise-wide License
(PDF Printable & Editable)
- USD
$4,200
-
- Hard Copy + Single User License
- USD
$3,200
-
With the commissioning of new dissolving pulp projects, the global dissolving pulp capacity had been up to about 8,000 kt by the end of 2017. It is worth noticing that the top six producers including Sappi, Aditya Birla, Lenzing, Sun Paper, Bracell and Rayonier boast the combined capacity of approximately 4,443.25 kt as a percentage of 55.5% in global total.
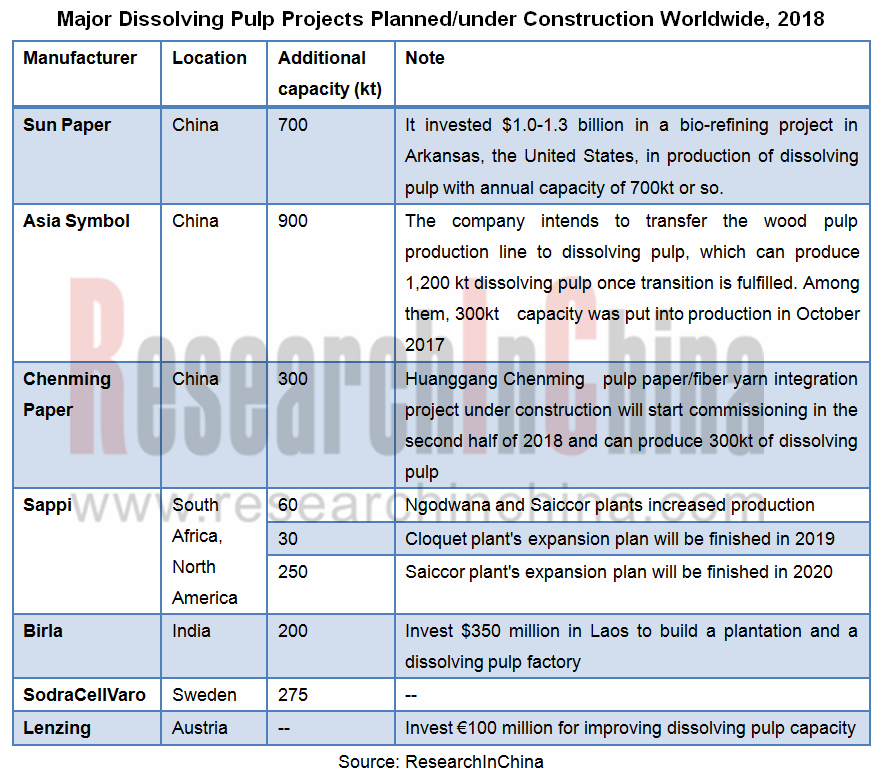
So far, foreign giants like Sappi, Birla and Lenzing, as well as Chinese peers such as Sun Paper, Asia Symbol and Chenming Paper, have been ramping up production of dissolving pulp aggressively, from which it can be seen that the world’s production of dissolving pulp is on the rise and will lead to overcapacity in future, and that small and medium-sized manufacturers will be forced to retreat from the market, contributing to higher concentration of the dissolving pulp industry.
As a major global consumer of dissolving pulp, the apparent consumption of dissolving pulp in China has risen steadily in recent years, and reached 4,420 kt in 2017, up 4.2% year-on-year. However, China's dissolving pulp capacity utilization rate is not high, with the actual output of 1,800 kt and the import dependence rate of 59.3%.
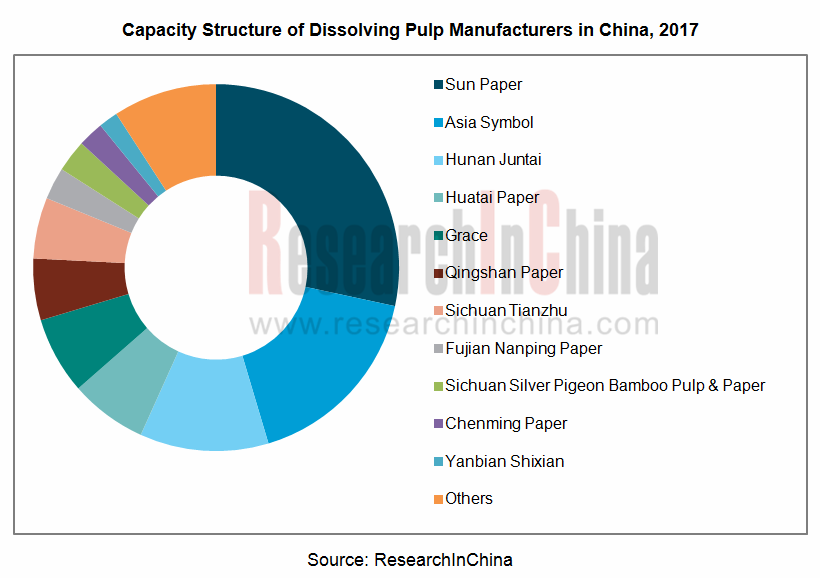
There are now about a dozen Chinese dissolving pulp manufacturers, among which Sun Paper, Hunan Juntai and Asia Symbol possess higher productivity reaching 500kt, 300kt and 200kt respectively, together occupying 56.7% of the total capacity.
In 2013, China initiated anti-dumping investigation against imported dissolving pulp products, because the imports flooded at low prices and took a lion’s share in the Chinese dissolving pulp market and caused serious excess of dissolving pulp capacity in China. Moreover, Chinese government also decided in August 2018 to impose 5% tariff on dissolving pulp originating in the United States. These measures favor the development of local enterprises, and it is expected that China's dissolving pulp production will rise steadily in the next few years, and its import dependence will go down.
Global and China Dissolving Pulp Industry Report, 2018-2022 by ResearchInChina focuses on the followings:
 Global dissolving pulp industry (development status, competitive landscape, prices, etc.);
China’s dissolving pulp industry (development status, anti-dumping investigation, supply/demand, competitive landscape, imports, etc.);
Downstream viscose fiber industry (status quo, capacity, output, imports/exports, prices, etc.);
5 global and 8 Chinese dissolving pulp producers (operation, R&D investment, dissolving pulp business, etc.);
Conclusion and forecast.
1. Overview of Dissolving Pulp Industry
1.1 Definition & Classification
1.2 Industrial Chain
2. Global Dissolving Pulp Industry
2.1 Status Quo
2.2 Competition
2.3 Prices
3. China Dissolving Pulp Industry
3.1 Status Quo
3.2 Anti-dumping Investigation
3.3 Supply
3.4 Demand
3.5 Prices
3.6 Import
3.7 Competition
4. Downstream Viscose Fiber Market
4.1 Overview
4.2 Capacity
4.3 Output
4.4 Import & Export
4.4.1 Import & Export Volume
4.4.2 Import & Export Country
4.4.3 Import & Export Region
4.5 Prices
5. Major Dissolving Pulp Companies Worldwide
5.1 Bracell
5.1.1 Profile
5.1.2 Operation
5.1.3 Dissolving Pulp Business
5.1.4 Business in China
5.2 Sappi
5.2.1 Profile
5.2.2 Operation
5.2.3 Revenue Structure
5.2.4 Dissolving Pulp Business
5.2.5 Business in China
5.3 Aditya Birla Group
5.3.1 Profile
5.3.2 Operation of Grasim
5.3.3 Revenue Structure of Grasim
5.3.4 Dissolving Pulp Business of Grasim
5.3.5 Business in China
5.4 Lenzing
5.4.1 Profile
5.4.2 Operation
5.4.3 Revenue Structure
5.4.4 Operation of Fiber Segment
5.4.5 Dissolving Pulp Business
5.4.6 Business in China
5.5 Rayonier AM
5.5.1 Profile
5.5.2 Operation
5.5.3 Dissolving Pulp Business
6. Major Chinese Dissolving Pulp Manufacturers
6.1 Shandong Sun Paper Industry Joint Stock Co., Ltd.
6.1.1 Profile
6.1.2 Operation
6.1.3 Revenue Structure
6.1.4 Gross Margin
6.1.5 R&D Investment
6.1.6 Dissolving Pulp Business
6.1.7 Forecast and Outlook
6.2 Fujian Qingshan Paper Industry Co., Ltd.
6.2.1 Profile
6.2.2 Operation
6.2.3 Revenue Structure
6.2.4 Gross Margin
6.2.5 R&D Investment
6.2.6 Dissolving Pulp Business
6.2.7 Forecast and Outlook
6.3 Yueyang Forest & Paper Co., Ltd.
6.3.1 Profile
6.3.2 Operation
6.3.3 Revenue Structure
6.3.4 Gross Margin
6.3.5 R&D Investment
6.3.6 Dissolving Pulp Business
6.3.7 Forecast and Outlook
6.4 Shandong Chenming Paper Holdings Ltd.
6.4.1 Profile
6.4.2 Operation
6.4.3 Revenue Structure
6.4.4 Gross Margin
6.4.5 R&D Investment
6.4.6 Dissolving Pulp Business
6.4.7 Forecast and Outlook
6.5 Shandong Huatai Paper Co., Ltd.
6.5.1 Profile
6.5.2 Operation
6.5.3 Revenue Structure
6.5.4 Gross Margin
6.5.5 R&D Investment
6.5.6 Dissolving Pulp Business
6.5.7 Forecast and Outlook
6.6 Yanbian Shixian Double-deer Industrial Co., Ltd.
6.6.1 Profile
6.6.2 Dissolving Pulp Business
6.7 Yibin Grace Group Co., Ltd.
6.7.1 Profile
6.7.2 Dissolving Pulp Business
6.8 Sichuan Tianzhu Bamboo Resource Development Co., Ltd.
6.9 Asia Symbol (Shandong) Pulp & Paper Co., Ltd.
7. Conclusion & Prediction
7.1 Conclusion
7.2 Prediction
7.2.1 Supply & Demand Forecast
7.2.2 Downstream Forecast
Classification of Dissolving Pulp (by Raw Materials)
Industrial Chain of Dissolving Pulp
Other Downstream Products and Applications of Dissolving Pulp
Major Global Dissolving Pulp Manufacturers and Their Capacity, 2017
Capacity Structure of Major Global Dissolving Pulp Manufacturers, 2017
Key Dissolving Pulp Projects Planned/Under Construction Worldwide, 2018
Dissolving Pulp Prices Worldwide (Unit: USD/ton), 2011-2015
China's Anti-dumping Investigation on Pulp from USA, Canada and Brazil
Dissolving Pulp Capacity in China, 2010-2017
Dissolving Pulp Output in China (by Product), 2012-2017
Output Structure of Dissolving Pulp in China (by Product), 2012-2017
Apparent Consumption of Dissolving Pulp in China, 2012-2017
Market Prices of Dissolving Pulp in China (Unit: RMB/ton), 2012-2016
Price Trend of Viscose Staple Fiber and Dissolving Pulp in China, 2016-2018
Price Trend of Dissolving Pulp in China, Jan.-Aug. 2018
Dissolving Pulp Import and YoY Change in China, 2010-2017
Average Import Price of Dissolving Pulp in China, 2010-2017
Major Dissolving Pulp Manufacturers in China and Their Capacity, 2017
Capacity Structure of Dissolving Pulp Manufacturers in China, 2017
Major Varieties of Fiber Worldwide
Fiber Consumption Structure Worldwide, 2015
Fiber Consumption Structure Worldwide, 2017
Major Viscose Staple Fiber Manufacturers in China and Their Capacity, 2017
Distribution of Viscose Staple Fiber Capacity in China, 2017
Distribution of Viscose Staple Fiber Capacity in China by Region, 2017
Viscose Fiber Output and YoY Growth in China, 2006-2017
Viscose Staple Fiber Imports/Exports in China, 2010-2015
Average Import/Export Prices of Viscose Staple Fiber in China, 2010-2015
Destinations of Exported Viscose Staple Fiber from China by Export Volume, 2015
Sources of Imported Viscose Staple Fiber in China by Import Volume, 2015
Major Viscose Staple Fiber Export Cities and Their Export Volume in China (%), 2015
Major Viscose Staple Fiber Import Cities and Their Import Volume in China (%), 2015
Market Prices of Viscose Staple Fiber and Viscose Filament Yarn in China (Unit: RMB/ton), 2008-2015
Market Prices of Viscose Staple Fiber in China (RMB /ton), 2004-2017
Price Trend of Viscose Staple Fiber in China (RMB /ton), 2018
Product Line and Applications of Bracell
Revenue and Net Income of Bracell, 2010-2016
Dissolving Wood Pulp Revenue Breakdown (by Region) of Bracell, 2013-2016
Dissolving Wood Pulp Revenue Structure (by Region) of Bracell, 2013-2016
Dissolving Wood Pulp Production, Sales Volume and Revenue of Bracell, 2013-2016
Viscose Pulp Sales as a Percentage of Bracell’s Dissolving Pulp Sales, 2013-2016
Specialty Pulp Sales as a Percentage of Bracell’s Dissolving Wood Pulp Sales, 2013-2016
Capacity of Sappi's Major Products
Sappi’s Three Production Bases and Capacity of Major Products, by end-2017
Revenue and EBITDA of Sappi, 2010-2018
Revenue Breakdown (by Branches) of Sappi, 2012-2017
Revenue Structure (by Branches) of Sappi, 2012-2017
Sales Volume of Sappi by Product, 2014-2017
Dissolving Pulp Manufacturing Plants and Capacity of Sappi, 2017
Sales Volume of Dissolving Wood Pulp of Sappi, 2012-2017
Revenue and EBITDA of Grasim, FY 2014-FY2018
Revenue Breakdown (by Product) of Grasim, FY2014-FY2018
Revenue Structure (by Product) of Grasim, FY2018
Production and Sales of Grasim, FY2014-FY2018
Grasim's Capacity of Viscose Staple Fiber and Dissolving Pulp, FY2018
Staff Structure of Lenzing by Country, 2017
Revenue and EBITDA of Lenzing, 2010-2017
Revenue Structure (by Product) of Lenzing, 2012-2018
Revenue Structure (by Region) of Lenzing, 2012-2018
Revenue and EBITDA of Lenzing’s Fiber Division, 2010-2018
Revenue Breakdown (by Product) of Lenzing’s Fiber Division, 2012-2018
Revenue Structure (by Product) of Lenzing’s Fiber Division, 2012-2018
Major Production Bases of Dissolving Pulp and Their Capacities of Lenzing, by end-2017
Revenue and Net Income of Lenzing (Nanjing) Fiber, 2010-2018
Major Products of Rayonier AM
Revenue and Net Income of Rayonier AM, 2013-2018
Revenue Breakdown of Rayonier AM (by Product), 2015-2018
Revenue from High Purity Cellulose of Rayonier AM, 2015-2018
Revenue and Net Income of Shandong Sun Paper, 2011-2018
Revenue Breakdown (by Product) of Shandong Sun Paper, 2014-2017
Revenue Structure (by Product) of Shandong Sun Paper, 2014-2017
Revenue Breakdown (by Region) of Shandong Sun Paper, 2013-2017
Revenue Structure (by Region) of Shandong Sun Paper, 2013-2017
Gross Margin (by Product) of Shandong Sun Paper, 2014-2017
R&D Investment and % of Total Revenue of Shandong Sun Paper, 2014-2017
Revenue from Dissolving Pulp and its Share of Total Revenue of Shandong Sun Paper, 2014-2017
Revenue and Net Income of Shandong Sun Paper, 2017-2022E
Revenue and Net Income of Fujian Qingshan Paper Industry, 2010-2018
Revenue Breakdown (by Product) of Fujian Qingshan Paper Industry, 2012-2017
Revenue Structure (by Product) of Fujian Qingshan Paper Industry, 2012-2017
Gross Margin of Fujian Qingshan Paper Industry, 2012-2017
Gross Margin (by Product) of Fujian Qingshan Paper Industry, 2012-2017
R&D Investment and % of Total Revenue of Fujian Qingshan Paper Industry, 2012-2017
Progress of Major Investment Projects of Fujian Qingshan Paper Industry, as of 2018H1
Paper Pulp Output and Sales of Fujian Qingshan Paper Industry, 2015-2017
Revenue and Net Income of Fujian Qingshan Paper Industry, 2017-2022E
Revenue and Net Income of Yueyang Forest & Paper, 2010-2018
Revenue Breakdown (by Product) of Yueyang Forest & Paper, 2014-2017
Revenue Structure (by Product) of Yueyang Forest & Paper, 2014-2017
Gross Margin (by Product) of Yueyang Forest & Paper, 2014-2017
R&D Investment and % of Total Revenue of Yueyang Forest & Paper, 2013-2017
Revenue and Net Income of Yueyang Forest & Paper, 2017-2022E
Revenue and Net Income of Shandong Chenming Paper, 2010-2018
Revenue Breakdown (by Product) of Shandong Chenming Paper, 2012-2018
Revenue Structure (by Product) of Shandong Chenming Paper, 2012-2018
Revenue Breakdown (by Region) of Shandong Chenming Paper, 2012-2018
Revenue Structure (by Region) of Shandong Chenming Paper, 2012-2018
Gross Margin (by Product) of Shandong Chenming Paper, 2012-2017
R&D Investment and % of Total Revenue of Shandong Chenming Paper, 2013-2018
Progress of Dissolving Pulp Projects under Construction of Shandong Chenming Paper, as of 2018H1
Revenue and Net Income of Shandong Chenming Paper, 2017-2022E
Revenue and Net Income of Shandong Huatai Paper, 2010-2018
Revenue Breakdown (by Product) of Shandong Huatai Paper, 2012-2018
Revenue Structure (by Product) of Shandong Huatai Paper, 2012-2018
Gross Margin (by Product) of Shandong Huatai Paper, 2012-2018
R&D Investment and % of Total Revenue of Shandong Huatai Paper, 2013-2018
Revenue and Net Income of Anhui Huatai, 2012-2018
Revenue and Net Income of Shandong Huatai Paper, 2017-2022E
Specifications of Major Wood Pulp Products of Yanbian Shixian
Comparison between Global and Chinese Dissolving Pulp Manufacturers in Operation, 2014-2017
Global Major Dissolving Pulp Projects Planned/Under Construction, 2018
Output and Apparent Consumption of Dissolving Pulp in China, 2017-2022E
Dissolving Pulp Import Dependence in China, 2017-2022E
Viscose Fiber Projects under Construction in China, by end-2017
Output and YoY Growth of Viscose Fiber in China, 2017-2022E
Global and China Synthetic Rubber Industry Report, 2021-2027
Synthetic rubber is a polymer product made of coal, petroleum and natural gas as main raw materials and polymerized with dienes and olefins as monomers, which is typically divided into general synthet...
Global and China Carbon Fiber Industry Report, 2021-2026
Carbon fiber is a kind of inorganic high performance fiber (with carbon content higher than 90%) converted from organic fiber through heat treatment. As a new material with good mechanical properties,...
Global and China Dissolving Pulp Industry Report, 2019-2025
In 2018, global dissolving pulp capacity outstripped 10 million tons and its output surged by 14.0% from a year ago to 7.07 million tons, roughly 70% of the capacity. China, as a key supplier of disso...
Global and China 1, 4-butanediol (BDO) Industry Report, 2019-2025
1,4-butanediol (BDO), an essential organic and fine chemical material, finds wide application in pharmaceuticals, chemicals, textile and household chemicals.
As of the end of 2018, the global BDO cap...
Global and China Carbon Fiber and CFRP Industry Report, 2019-2025
Among the world’s three major high performance fibers, carbon fiber features the highest strength and the highest specific modulus. It is widely used in such fields as aerospace, sports and leisure.
...
Global and China Natural Rubber Industry Report, 2019-2025
In 2018, global natural rubber industry continued remained at low ebb, as a result of economic fundamentals. Global natural rubber price presented a choppy downtrend and repeatedly hit a record low in...
Global and China Ultra High Molecular Weight Polyethylene (UHMWPE) Industry Report, 2019-2025
Ultra high molecular weight polyethylene (UHMWPE), a kind of linear polyethylene with relative molecular weight of above 1.5 million used as an engineering thermoplastic with excellent comprehensive p...
China Polyether Monomer Industry Report, 2019-2025
China has seen real estate boom and issued a raft of policies for continuous efforts in improving weak links in infrastructure sector over the years. Financial funds of RMB1,663.2 billion should be al...
Global and China Viscose Fiber Industry Report, 2019-2025
Over the recent years, the developed countries like the United States, Japan and EU members have withdrawn from the viscose fiber industry due to environmental factor and so forth, while the viscose f...
Global and China Synthetic Rubber (BR, SBR, EPR, IIR, NBR, Butadiene, Styrene, Rubber Additive) Industry Report, 2018-2023
In 2018, China boasted a total synthetic rubber capacity of roughly 6,667kt/a, including 130kt/a new effective capacity. Considering capacity adjustment, China’s capacity of seven synthetic rubbers (B...
Global and China Dissolving Pulp Industry Report, 2018-2022
With the commissioning of new dissolving pulp projects, the global dissolving pulp capacity had been up to about 8,000 kt by the end of 2017. It is worth noticing that the top six producers including ...
Global and China Carbon Fiber and CFRP Industry Report, 2018-2022
As a new generation of reinforced fiber boasting intrinsic properties of carbon material and excellent processability of textile fiber, carbon fiber is the one with the highest specific strength and s...
Global and China Ultra High Molecular Weight Polyethylene (UHMWPE) Industry Report, 2017-2021
Ultra High Molecular Weight Polyethylene (UHMWPE), a kind of linear polyethylene with relative molecular weight of above 1.5 million and an engineering thermoplastic with excellent comprehensive prope...
Global and China Aramid Fiber Industry Report, 2017-2021
Global aramid fiber output totaled 115kt with capacity utilization of 76.0% in 2016. As industries like environmental protection and military develop, the output is expected to rise to 138kt and capac...
Global and China Natural Rubber Industry Report, 2017-2021
In 2016, the global natural rubber output edged up 1.1% year on year to 12.4 million tons, and the consumption rose by 3.8% year on year to 12.6 million tons, indicating the gap of 200,000 tons betwee...
China Synthetic Rubber Industry Report, 2017-2021
Synthetic rubber is one of important strategic materials, mainly used in tyres and other industries. In 2016, the global output and consumption of synthetic rubber reached 14.822 million tons and 14.9...
Global and China 1,4-butanediol (BDO) Industry Report, 2017-2021
1,4-butanediol (BDO) is a key raw material for organic and fine chemicals, capable of generating various derivatives like THF, PTMEG and GBL. BDO and its derivatives find wide application in PBT plast...
Global and China Ethylene Oxide (EO) Industry Report, 2017-2021
Ethylene oxide (EO) is one of the major derivatives of the ethylene industry. Featured with special reactivity, it can generate a series of fine chemical products for a wide range of applications.
In...