Global and China Synthetic Rubber (BR, SBR, EPR, IIR, NBR, Butadiene, Styrene, Rubber Additive) Industry Report, 2018-2023
-
Jan.2019
- Hard Copy
- USD
$3,000
-
- Pages:160
- Single User License
(PDF Unprintable)
- USD
$2,800
-
- Code:
CYH081
- Enterprise-wide License
(PDF Printable & Editable)
- USD
$4,200
-
- Hard Copy + Single User License
- USD
$3,200
-
In 2018, China boasted a total synthetic rubber capacity of roughly 6,667kt/a, including 130kt/a new effective capacity. Considering capacity adjustment, China’s capacity of seven synthetic rubbers (BR, SBR, EPR, IIR, NBR, IR and CR) and styrene block copolymer (SBC) will ranged at estimated 6,870kt/a in 2019, 205kt/a of which will be newly added. But it is still very uncertain that the country’s several plants will be put into production as scheduled.
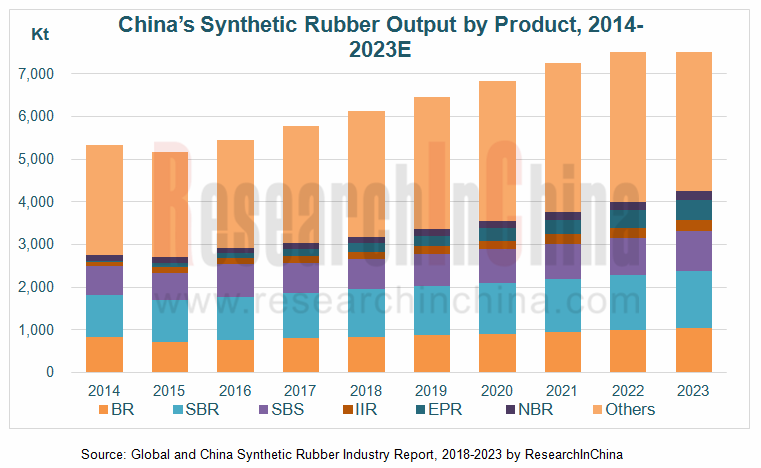
Over the past two years, China’s synthetic rubber market sustained steady growth as a pickup in price among other factors prompted some synthetic rubber plants to resume production after being out of operation for years. China’s output of synthetic rubber reached 5,787 kt in 2017, up 6.0% from a year ago before climbing to 6,123 kt in 2018, and will expectedly hit 8,110kt in 2023, at a growth rate of around 6% during 2018-2023.
Styrene butadiene rubber (SBR) and butadiene rubber (BR) are the two most common synthetic rubbers in China, with capacity respectively accounting for 32.1% and 25.8% of the country’s total synthetic rubber capacity in 2018. With the largest output among main synthetic rubbers, SBR and BR seized a combined 32.4% share of China’s total synthetic rubber output in 2017. But their production growth slowed down evidently, while special rubber products like ethylene propylene rubber (EPR) and nitrile butadiene rubber (NBR) began to boom, especially the fastest-growing EPR whose output jumped by 29.5% to 202.6 kt in 2018.
In 2018, China’s import and export of main synthetic rubbers dropped differently, for example, BR imports and exports fell by 27.1% and 8.5% in the first eleven months of 2018 to 181.6 kt and 31.4 kt from the prior-year period, respectively. Slowing downstream demand was at play in the situation; another cause was the escalating trade tensions between China and America from March 2018: almost all of China’s products in the synthetic rubber industry chain were on the list of America’s tariffs on USD200 billion of Chinese goods. Although both countries had agreed to suspend tariff increase in late 2018, it still hurt China’s imports and exports of synthetic rubber products.
Moreover, Chinese producers tried hard and invested heavily to develop new products in recent years, having made some breakthroughs. Examples include PetroChina’s successful commissioning of self-developed high-strength SBR, SSBR2060 in its Dushanzi Refinery in July 2018; PetroChina Jilin Petrochemical Research Institute’s accomplishment of optimization test of self-developed high-strength SBR, SBR1566 in November 2018 and its successful development of a new ethylene propylene rubber (EPR), X-0150 in the same month.
Global and China Synthetic Rubber Industry Report, 2018-2023 highlights the following:
 Global synthetic rubber market (supply and demand, product mix, regional pattern, development trends, etc.);
China synthetic rubber market (supply and demand, import and export, product mix, regional pattern, enterprise pattern, development trends, etc.);
China synthetic rubber market segments (BR, SBR, IIR, EPR and NBR) (supply and demand, import and export, enterprise pattern, etc.);
China synthetic rubber (butadiene, styrene and rubber additive) raw materials market;
Global and Chinese synthetic rubber downstream sector (tire);
21 key Chinese synthetic rubber companies (operation, development strategy, etc.).
1. Overview of Synthetic Rubber
1.1 Definition
1.2 Classification
1.3 Industrial Chain
2. Overview of Global Synthetic Rubber Industry
2.1 Overview
2.2 Market Supply and Demand
2.3 Regional Structure
2.4 Development Trend
3. Overview of China Synthetic Rubber Industry
3.1 Market Supply and Demand
3.1.1 Market Supply
3.1.2 Market Demand
3.2 Import and Export
3.2.1 Import
3.2.2 Export
3.3 Product Structure
3.4 Regional Distribution
3.5 Enterprise Pattern
3.6 Development Trend
4. Key Chinese Synthetic Rubber Market Segments
4.1 Butadiene Rubber (BR)
4.1.1 Market Supply
4.1.2 Import and Export
4.1.3 Market Demand
4.1.4 Competitive Landscape
4.1.5 Price
4.1.6 Development Trend
4.2 Styrene Butadiene Rubber (SBR)
4.2.1 Market Supply
4.2.2 Import and Export
4.2.3 Market Demand
4.2.4 Competitive Landscape
4.2.5 Price
4.2.6 Development Trend
4.3 Ethylene Propylene Rubber (EPR)
4.3.1 Market Supply
4.3.2 Import and Export
4.3.3 Market Demand
4.3.4 Competitive Landscape
4.3.5 Price
4.3.6 Development Trend
4.4 Isobutylene Isoprene Rubber (IIR)
4.4.1 Market Supply
4.4.2 Import and Export
4.4.3 Market Demand
4.4.4 Competitive Landscape
4.4.5 Price
4.4.6 Development Trend
4.5 Nitrile-butadiene Rubber (NBR)
4.5.1 Market Supply
4.5.2 Import and Export
4.5.3 Market Demand
4.5.4 Competitive Landscape
4.5.5 Price
4.5.6 Development Trend
5. Upstream of Synthetic Rubber in China
5.1 Butadiene
5.1.1 Market Supply
5.1.2 Import and Export
5.1.3 Market Demand
5.1.4 Price
5.1.5 Competitive Landscape
5.1.6 Development Trend
5.2 Styrene
5.2.1 Market Supply
5.2.2 Import and Export
5.2.3 Market Demand
5.2.4 Price
5.2.5 Competitive Landscape
5.2.6 Development Trend
5.3 Rubber Additive
5.3.1 Market Supply and Demand
5.3.2 Price
5.3.3 Competitive Landscape
6. Tire Market Development
6.1 Global Market
6.2 China
7. Key Chinese Synthetic Rubber Enterprises
7.1 Sinopec
7.1.1 Profile
7.1.2 Operation
7.1.3 Synthetic Rubber Business
7.1.4 Sinopec Yangzi Petrochemical
7.1.5 Sinopec Beijing Yanshan
7.1.6 Sinopec Qilu
7.1.7 Sinopec Maoming
7.1.8 Sinopec Baling
7.1.9 Sinopec Shanghai Gaoqiao
7.2 PetroChina
7.2.1 Profile
7.2.2 Operation
7.2.3 Synthetic Rubber Business
7.2.4 PetroChina Lanzhou Petrochemical
7.2.5 PetroChina Jilin Petrochemical
7.2.6 PetroChina Daqing Petrochemical
7.2.7 PetroChina Dushanzi Petrochemical
7.2.8 PetroChina Jinzhou Petrochemical
7.2.9 PetroChina Fushun Petrochemical
7.2.10 PetroChina Sichuan Petrochemical
7.3 Shandong Yuhuang Chemical (Group)
7.3.1 Profile
7.3.2 Operation
7.3.3 Synthetic Rubber Business
7.4 TSRC
7.4.1 Profile
7.4.2 Operation
7.4.3 Synthetic Rubber Business
7.5 Lande Fine Chemical
7.5.1 Profile
7.5.2 Operation
7.6 Zhenjiang Nantex Chemical Industry
7.6.1 Profile
7.6.2 Operation
7.7 Other Enterprises
7.7.1 Gaoqiao BASF Dispersions
7.7.2 Shanxi Synthetic Rubber
7.7.3 Dow Chemical (Zhangjiagang)
7.7.4 Bridgestone (Huizhou)
7.7.5 Hangzhou Zhechen Rubber
7.7.6 Tianjin Lugang Petroleum Rubber
7.7.7 Fujian Meizhouwan Chlor-Alkali Industry
7.7.8 Zhejiang Cenway New Synthetic Materials
7.7.9 Chongqing Changshou Chemical
7.7.10 Panjin Heyun New Materials
7.7.11 Shandong Huamao New Materials
7.7.12 Fushun Yikesi New Materials
7.7.13 Ningbo Shunze Rubber
7.7.14 Shandong Jusage
7.7.15 Liaoning North Dynasol Synthetic Rubber
Properties and Applications of Synthetic Rubber (by Type)
Synthetic Rubber Industry Chain
Global Synthetic Rubber Capacity, 2011-2018
Global Synthetic Rubber Output and Consumption, 2008-2018
Global Synthetic Rubber Output and Consumption Structure, 2008-2017
Global Synthetic Rubber Capacity Structure (by Product), 2017
Global Synthetic Rubber Capacity (by Region), 2010-2016
Global Synthetic Rubber Output (by Region), 2014-2017
Global Synthetic Rubber Consumption (by Region), 2008-2017
Global Synthetic Rubber Output and Consumption, 2017-2023E
China’s Synthetic Rubber Capacity (by Enterprise), 2015-2018
Global Share of China’s Synthetic Rubber Capacity (by Product), 2017
China’s Synthetic Rubber Capacity and YoY Growth, 2012-2018
China’s Synthetic Rubber Output and YoY Growth, 2007-2018
China’s Synthetic Rubber Apparent Consumption and Self-sufficiency Rate, 2007-2018
Increase of Tarriff on Synthetic Rubber Products Imported from China Imposed by USA, 2018
China’s Synthetic Rubber Import Volume and YoY Growth, 2007-2018
China’s Synthetic Rubber Import Value and YoY Growth, 2007-2018
China’s Synthetic Rubber Export Volume and YoY Growth, 2007-2017
China’s Synthetic Rubber Export Value and YoY Growth, 2010-2017
China’s Synthetic Rubber Capacity (by Product), 2012-2018
China’s Synthetic Rubber Output (by Variety), 2017&2023E
Top 10 Synthetic Rubber Provinces in China (by Output), 2016-2017
Major Provinces/Cities of Synthetic Rubber Development in China, 2019
Capacity and Share of Top 20 Synthetic Rubber Enterprises in China, 2018
Balance between China’s Synthetic Rubber Production and Demand, 2015-2023E
China’s Synthetic Rubber Output (by Product), 2014-2023E
China BR Capacity (by Enterprise), 2012-2018
China’s BR Capacity and YoY Growth, 2008-2018
China’s BR Output and YoY Growth, 2008-2018
China’s BR Operating Rate, 2017-2018
China’s BR Import Volume and YoY Growth, 2008-2018
China’s BR Export Volume and YoY Growth, 2008-2018
China’s BR Apparent Consumption and Self-sufficiency Rate, 2008-2018
China’s BR Demand Structure (by Purpose), 2011-2018
Pattern of BR Enterprises in China (by Capacity), 2018
BR Projects under Planning in China, 2019
China’s BR Market Price Trend, 2018
China’s BR Market Price Trend, 2006-2018
Balance of Supply and Demand of BR in China, 2018-2023E
Capacity of SBR in China by Enterprise, 2012-2018
China’s SBR Capacity (by Product), 2008-2018
China’s SBR Output and YoY Growth, 2008-2018
China's ESBR Facility Operating Rate, 2017-2018
China’s SBR Import Volume and YoY Growth, 2008-2018
China’s SBR Export Volume and YoY Growth, 2008-2018
China’s SBR Apparent Consumption and Self-sufficiency Rate, 2008-2018
China’s SBR Demand Structure (by Purpose), 2018
Market Share of SBR Enterprises in China (by Capacity), 2018
Price Trend of SBR1502# in China, 2018
Price Trend of SBR1502# in China, 2014-2018
Balance of Supply and Demand of SBR in China, 2018-2023E
Global EPR Capacity Distribution by Region, 2017
China’s EPR Output and YoY Growth, 2008-2018
China EPR Operating Rate, 2018
China’s EPR Import Volume and YoY Growth, 2008-2018
China’s EPR Export Volume and YoY Growth, 2008-2018
China’s EPR Apparent Consumption and Self-sufficiency Rate, 2008-2018
China’s EPR Demand Structure (by Purpose), 2019
Distribution of EPR Capacity (by Enterprise), 2012-2018
EPR Projects under Planning in China, 2019-2023E
Market Average Price of EPDM 4045 in China, 2012-2018
Balance of Supply and Demand of EPR in China, 2018-2023E
China’s IIR Output and YoY Growth, 2008-2018
China’s IIR Import Volume and YoY Growth, 2008-2018
China’s IIR Export Volume and YoY Growth, 2008-2018
China’s IIR Apparent Consumption and Self-sufficiency Rate, 2008-2018
China’s IIR Demand Structure (by Purpose), 2018
IIR Capacity by Enterprise in China, 2012-2018
IIR Projects under Construction in China, 2018-2023E
Market Price Trend of Ordinary IIR and Halogenated IIR in China, 2018
Price Trend of Ordinary HIIR 1675N in China 2017-2018
China’s IIR Supply and Demand, 2018-2023E
Global NBR Capacity Structure by Enterprise, 2018
China’s NBR Capacity and Capacity Utilization, 2008-2018
China’s NBR Output and YoY Growth, 2008-2018
China’s NBR Import Volume and YoY Growth, 2008-2018
China’s NBR Export Volume and YoY Growth, 2008-2018
NBR Imports and Exports in China by Product, 2010-2017
China’s NBR Apparent Consumption and Self-sufficiency Rate, 2007-2018
China’s NBR Demand Structure (by Purpose), 2018
China’s NBR Capacity Structure (by Enterprise), 2018
China’s NBR Capacity (by Enterprise), 2010-2018
China’s NBR Price Trend, 2018
NBR Supply and Demand in China, 2018-2023E
China’s Butadiene Capacity and Capacity Utilization, 2010-2018
China’s Butadiene Output and YoY Growth, 2008-2018
China’s Butadiene Production Process Structure,
China’s Butadiene Import Volume and YoY Growth, 2008-2018
China’s Butadiene Export Volume and YoY Growth, 2007-2017
China’s Butadiene Apparent Consumption and Self-sufficiency Rate, 2008-2018
Downstream Consumption of Butadiene, 2011-2017
Price Trend of Butadiene in China, 2018
China’s Butadiene Capacity Structure (by Enterprise), 2010-2018
China’s Butadiene Capacity Distribution (by Enterprise), 2010-2018
Ongoing and Proposed Butadiene Projects in China, 2019-2023E
Butadiene Supply and Demand in China, 2018-2023E
China’s Styrene Capacity and Capacity Utilization, 2010-2018
China’s Styrene Output and YoY Growth, 2008-2018
China’s Styrene Capacity Distribution (by Region), 2018
Production Cost of Non-integrated Styrene in China, 2017-2018
China’s Styrene Import Volume and YoY Growth, 2008-2018
China’s Styrene Import Value and YoY Growth, 2008-2018
China’s Styrene Export Volume and YoY Growth, 2007-2017
China’s NBR Export Value and YoY Growth, 2007-2017
China’s Styrene Import Volume Structure by Country/Region, 2016-2018
China’s Styrene Apparent Consumption and Self-sufficiency Rate, 2008-2018
China’s Styrene Demand Structure (by Purpose), 2017
Styrene Market Average Price in East China, 2016-2018
Distribution of China’s Styrene Capacity (by Enterprise), 2010-2018
Styrene Projects Proposed to be Constructed in China, 2019-2023E
Balance between China’s Styrene Supply and Demand, 2018-2023E
China’s Rubber Additive Output and YoY Growth, 2013-2023E
China’s Rubber Additive Output (by Product), 2017
China’s Rubber Additive Demand Structure (by Purpose), 2017
Market Price Trend of Accelerator in China, 2017-2018
Top 9 Rubber Additive Enterprises in China (by Revenue), 2018
China’s Tire Cost Structure, 2018
Global Tire Market Size, 2013-2020E
Global Car Tire Market Size, 2014-2020E
Geographical Distribution of Global Tire Shipments, 2017
China’s Car Tire Output, 2008-2018
Monthly Operating Rate of Full-steel Tires in China, 2015-2018
Monthly Operating Rate of Semi-steel Tires in China, 2015-2018
Output of Top 10 Radial Tire Enterprises in China, 2015-2017
Output of Top 10 Full-steel Tire Enterprises in China, 2015-2017
Tire Price Increase of Major Tire Enterprises in China, 2019
Sinopec’s Revenue and YoY Growth, 2008-2018
Sinopec’s Net Income and YoY Growth, 2008-2017
Sinopec’s Revenue (by Sector), 2010-2018
Sinopec’s Gross Margin (by Sector), 2008-2018
Sinopec’s Synthetic Rubber Output and YoY Growth, 2008-2018
Sinopec’s Synthetic Rubber Sales Volume and YoY Growth, 2008-2018
Sinopec’s Synthetic Rubber Revenue and YoY Growth, 2008-2018
Milestones of YPC (Nanjing) Rubber, 2005-2017
Main SBR Products of YPC (Nanjing) Rubber
PetroChina’s Revenue and YoY Growth, 2008-2018
PetroChina’s Net Income and YoY Growth, 2008-2018
PetroChina’s Revenue (by Sector), 2008-2018
PetroChina’s Revenue (by Region), 2008-2018
PetroChina’s Gross Margin (by Sector), 2008-2018
PetroChina’s Synthetic Rubber Output and YoY Growth, 2008-2018
Distribution of Major Subsidiaries of Yuhuang Chemical, 2018
Revenue and Net Income of Yuhuang Chemical, 2009-2018
Revenue of Yuhuang Chemical (by Sector), 2009-2018
Gross Margin of Yuhuang Chemical (by Division), 2009-2018
Synthetic Rubber Capacity, Output and Sales Volume of Yuhuang Chemical, 2010-2017
Synthetic Rubber Revenue and Average Price of Yuhuang Chemical, 2010-2018
Distribution of TSRC’s Subsidiaries, 2018
Events of TSRC, 2018
Revenue and Net Income of TSRC, 2010-2018
TSRC’s Revenue Structure (by Product), 2014-2017
TSRC’s Revenue Structure (by Region), 2018 Q3
TSRC’s Capacity, Output and Output Value (by Product), 2013-2017
TSRC’s Synthetic Rubber Capacity Utilization, 2010-2017
TSRC’s Synthetic Rubber Sales Volume (by Region), 2008-2017
TSRC’s Synthetic Rubber Revenue (by Region), 2008-2017
TSRC’s Synthetic Rubber Capacity (by Enterprise / Product), 2018
Projects under Construction of TSRC, 2018
Footwear Materials Production Capability of TSRC, 2018
Revenue and Net Income of Lande Fine Chemical, 2009-2016
Revenue and Net Income of Zhenjiang Nantex Chemical Industry, 2012-2017
Neoprene Products of Shanna Synthetic Rubber
Synthetic Rubber Products of Hangzhou Zhechen Rubber
Project Investment and Capacity of Tianjin Lugang Petroleum Rubber
Neoprene Products of Chongqing Changshou Chemical
NBR Products of Ningbo Shunze Rubber (by Grade), 2018
Global and China Synthetic Rubber Industry Report, 2021-2027
Synthetic rubber is a polymer product made of coal, petroleum and natural gas as main raw materials and polymerized with dienes and olefins as monomers, which is typically divided into general synthet...
Global and China Carbon Fiber Industry Report, 2021-2026
Carbon fiber is a kind of inorganic high performance fiber (with carbon content higher than 90%) converted from organic fiber through heat treatment. As a new material with good mechanical properties,...
Global and China Dissolving Pulp Industry Report, 2019-2025
In 2018, global dissolving pulp capacity outstripped 10 million tons and its output surged by 14.0% from a year ago to 7.07 million tons, roughly 70% of the capacity. China, as a key supplier of disso...
Global and China 1, 4-butanediol (BDO) Industry Report, 2019-2025
1,4-butanediol (BDO), an essential organic and fine chemical material, finds wide application in pharmaceuticals, chemicals, textile and household chemicals.
As of the end of 2018, the global BDO cap...
Global and China Carbon Fiber and CFRP Industry Report, 2019-2025
Among the world’s three major high performance fibers, carbon fiber features the highest strength and the highest specific modulus. It is widely used in such fields as aerospace, sports and leisure.
...
Global and China Natural Rubber Industry Report, 2019-2025
In 2018, global natural rubber industry continued remained at low ebb, as a result of economic fundamentals. Global natural rubber price presented a choppy downtrend and repeatedly hit a record low in...
Global and China Ultra High Molecular Weight Polyethylene (UHMWPE) Industry Report, 2019-2025
Ultra high molecular weight polyethylene (UHMWPE), a kind of linear polyethylene with relative molecular weight of above 1.5 million used as an engineering thermoplastic with excellent comprehensive p...
China Polyether Monomer Industry Report, 2019-2025
China has seen real estate boom and issued a raft of policies for continuous efforts in improving weak links in infrastructure sector over the years. Financial funds of RMB1,663.2 billion should be al...
Global and China Viscose Fiber Industry Report, 2019-2025
Over the recent years, the developed countries like the United States, Japan and EU members have withdrawn from the viscose fiber industry due to environmental factor and so forth, while the viscose f...
Global and China Synthetic Rubber (BR, SBR, EPR, IIR, NBR, Butadiene, Styrene, Rubber Additive) Industry Report, 2018-2023
In 2018, China boasted a total synthetic rubber capacity of roughly 6,667kt/a, including 130kt/a new effective capacity. Considering capacity adjustment, China’s capacity of seven synthetic rubbers (B...
Global and China Dissolving Pulp Industry Report, 2018-2022
With the commissioning of new dissolving pulp projects, the global dissolving pulp capacity had been up to about 8,000 kt by the end of 2017. It is worth noticing that the top six producers including ...
Global and China Carbon Fiber and CFRP Industry Report, 2018-2022
As a new generation of reinforced fiber boasting intrinsic properties of carbon material and excellent processability of textile fiber, carbon fiber is the one with the highest specific strength and s...
Global and China Ultra High Molecular Weight Polyethylene (UHMWPE) Industry Report, 2017-2021
Ultra High Molecular Weight Polyethylene (UHMWPE), a kind of linear polyethylene with relative molecular weight of above 1.5 million and an engineering thermoplastic with excellent comprehensive prope...
Global and China Aramid Fiber Industry Report, 2017-2021
Global aramid fiber output totaled 115kt with capacity utilization of 76.0% in 2016. As industries like environmental protection and military develop, the output is expected to rise to 138kt and capac...
Global and China Natural Rubber Industry Report, 2017-2021
In 2016, the global natural rubber output edged up 1.1% year on year to 12.4 million tons, and the consumption rose by 3.8% year on year to 12.6 million tons, indicating the gap of 200,000 tons betwee...
China Synthetic Rubber Industry Report, 2017-2021
Synthetic rubber is one of important strategic materials, mainly used in tyres and other industries. In 2016, the global output and consumption of synthetic rubber reached 14.822 million tons and 14.9...
Global and China 1,4-butanediol (BDO) Industry Report, 2017-2021
1,4-butanediol (BDO) is a key raw material for organic and fine chemicals, capable of generating various derivatives like THF, PTMEG and GBL. BDO and its derivatives find wide application in PBT plast...
Global and China Ethylene Oxide (EO) Industry Report, 2017-2021
Ethylene oxide (EO) is one of the major derivatives of the ethylene industry. Featured with special reactivity, it can generate a series of fine chemical products for a wide range of applications.
In...