Global and China 1, 4-butanediol (BDO) Industry Report, 2019-2025
-
Jun.2019
- Hard Copy
- USD
$3,000
-
- Pages:102
- Single User License
(PDF Unprintable)
- USD
$2,800
-
- Code:
CYH088
- Enterprise-wide License
(PDF Printable & Editable)
- USD
$4,200
-
- Hard Copy + Single User License
- USD
$3,200
-
1,4-butanediol (BDO), an essential organic and fine chemical material, finds wide application in pharmaceuticals, chemicals, textile and household chemicals.
As of the end of 2018, the global BDO capacity reached approximately 4.3 million tons, of which about 53% came from Mainland China. World-renowned BDO manufacturers consist mainly of Taiwan-based Dairen Chemical Corporation (DCC), Germany-based BASF and U.S.-based LyondellBasell, the three of which hold a combined 38% of global capacity.
BDO capacities and technical expertise are largely controlled by BASF, U.S.-based ISP and Invista, U.K.-based Davy, Japan’s Mitsubishi Chemical, and DCC. Although with small BDO capacity, Invista, Mitsubishi Chemical and Davy boasting core production technologies and patents play an important role in the global BDO industry by technology transfer or other means.
There are now about 19 BDO producers in China with the total BDO capacity approximating 2.3 million tons (including discontinued facilities) or more. Being subject to the market demand and environmental campaigns across the country, some manufacturers have to suspend BDO facilities and the real utilization rate of facilities is rather low.
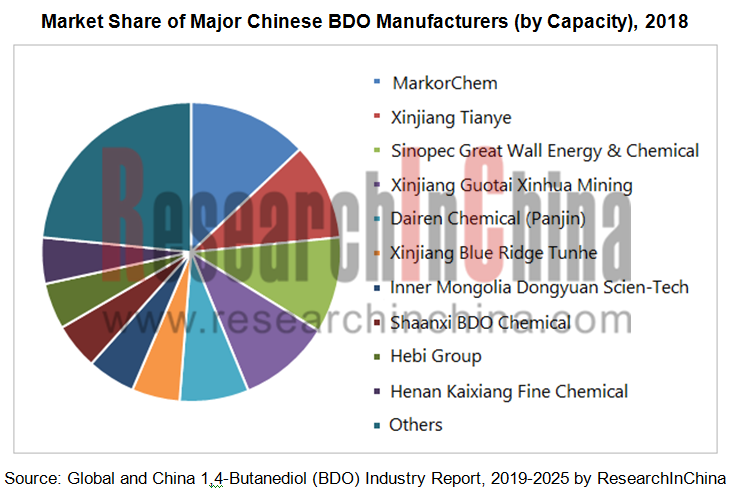
The top three BDO manufacturers in Mainland China -- Markor Chem, Xinjiang Tianye and Sinopec Great Wall Energy & Chemical contribute 33.8% to China's total BDO capacity. Among them, Markor Chem has the largest capacity of 260,000 tons/a, and it has built 50,000 tons/a PTMEG with the chemical giant BASF. Markor Chem possesses a spandex industry chain.
Affected by the environmental protection supervision of the central government, China's BDO demand growth rate has slowed down, reaching about 1.2 million tons in 2018, of which 50% was used for PTMEG and 32% for PBT. In the next few years, new or expanded capacity of BDO/PBT/PTMEG/GBL will continue to rise. China's BDO demand is expected to jump to 1.8 million tons in 2025.
Since 2018, Chinese BDO market has been declining, slumping by RMB3,300/ton from RMB11,800 / ton in 2018 to RMB8,500 / ton in March 2019 largely due to the worsening imbalance between supply and demand as well as the depressed demand from downstream areas. It is expected that the BDO price will continue to stay at the bottom for some time.
Global and China 1,4-Butanediol (BDO) Industry Report, 2019-2025 highlights the followings:
 Global BDO industry (supply and demand, competitive landscape, price trend, etc.);
China BDO industry (supply and demand, competitive landscape, import & export, price trend and development trend);
BDO downstream industries like PTMEG, PBT and GBL (supply and demand, competitive landscape, import and export, price trend, etc.);
13 global and Chinese BDO manufacturers (operation and BDO business) and progress of 16 Chinese Enterprises’ BDO projects.
1. Profile of BDO
1.1 Properties and Purposes
1.2 Process
2. Overview of Global BDO Industry
2.1 Status Quo
2.2 Market Size
2.2.1 Supply
2.2.2 Demand
2.3 Competitive Landscape
2.4 Price
3. Overview of China BDO Industry
3.1 Policy
3.2 Market Size
3.2.1 Supply
3.2.2 Demand
3.3 Competitive Landscape
3.4 Import & Export
3.5 Price
3.6 Development Trend
4. Status Quo of Upstream Sectors
4.1 Coal
4.1.1 Market Size
4.1.2 Structure
4.1.3 Price
4.1.4 Import & Export
4.2 Methanol
4.2.1 Industry Status
4.2.2 Competitive Pattern
4.2.3 Price
4.3 Calcium Carbide
5. Development of BDO Downstream Industry
5.1 THF/PTMEG
5.1.1 Market Size
5.1.2 Market Structure
5.1.3 Import & Export
5.1.4 Price
5.1.5 Competitive Pattern
5.2 PBT
5.2.1 Market Size
5.2.2 Market Structure
5.2.3 Import & Export
5.2.4 Price
5.2.5 Competitive Pattern
5.3 GBL
5.4 Others
6. Major Overseas BDO Manufacturers
6.1 BASF
6.1.1 Profile
6.1.2 Operation
6.1.3 BDO Business
6.1.4 Business in China
6.2 Dairen Chemical
6.2.1 Profile
6.2.2 BDO Business
6.2.3 Advantages and Outlook
6.3 LYONDELLBASELL
6.3.1 Profile
6.3.2 Operation
6.3.3 BDO Business
6.3.4 Business in China
6.4 Ashland
6.4.1 Profile
6.4.2 Operation
6.4.3 BDO Business
6.4.4 Business in China
6.5 Nan Ya Plastics
6.5.1 Profile
6.5.2 Operation
6.5.3 BDO Business
6.5.4 Outlook
7. Major BDO Manufacturers in Mainland China
7.1 Markor Chem
7.1.1 Profile
7.1.2 Operation
7.1.3 BDO Business
7.2 Shanxi Sanwei
7.2.1 Profile
7.2.2 Operation
7.2.3 BDO Business
7.2.4 Development Strategy
7.3 Sinopec Yizheng Chemical Fibre
7.3.1 Profile
7.3.2 BDO Business
7.4 Fujian Meizhouwan
7.4.1 Profile
7.4.2 BDO Business
7.5 Nanjing Bluestar
7.5.1 Profile
7.5.2 BDO Business
7.6 HNCC
7.6.1 Profile
7.6.2 BDO Business
7.7 Other Companies
7.7.1 Yunnan Yunwei
7.7.2 Shaanxi BDO
7.7.3 Sichuan Tianhua
7.7.4 Jianfeng Chemical
7.7.5 Guodian Younglight
7.7.6 Henan Kaixiang
7.7.7 Inner Mongolia Zhongyuan
7.7.8 Sinopec Sichuan Vinylon Works
7.7.9 Zhongjia Huachen Energy
7.7.10 Jiangshan Chemical
7.7.11 Xinjiang Tianye
7.7.12 Yanchang Petroleum
7.7.13 Hengyuan Coal Industry and Electricity Power
7.7.14 Shandong Weijiao
7.7.15 Shaanxi Ronghe Chemical
7.7.16 Xinjiang Blue Ridge Tunhe Chemical Industry Joint Stock
7.7.17 Xinjiang Guotai Xinhua Mining
1,4-butanediol (BDO) Industry Chain
Global BDO Capacity and Growth Rate, 2010-2025
Global BDO Demand and Growth Rate, 2010-2025
Capacity Share of Major BDO Manufacturers in the World, 2018
BDO Capacity and Growth Rate in China, 2010-2025
BDO Output and Operating Rate in China, 2010-2025
BDO Capacity Structure (by Production Process) in China, 2018
BDO Demand and Growth Rate in China, 2010-2025
BDO Downstream Consumption Structure in China, 2016/2025E
Competitive Pattern of China BDO Market, 2018
Import/Export Volume of Other Diols in China, 2009-2018
Average Import/Export Price of Other Diols in China, 2009-2018
Price Trend of BDO in China, 2018-2019
Distribution of Anthracite Reserves in China
Anthracite Output and YoY Growth in China, 2009-2018
Apparent Consumption of Anthracite in China, 2009-2018
Anthracite Output Structure in China by Region, 2018
Price Trend of Thermal Coal in China, 2018
Price Trend of Anthracite in China, 2018
Growth in Average Price of Anthracite in China, 2016-2018
Import Volume of Anthracite in China, 2009-2018
Export Volume of Anthracite in China, 2009-2018
Global Methanol Capacity Structure by Region, 2018
Methanol Capacity and Output in China, 2010-2018
Price Trend of Methanol in China, 2018-2019
Price Trend of Methanol in China, 2018
Calcium Carbide Capacity in China, 2005-2018
Calcium Carbide Output in China, 2011-2018
Apparent Consumption of Calcium Carbide in China, 2011-2018
Price Trend of Calcium Carbide in China, 2016-2018
Demand for PTMEG Used BDO in China, 2016-2025E
Global PTMEG Capacity, 2010-2025
Geographical Distribution of Global PTMEG Capacity, 2018
PTMEG Capacity in China, 2010-2025
PTMEG Output and Operating Rate in China, 2010-2025
PTMEG Apparent Consumption and Self-sufficiency Rate in China, 2010-2025
PTMEG Consumption Structure in China, 2018
PTMEG Import/Export Volume in China, 2008-2018
Average PTMEG Import/Export Price in China, 2008-2018
Distribution of PTMEG Import Sources (by Import Volume) in China, 2018
Distribution of PTMEG Export Destinations (by Export Volume) in China, 2018
Price Trend of PTMEG in China, 2010-2018 (Unit: t/a)
Capacity Share of Major PTMEG Manufacturers in the World, 2018
Demand for PBT Used OBD, 2010-2025E
Global PBT Capacity Structure by Region, 2018
PBT Output in China, 2010-2025E
PBT Demand in China, 2010-2025E
Global PBT Consumption Structure, 2018
PBT Demand Structure in China, 2018
PBT Import/Export Volume in China, 2008-2018
Average PBT Import/Export Price in China, 2008-2018
Price Trend of PBT in China, 2017-2018
Competitive Pattern of Global PBT Market, 2018
Global Presence of BASF
Sales and Net Income of BASF, 2009-2018
Sales Structure of BASF (by Division), 2018
Capacity of Main Products of BASF’s Chemicals Division, 2018
Sales and EBITDA of BASF’s Chemicals Division, 2015-2018
Sales Breakdown of BASF’s Chemical Division (by Product), 2015-2018
Intermediates Sales Structure of BASF (by Region), 2018
BASF’s Layout in China
BDO Industry Chain of Dairen Chemical
Revenue and Net Income of LYONDELLBASELL, 2011-2018
Revenue Structure of LYONDELLBASELL (by Division), 2014-2018
Revenue and Operating Income of Intermediate and Derivative Division of LYONDELLBASELL, 2011-2018
Revenue and Net Income of Ashland, FY2010-FY2018
Revenue Structure of Ashland (by Division), FY2011-FY2018
Revenue Structure of Ashland’s Performance Materials Division (by Market), 2018
Revenue Structure of Ashland’s Performance Materials Division (by Product), 2018
Revenue Structure of Ashland’s Performance Materials Division (by Region), 2018
Revenue and Net Income of Nan Ya Plastics, 2009-2018
Nan Ya Plastics’ Revenue from BDO and % of Total Revenue, 2009-2018
BDO Capacity and Output of Nan Ya Plastics, 2008-2018
BDO Sales Volume and Sales/Output Ratio of Nan Ya Plastics, 2009-2018
Proportion of BDO Self-used Volume and External Sales Volume in Total Sales Volume of Nan Ya Plastics, 2011-2018
Revenue of Markor Chem, 2012-2018
BDP Process of Markor Chem
Revenue and Net Income of Shanxi Sanwei, 2009-2018
Revenue Structure of Shanxi Sanwei (by Product), 20124-2018H1
Revenue Structure of Shanxi Sanwei (by Region), 2012-2017
Capacity of BDO and Downstream Products of Shanxi Sanwei, 2018
Revenue and Net Income of Yunnan Yunwei, 2009-2018
Advantages and Disadvantages of BDO Production Process
Application of Global BDO Production Technology
Major BDO Manufacturers Worldwide and Their Capacity, 2018
BDO Anti-dumping Cases in China
BDO Manufacturers and Their Capacity in China, 2018
Major BDO Downstream Users, 2018
Ex-factory Prices of Major BDO Producers , 2018
New/Expanded Capacity of Chinese Methanol Companies, 2018
Capacity and Capacity Structure of Global Major Methanol Companies, 2018
Applications of BDO
Status Quo of Main BDO Downstream Industries in 2018
Technical Indicators of PBT Products
Capacity of Major PBT Producers in China, 2018
Major GBL Manufacturers and Their Capacity in China, 2018
Address, Capacity and Process of BDO Facilities of BASF, 2018
Main Products and Capacity of Dairen Chemical, 2018
Address and Capacity of BDO Plants of Dairen Chemical, 2018
Main Products and Capacity of Intermediate and Derivative Division of LYONDELLBASELL, 2018
Address, Capacity and Process of BDO Facilities of ISP, 2018
Main Products of Nan Ya Plastics
Nan Ya Plastics’ Revenue from Main Products and % of Total Revenue, 2018
BDO Capacity, Output, Sales Volume and Sales Price of Markor Chem, 2010-2018
Development Course of BDO Business of Shanxi Sanwei
Capacity of Main Products of Fujian Meizhouwan, 2018
Capacity of Main Products of Yunnan Yunwei, 2018
Global and China Synthetic Rubber Industry Report, 2021-2027
Synthetic rubber is a polymer product made of coal, petroleum and natural gas as main raw materials and polymerized with dienes and olefins as monomers, which is typically divided into general synthet...
Global and China Carbon Fiber Industry Report, 2021-2026
Carbon fiber is a kind of inorganic high performance fiber (with carbon content higher than 90%) converted from organic fiber through heat treatment. As a new material with good mechanical properties,...
Global and China Dissolving Pulp Industry Report, 2019-2025
In 2018, global dissolving pulp capacity outstripped 10 million tons and its output surged by 14.0% from a year ago to 7.07 million tons, roughly 70% of the capacity. China, as a key supplier of disso...
Global and China 1, 4-butanediol (BDO) Industry Report, 2019-2025
1,4-butanediol (BDO), an essential organic and fine chemical material, finds wide application in pharmaceuticals, chemicals, textile and household chemicals.
As of the end of 2018, the global BDO cap...
Global and China Carbon Fiber and CFRP Industry Report, 2019-2025
Among the world’s three major high performance fibers, carbon fiber features the highest strength and the highest specific modulus. It is widely used in such fields as aerospace, sports and leisure.
...
Global and China Natural Rubber Industry Report, 2019-2025
In 2018, global natural rubber industry continued remained at low ebb, as a result of economic fundamentals. Global natural rubber price presented a choppy downtrend and repeatedly hit a record low in...
Global and China Ultra High Molecular Weight Polyethylene (UHMWPE) Industry Report, 2019-2025
Ultra high molecular weight polyethylene (UHMWPE), a kind of linear polyethylene with relative molecular weight of above 1.5 million used as an engineering thermoplastic with excellent comprehensive p...
China Polyether Monomer Industry Report, 2019-2025
China has seen real estate boom and issued a raft of policies for continuous efforts in improving weak links in infrastructure sector over the years. Financial funds of RMB1,663.2 billion should be al...
Global and China Viscose Fiber Industry Report, 2019-2025
Over the recent years, the developed countries like the United States, Japan and EU members have withdrawn from the viscose fiber industry due to environmental factor and so forth, while the viscose f...
Global and China Synthetic Rubber (BR, SBR, EPR, IIR, NBR, Butadiene, Styrene, Rubber Additive) Industry Report, 2018-2023
In 2018, China boasted a total synthetic rubber capacity of roughly 6,667kt/a, including 130kt/a new effective capacity. Considering capacity adjustment, China’s capacity of seven synthetic rubbers (B...
Global and China Dissolving Pulp Industry Report, 2018-2022
With the commissioning of new dissolving pulp projects, the global dissolving pulp capacity had been up to about 8,000 kt by the end of 2017. It is worth noticing that the top six producers including ...
Global and China Carbon Fiber and CFRP Industry Report, 2018-2022
As a new generation of reinforced fiber boasting intrinsic properties of carbon material and excellent processability of textile fiber, carbon fiber is the one with the highest specific strength and s...
Global and China Ultra High Molecular Weight Polyethylene (UHMWPE) Industry Report, 2017-2021
Ultra High Molecular Weight Polyethylene (UHMWPE), a kind of linear polyethylene with relative molecular weight of above 1.5 million and an engineering thermoplastic with excellent comprehensive prope...
Global and China Aramid Fiber Industry Report, 2017-2021
Global aramid fiber output totaled 115kt with capacity utilization of 76.0% in 2016. As industries like environmental protection and military develop, the output is expected to rise to 138kt and capac...
Global and China Natural Rubber Industry Report, 2017-2021
In 2016, the global natural rubber output edged up 1.1% year on year to 12.4 million tons, and the consumption rose by 3.8% year on year to 12.6 million tons, indicating the gap of 200,000 tons betwee...
China Synthetic Rubber Industry Report, 2017-2021
Synthetic rubber is one of important strategic materials, mainly used in tyres and other industries. In 2016, the global output and consumption of synthetic rubber reached 14.822 million tons and 14.9...
Global and China 1,4-butanediol (BDO) Industry Report, 2017-2021
1,4-butanediol (BDO) is a key raw material for organic and fine chemicals, capable of generating various derivatives like THF, PTMEG and GBL. BDO and its derivatives find wide application in PBT plast...
Global and China Ethylene Oxide (EO) Industry Report, 2017-2021
Ethylene oxide (EO) is one of the major derivatives of the ethylene industry. Featured with special reactivity, it can generate a series of fine chemical products for a wide range of applications.
In...