China Lubricant Industry Report, 2013-2016
-
July 2014
- Hard Copy
- USD
$2,400
-
- Pages:105
- Single User License
(PDF Unprintable)
- USD
$2,250
-
- Code:
ZLC005
- Enterprise-wide License
(PDF Printable & Editable)
- USD
$3,400
-
- Hard Copy + Single User License
- USD
$2,600
-
Amid the slow growth of the global economy, although China's automobile output and ownership maintain rapid growth, the development of construction machinery manufacturing industry, transportation industry, construction industry and other industries slows down, which greatly depresses the boom of Chinese lubricant market. In 2013, China’s lubricant output and sales volume fell sharply, wherein the output plunged by 30.2% year on year to 5,896,900 tons.
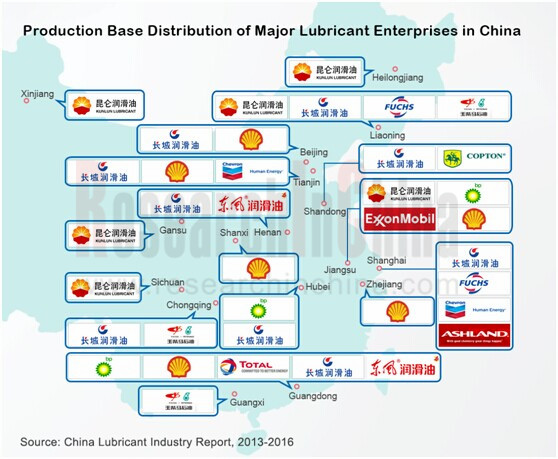
Affected by the distribution of resources, China lubricant industry is featured with apparent regional characteristics. Production areas mainly concentrate in East China, Northeast China and North China. In 2013, Liaoning, Shandong, Shanghai and Guangdong ranked the top four Chinese provinces by lubricant output. Particularly, Liaoning produced 1,391,100 tons, accounting for 23.8% of the national output.
By the end of 2013, there had been over 4,000 Chinese lubricant production enterprises. State-owned brands represented by Great Wall (Sinopec) and Kunlun (CNPC) as well as foreign brands including Shell, Mobil, BP, FUCHS and Total occupied most share of Chinese lubricant market. In 2013, Great Wall and Kunlun seized 51.2% market share together, while foreign companies grasped 29.9%.
At the same time, Chinese private lubricant companies also showed their strengths to take places in the fiercely competitive Chinese lubricant market, such as Delian Group, Tech petrochemical and Sure Energy Tech.
Delian Group has established long-term stable cooperative relations with upstream and downstream enterprises through “parts production bases near downstream vehicle plants”. Currently, the company has four bases in Changchun, Shanghai, Chengdu and Foshan, and has become the designated lubricant supplier of Shanghai Volkswagen, FAW-Volkswagen, Shanghai GM and many other well-known automakers.
Gaoke Petrochemical, one of important suppliers of transformer oil, serves XCMG, Qianjiang Electric, Shenda Electric and CNC Electric. Through the elimination of backward capacity, equipment modification, building of new plants and other measures, the company’s total lubricant capacity amounted to 121,600 tons at the end of 2013. But due to the decreasing demand for downstream transformers and other factors, the company’s capacity utilization rate was only 80.6% at that time.
The report highlights:
 Market supply & demand, competition pattern, import & export of China lubricant industry;
Market supply & demand, competition pattern, import & export of raw materials (base oil and additive) of China lubricant industry;
Status quo, policies and regulations, regeneration projects, supply and demand of China waste lubricant recycling market;
Operation and lubricant business of 8 global and 8 Chinese lubricant companies.
In recent years, China has attached more importance to the recycling of waste lubricant, and issued a series of favorable policies. However, China only recycles and reuses 6% -8% of lubricant. In theory, China's annual output of waste lubricant hit 3 million tons or more, embodying huge development potentials. At present, a number of waste lubricant regeneration projects are under construction or go into operation, such as Baosteel’s 7,000 t/a waste lubricant project, Fujian Sanming Steel’s waste lubricant regeneration project, Tangshan You Yi Sheng Xing's 60,000 t/a waste lubricant regeneration project.
1. Overview of Lubricant and Lubricant Base Oil
1.1 Definition of Lubricant
1.2 Major Lubricant
1.2.1 Internal Combustion Engine Oil
1.2.2 Gear Oil
1.2.3 Hydraulic Oil
2. Development of China Lubricant Market
2.1 International Market Environment
2.1.1 Overview
2.1.2 Crude Oil Market
2.2 Domestic Market Environment
2.2.1 Supply
2.2.2 Demand
2.2.3 Macroeconomic Environment
2.3 Import and Export
2.3.1 Import
2.3.2 Export
2.4 Competition Pattern
3. Overview of Chinese Lubricant Upstream Industries
3.1 Base Oil
3.1.1 Supply & Demand
3.1.2 Competition Pattern
3.1.3 Import & Export
3.2 Additive
4. Overview of Chinese Waste Lubricant Recovery Market
4.1 Policies and Regulations
4.2 Current Development
4.3 Regeneration Projects
4.4 Supply & Demand
5. Global Suppliers
5.1 Shell
5.1.1 Profile
5.1.2 Operation
5.1.3 Lubricant Business in China
5.1.4 Shell Tongyi
5.2 BP
5.2.1 Profile
5.2.2 Operation
5.2.3 BP Lubricant
5.2.4 Lubricant Business in China
5.3 ExxonMobil
5.3.1 Profile
5.3.2 Operation
5.3.3 Lubricant Business
5.3.4 Lubricant Business in China
5.4 Chevron
5.4.1 Profile
5.4.2 Operation
5.4.3 Lubricant Business in China
5.5 Total
5.5.1 Profile
5.5.2 Operation
5.5.3 Lubricant Business in China
5.6 FUCHS
5.6.1 Profile
5.6.2 Lubricant Business in China
5.7 ASHLAND
5.7.1 Profile
5.7.2 Operation
5.7.3 Lubricant Business in China
5.8 ConocoPhillips
5.8.1 Profile
5.8.2 Operation
5.8.3 Lubricant Business in China
6. Chinese Producers
6.1 CNPC
6.1.1 Profile
6.1.2 Operation
6.1.3 Revenue Structure
6.1.4 Gross Margin
6.1.5 Lubricant Business
6.1.6 Forecast and Outlook
6.2 Sinopec
6.2.1 Profile
6.2.2 Operation
6.2.3 Revenue Structure
6.2.4 Gross Margin
6.2.5 Lubricant Business
6.2.6 Forecast and Outlook
6.3 Delian Group
6.3.1 Profile
6.3.2 Operation
6.3.3 Revenue Structure
6.3.4 Gross Margin
6.3.5 Lubricant Business
6.3.6 R & D and Investment
6.3.7 Forecast and Outlook
6.4 Gaoke Petrochemical
6.4.1 Profile
6.4.2 Operation
6.4.3 Revenue Structure
6.4.4 Gross Margin
6.4.5 R & D
6.4.6 Capacity, Output and Sales Volume
6.4.7 Procurement
6.4.8 Forecast and Outlook
6.5 Copton
6.5.1 Profile
6.5.2 Operation
6.5.3 Revenue Structure
6.5.4 Gross Margin
6.5.5 R & D
6.5.6 Capacity, Output and Sales Volume
6.5.7 Supply and Marketing
6.5.8 Forecast and Outlook
6.6 Sure Energy Tech.
6.6.1 Profile
6.6.2 Operation
6.6.3 Gross Margin
6.6.4 Supply and Marketing
6.7 Other Enterprises
6.7.1 Lopal
6.7.2 Lidi
7 Forecast and Outlook
7.1 Prediction of Lubricant Output
7.2 Performance Comparison between Major Companies
7.2.1 Revenue
7.2.2 Net Income
7.2.3 Gross Margin
Classification Criteria of API-1509 Base Oil
Classification and Code of Q/SHR001-95 Lubricant Base Oil
Consumption Structure of Global Lubricant Market (by Application), 2013
Global Lubricant Demand and YoY Change, 2004-2013
Lubricant Demand Proportion in Major Regions of the World, 2013
Price Trend of Crude Oil Worldwide, 1990-2014E
Lubricant Output and YoY Growth Rate in China, 1990-2013
Output of Major Lubricant Producing Areas in China (by Province/Municipality), 2008-2013
Apparent Consumption of Lubricant and YoY Growth Rate in China, 2009-2013
China’s GDP and Growth Rate, 2003-2013
Engel Coefficient of Urban and Rural Households in China, 1980-2013
Lubricant Import Dependence and Self-sufficiency Rate in China, Jan.-Dec.2013
Lubricant Import Volume and YoY Growth in China, 2009-2013
Lubricant Import Value in China, 2009-2013
Top Five Import Countries (Regions) of China’s Lubricant, 2013
Lubricant Export Volume in China, 2009-2013
Lubricant Export Value in China, 2009-2013
Top Five Export Destinations of China’s Lubricant, 2013
China's Lubricant Market Share, 2013
Capacity of Major Lubricant Enterprises in China, 2013
Prefilled Lubricant & 4S After-service Lubricant Brands of Some Automobile Companies in China
Proportion of Base Oil Types Worldwide (by Capacity), 2013
China's Top 10 Base Oil Import Sources (by Import Volume), 2013
China's Top 10 Base Oil Export Destinations (by Export Volume), 2013
China’s Lubricant Additive Consumption Structure (by Application)
China’s Lubricant Additive Import Volume and Value, 2013
China’s Lubricant Additive Export Volume and Value, 2013
China’s Top 10 Lubricant Additive Export Destinations and Export Volume, 2013
Relevant Policies on Waste Lubricant Recycling and Utilization in China
China’s Theoretical Waste Lubricant Supply, 2009-2013
Shell’s Revenue and Net Income, 2011-2013
Shell’s Lubricant Brands and Average Price, 2012-2013
Tongyi’s Lubricant Brands and Average Price, 2012-2013
BP’s Revenue and Net Income, 2011-2013
Castrol’s Lubricant EBIT, 2011-2013
Castrol’s Main Automotive Lubricant Products and Average Price, 2012-2013
Major Industrial Lubricant Brands and Average Price of Castrol and BP, 2012-2013
Exxon Mobil’s Revenue and Net Income, 2009-2013
Exxon Mobil’s Lubricant Applications and Products
Mobil’s Lubricant Brands and Average Price, 2012-2013
Chevron’s Revenue and Net Income, 2009-2013
Lubricant Product Series of Chevron Caltex
Chevron’s Lubricant Brands and Average Price, 2012-2013
Total’s Revenue and Net Income, 2009-2013
Total’s Lubricant Brands and Average Price, 2012-2013
Development Course of FUCHS in China
Lubricant Product Structure of FUCHS (China)
Some Lubricant Downstream Customers of FUCHS
Lubricant Brands and Average Price of FUCHS, 2012-2013
Ashland’s Revenue and Net Income, 2009-2013
Valvoline’s Major Lubricant Brands and Average Price, 2012-2013
Revenue and Net Income of ConocoPhillips, 2009-2013
Major Lubricant Products and Average Price of ConocoPhillips, 2012-2013
PetroChina’s Revenue and Net Income, 2009-2013
PetroChina’s Revenue (by Region), 2009-2013
PetroChina’s Revenue Structure (by Region), 2009-2013
PetroChina’s Gross Margin, 2009-2013
PetroChina’s Gross Margin (by Business), 2009-2013
PetroChina’s Lubricant Sales Volume and Average Price, 2009-2013
PetroChina’s Revenue and Net Income, 2012-2016E
Sinopec’s Revenue and Net Income, 2009-2013
Sinopec’s Revenue (by Business), 2009-2013
Sinopec’s Revenue Structure (by Business), 2009-2013
Sinopec’s Gross Margin, 2009-2013
Sinopec’s Gross Margin (by Business), 2009-2013
Great Wall's Lubricant Product Series and Applications
Sinopec’s Revenue and Net Income, 2012-2016E
Delian Group’s Service Brands
Delian Group’s Revenue and Net Income, 2009-2013
Delian Group’s Revenue (by Region), 2009-2013
Delian Group’s Revenue Structure (by Region), 2009-2013
Delian Group’s Gross Margin, 2009-2013
Delian Group’s Lubricant Product Revenue and % of Total Revenue, 2009-2012
Delian Group’s R & D Costs and % of Total Revenue, 2012-2013
Distribution of Delian Group’s Parts Production Bases near Downstream Vehicle Plants
Delian Group’s Revenue and Net Income, 2012-2016E
Gaoke Petrochemical’s Revenue and Net Income, 2009-2013
Gaoke Petrochemical’s Revenue (by Product), 2011-2013
Gaoke Petrochemical’s Revenue (by Region), 2011-2013
Gaoke Petrochemical’s Revenue Structure (by Product), 2011-2013
Gaoke Petrochemical’s Revenue Structure (by Region), 2011-2013
Gaoke Petrochemical’s Gross Margin, 2009-2013
Gaoke Petrochemical’s Gross Margin (by Product), 2009-2013
Gaoke Petrochemical’s R & D Costs and % of Total Revenue, 2011-2013
Gaoke Petrochemical’s Capacity and Output, 2011-2013
Gaoke Petrochemical’s Output and Sales Volume (by Product), 2011-2013
Gaoke Petrochemical’s Base Oil Procurement, 2011-2013
Gaoke Petrochemical’s Revenue and Net Income, 2012-2016E
Copton’s Revenue and Net Income, 2011-2013
Copton’s Revenue (by Product), 2011-2013
Copton’s Revenue (by Region), 2011-2013
Copton’s Revenue Structure (by Product), 2011-2013
Copton’s Revenue Structure (by Region), 2011-2013
Copton’s Gross Margin, 2011-2013
Copton’s Gross Margin (by Product), 2011-2013
Copton’s R & D Costs and % of Total Revenue, 2011-2013
Copton’s Capacity, Output and Sales Volume (by Product), 2011-2013
Copton’s Top Five Suppliers, 2011-2013
Copton’s Top Five Clients, 2011-2013
Copton’s Revenue and Net Income, 2012-2016E
Revenue and Net Income of Sure Energy, 2010-2013
Gross Margin of Sure Energy, 2010-2013
Top Five Suppliers and Procurement of Sure Energy, 2010-2012
Top Five Clients of Sure Energy, 2010-2012
China’s Lubricant Output, 2012-2016E
Revenue of Major Companies in China Lubricant Industry, 2009-2013
Net Income of Major Companies in China Lubricant Industry, 2009-2013
Net Profit Margin of Major Companies in China Lubricant Industry, 2009-2013
Gross Margin of Major Companies in China Lubricant Industry, 2009-2013
Global and China Synthetic Rubber Industry Report, 2021-2027
Synthetic rubber is a polymer product made of coal, petroleum and natural gas as main raw materials and polymerized with dienes and olefins as monomers, which is typically divided into general synthet...
Global and China Carbon Fiber Industry Report, 2021-2026
Carbon fiber is a kind of inorganic high performance fiber (with carbon content higher than 90%) converted from organic fiber through heat treatment. As a new material with good mechanical properties,...
Global and China Dissolving Pulp Industry Report, 2019-2025
In 2018, global dissolving pulp capacity outstripped 10 million tons and its output surged by 14.0% from a year ago to 7.07 million tons, roughly 70% of the capacity. China, as a key supplier of disso...
Global and China 1, 4-butanediol (BDO) Industry Report, 2019-2025
1,4-butanediol (BDO), an essential organic and fine chemical material, finds wide application in pharmaceuticals, chemicals, textile and household chemicals.
As of the end of 2018, the global BDO cap...
Global and China Carbon Fiber and CFRP Industry Report, 2019-2025
Among the world’s three major high performance fibers, carbon fiber features the highest strength and the highest specific modulus. It is widely used in such fields as aerospace, sports and leisure.
...
Global and China Natural Rubber Industry Report, 2019-2025
In 2018, global natural rubber industry continued remained at low ebb, as a result of economic fundamentals. Global natural rubber price presented a choppy downtrend and repeatedly hit a record low in...
Global and China Ultra High Molecular Weight Polyethylene (UHMWPE) Industry Report, 2019-2025
Ultra high molecular weight polyethylene (UHMWPE), a kind of linear polyethylene with relative molecular weight of above 1.5 million used as an engineering thermoplastic with excellent comprehensive p...
China Polyether Monomer Industry Report, 2019-2025
China has seen real estate boom and issued a raft of policies for continuous efforts in improving weak links in infrastructure sector over the years. Financial funds of RMB1,663.2 billion should be al...
Global and China Viscose Fiber Industry Report, 2019-2025
Over the recent years, the developed countries like the United States, Japan and EU members have withdrawn from the viscose fiber industry due to environmental factor and so forth, while the viscose f...
Global and China Synthetic Rubber (BR, SBR, EPR, IIR, NBR, Butadiene, Styrene, Rubber Additive) Industry Report, 2018-2023
In 2018, China boasted a total synthetic rubber capacity of roughly 6,667kt/a, including 130kt/a new effective capacity. Considering capacity adjustment, China’s capacity of seven synthetic rubbers (B...
Global and China Dissolving Pulp Industry Report, 2018-2022
With the commissioning of new dissolving pulp projects, the global dissolving pulp capacity had been up to about 8,000 kt by the end of 2017. It is worth noticing that the top six producers including ...
Global and China Carbon Fiber and CFRP Industry Report, 2018-2022
As a new generation of reinforced fiber boasting intrinsic properties of carbon material and excellent processability of textile fiber, carbon fiber is the one with the highest specific strength and s...
Global and China Ultra High Molecular Weight Polyethylene (UHMWPE) Industry Report, 2017-2021
Ultra High Molecular Weight Polyethylene (UHMWPE), a kind of linear polyethylene with relative molecular weight of above 1.5 million and an engineering thermoplastic with excellent comprehensive prope...
Global and China Aramid Fiber Industry Report, 2017-2021
Global aramid fiber output totaled 115kt with capacity utilization of 76.0% in 2016. As industries like environmental protection and military develop, the output is expected to rise to 138kt and capac...
Global and China Natural Rubber Industry Report, 2017-2021
In 2016, the global natural rubber output edged up 1.1% year on year to 12.4 million tons, and the consumption rose by 3.8% year on year to 12.6 million tons, indicating the gap of 200,000 tons betwee...
China Synthetic Rubber Industry Report, 2017-2021
Synthetic rubber is one of important strategic materials, mainly used in tyres and other industries. In 2016, the global output and consumption of synthetic rubber reached 14.822 million tons and 14.9...
Global and China 1,4-butanediol (BDO) Industry Report, 2017-2021
1,4-butanediol (BDO) is a key raw material for organic and fine chemicals, capable of generating various derivatives like THF, PTMEG and GBL. BDO and its derivatives find wide application in PBT plast...
Global and China Ethylene Oxide (EO) Industry Report, 2017-2021
Ethylene oxide (EO) is one of the major derivatives of the ethylene industry. Featured with special reactivity, it can generate a series of fine chemical products for a wide range of applications.
In...