Global and China Non-ionic Cellulose Ether Industry Report, 2014-2016
-
Aug.2014
- Hard Copy
- USD
$2,150
-
- Pages:87
- Single User License
(PDF Unprintable)
- USD
$2,000
-
- Code:
LT021
- Enterprise-wide License
(PDF Printable & Editable)
- USD
$3,100
-
- Hard Copy + Single User License
- USD
$2,350
-
The global non-ionic cellulose ether production is dominated by the United States, Japan and other developed countries, especially Dow Chemical, Ashland and ShinEtsu master about 75% of methylcellulose (MC) and hydroxypropyl methyl cellulose (HPMC) market.
In 2006-2013, the global non-ionic cellulose ether capacity grew steadily at a CAGR of 8.69%, reaching 491,000 tons in 2013. In recent years, the momentum of global cellulose ether capacity growth mainly comes from the Asian market, particularly China. In 2013, China’s non-ionic cellulose ether capacity and output hit 195,000 tons and 154,000 tons respectively, of which, the MC/HPMC output approximated 133,000 tons.
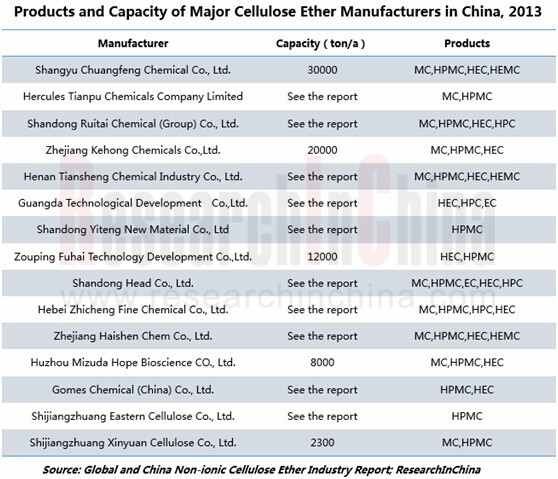
In the United States, Western Europe and Japan, the profit of cellulose ether business is usually lower than economic benefits of reinvestment, and new factories are uncompetitive. However, the investment in the promising Chinese market is relatively low. As of the end of 2013, 10 Chinese non-ionic cellulose ether companies with the respective capacity of more than 10,000 tons had contributed 87.4% to the total non-ionic cellulose ether capacity in China; wherein, Shangyu Chuangfeng Chemical Co., Ltd. ranked first with 30,000 tons/a.
Judging from the downstream demand, the demand for building materials-use cellulose ether is the largest. In 2013, China’s non-ionic cellulose ether consumption amounted to 132,000 tons or so, of which building materials-use cellulose ether made 114,000 tons, accounting for 86.4% of the total consumption.
China’s construction industry will return to a rational and healthy development track under strict government control policies, still accompanied by a steady increase in the demand for building materials-use cellulose ether. It is expected that the Chinese non-ionic cellulose ether market size will attain RMB5.2 billion, and the consumption 160,000 tons in 2016.
?
Global and China Non-ionic Cellulose Ether Industry Report, 2014-2016 by ResearchInChina mainly sheds light on the followings:
● Overview of the global non-ionic cellulose ether industry (including market size, market supply and demand, etc.);
● Development environment for China non-ionic cellulose ether industry (involving raw material market, policies, etc.);
● Size and forecast for the next three years, competitive landscape (capacity of top 15 companies), supply and demand, import and export of China non-ionic cellulose ether market;
● Market capacity, etc. of China non-ionic cellulose ether application industries (including building materials, pharmaceuticals, food additives, etc.);
● Operation, non-ionic cellulose ether business, etc. of international benchmarking enterprises such as ShinEtsu, Ashland and Dow Chemical;
● Operation, non-ionic cellulose ether business, etc. of 18 domestic non-ionic cellulose ether enterprises e.g. Shangyu Chuangfeng Chemical, Hercules Tianpu Chemicals, Shandong Ruitai Chemical, Shandong Head.
1 Introduction to Non-ionic Cellulose Ether
1.1 Definition and Classification
1.2 Upstream and Downstream Industry Chain
2 Development Environment for China Non-ionic Cellulose Ether industry
2.1 Raw Material Market
2.1.1 Refined Cotton
2.1.2 Propylene Oxide
2.1.3 Caustic Soda
2.2 Policy
3 Global Non-ionic Cellulose Ether Market
3.1 Market Size
3.2 Supply and Demand
3.3 International Benchmarking Enterprises
3.1.1 ShinEtsu
3.1.2 Ashland
3.1.3 Dow Chemical
4 China Non-ionic Cellulose Ether Market
4.1 Development
4.2 Supply
4.3 Demand
4.4 Competition Pattern
4.5 Import and Export
4.5.1 Import
4.5.2 Export
5 Demand of China Non-ionic Cellulose Ether Application Industry
5.1 Building Materials
5.2 Pharmaceuticals
5.3 Food Additives
6 Key Enterprises in China
6.1 Shandong Head
6.1.1 Profile
6.1.2 Operation
6.1.3 Revenue Structure
6.1.4 Gross Margin
6.1.5 Clients and Suppliers
6.1.6 R&D
6.1.7 Non-ionic Cellulose Ether Business
6.1.8 Prospects
6.2 Shandong Yiteng New Material
6.2.1 Profile
6.2.2 Operation
6.2.3 Revenue Structure
6.2.4 Gross Margin
6.2.5 Clients and Suppliers
6.2.6 Cellulose Ether Business
6.2.7 Prospects
6.3 Shandong Ruitai Chemical
6.3.1 Profile
6.3.2 Operation
6.3.3 Revenue Structure
6.3.4 Clients and Suppliers
6.3.5 Non-ionic Cellulose Ether Business
6.4 Gomez Chemical (China)
6.4.1 Profile
6.4.2 Capacity
6.5 Henan Tiansheng Chemical Industry
6.5.1 Profile
6.5.2 Non-ionic Cellulose Ether Business
6.6 Shandong Guangda Technology Development
6.6.1 Profile
6.6.2 Capacity
6.7 Zouping Fuhai Technology Development
6.7.1 Profile
6.7.2 Capacity
6.8 Zhejiang Kehong Chemical
6.8.1 Profile
6.8.2 Capacity
6.9 Huzhou Mizuda Hope Bioscience
6.9.1 Profile
6.9.2 Capacity
6.10 Zhejiang Haishen Chem.
6.10.1 Profile
6.10.2 Non-ionic Cellulose Ether Business
6.11 Shangyu Chuangfeng Chemical
6.11.1 Profile
6.11.2 Non-ionic Cellulose Ether Business
6.12 Shandong Ningjin Dexin Cellulose
6.13 Shandong Sainuo Cellulose
6.14 Shijiazhuang Xinyuan Cellulose
6.15 Shijiazhuang Ruixin Cellulose
6.16 Shijiazhuang Chenxun Cellulose
6.17 Shijiazhuang Eastern Cellulose
6.18 Hebei Zhicheng Fine Chemical
7 Summary and Forecast
7.1 Summary
7.2 Forecast
Classification of Non-ionic Cellulose Ether
China’s Non-ionic Cellulose Ether Raw Material Cost Structure, 2013
China’s Lint Refined Cotton Output, 2007-2012
China’s Cotton Linter Spot Price, 2010-2014
China’s Propylene Oxide Output, 2007-2013
Capacity of Major Propylene Oxide Enterprises in China, 2012
China’s Propylene Oxide Price, Jan-Jul 2014
China’s Caustic Soda Output and Growth Rate, 2005-2012
China’s Caustic Soda Apparent Consumption and Growth Rate, 2005-2012
China’s Caustic Soda Self-sufficiency Rate, 2005-2012
China’s 32% Ionic Membrane Caustic Soda Price, 2010-2013
China’s Non-ionic Cellulose Ether Policies, 2008-2012
Global Non-ionic Cellulose Ether Market Size, 2006-2013
Global Non-ionic Cellulose Ether Capacity, 2006-2013
Global Non-ionic Cellulose Ether Consumption (by Product), 2006-2013
ShinEtsu’s Revenue and Net Income, FY2010-FY2014
ShinEtsu’s Revenue Structure (by Product), FY2011-FY2014
ShinEtsu’s Revenue Breakdown (by Region), FY2011-FY2014
ShinEtsu’s R&D Costs and % of Total Revenue, FY2010-FY2014
Capacity of ShinEtsu’s Main Non-ionic Cellulose Ether Products, 2006-2013
Ashland’s Revenue and Net Income, 2009-2013
Ashland’s Special Additive Revenue Structure (by Industry), 2013
Ashland’s Special Additive Revenue Structure (by Product), 2013
Ashland’s Special Additive Revenue Structure (by Region), 2013
Ashland’s R&D Costs and % of Total Revenue, 2009-2013
Ashland’s Cellulose Product Sales, 2011-2013
Revenue and Net Income of Dow Chemical, 2009-2013
Revenue of Dow Chemical (by Division), 2013
R&D Costs and % of Total Revenue of Dow Chemical, 2009-2013
Main METHOCELTM Cellulose Ether Products of Dow Chemical
China's Non-ionic Cellulose Ether Market Size, 2006-2013
China's Non-ionic Cellulose Ether Capacity, 2006-2013
China's MC/HPMC Capacity, 2006-2013
China's Capacity of HEC and Its Derivatives, 2006-2013
China's Non-ionic Cellulose Ether Output, 2006-2013
China's Non-ionic Cellulose Ether Output Structure (by Product), 2006-2013
China's Non-ionic Cellulose Ether Consumption, 2006-2013
China's Non-ionic Cellulose Ether Demand Structure (by Product), 2013
China's Non-ionic Cellulose Ether Demand Structure (by Industry), 2013
Capacity of Major Non-ionic Cellulose Ether Manufacturers in China, 2013
China’s Non-ionic Cellulose Ether Import Volume and Value, 2011-2014
China’s Top 20 Import Sources of Non-ionic Cellulose Ether by Import Volume, H1 2014
China’s Non-ionic Cellulose Ether Export Volume and Value, 2011-2014
China’s Top 20 Export Destinations of Non-ionic Cellulose Ether by Export Volume, H1 2014
China’s Housing Construction Area and Completed Area, 2008-2013
China’s Output of Cement and Commercial Concrete, 2007-2013
China’s Demand for Building Materials Grade Cellulose Ether, 2009-2016E
China’s Pharmaceutical Adjuvant Market Size, 2008-2012
China’s Demand for Pharmaceutical Grade Cellulose Ether, 2009-2016E
China’s Food Additive Output, 2006-2011
Revenue and Net Income of Shandong Head, 2011-2013
Cellulose Ether Revenue Structure of Shandong Head (by Type), 2011-2013
Revenue Structure of Shandong Head (by Region), 2011-2013
Cellulose Ether Gross Margin of Shandong Head (by Type), 2011-2013
Shandong Head’s Combined Procurement from Top 5 Suppliers and % of Total Procurement, 2011-2013
Shandong Head’s Procurement from Top 5 Suppliers and % of Total Procurement, 2013
Shandong Head’s Combined Revenue from Top 5 Clients and % of Total Revenue, 2011-2013
Shandong Head’s Revenue from Top 5 Clients and % of Total Revenue, 2013
R&D Costs and % of Total Revenue of Shandong Head, 2011-2013
Cellulose Ether Revenue of Shandong Head (by Type), 2011-2013
Building Materials Grade Cellulose Ether Output, Sales Volume and ASP of Shandong Head, 2011-2013
Building Materials Grade Cellulose Ether Sales Volume of Shandong Head (by Channel), 2011-2013
Food and Pharmaceutical Grade Cellulose Ether Output, Sales Volume and ASP of Shandong Head, 2011-2013
Food and Pharmaceutical Grade Cellulose Ether Sales Volume of Shandong Head (by Channel), 2011-2013
Revenue and Net Income of Shandong Head, 2013-2016E
Revenue and Net Income of Yiteng New Material, 2011-2013
Revenue Structure of Yiteng New Material (by Product), 2011-2013
Revenue Structure of Yiteng New Material (by Region), 2011-2013
Gross Margin of Yiteng New Material (by Product), 2011-2013
Yiteng New Material’s Combined Procurement from Top 5 Suppliers and % of Total Procurement, 2011-2013
Yiteng New Material’s Procurement from Top 5 Suppliers and % of Total Procurement, 2013
Yiteng New Material’s Combined Revenue from Top 5 Clients and % of Total Revenue, 2011-2013
Yiteng New Material’s Revenue from Top 5 Clients and % of Total Revenue, 2013
Number of Clients (by Type) of Yiteng New Material, 2011-2013
Client Distribution of Yiteng New Material, 2011-2013
HPMC Output, Sales Volume and ASP of Yiteng New Material, 2011-2013
PAC Output, Sales Volume and ASP of Yiteng New Material, 2011-2013
HPMC Sales Volume (from New Clients) and % of Yiteng New Material, 2011-2013
PAC Sales Volume (from Major Clients) of Yiteng New Material, 2011-2013
Sales Volume of Yiteng New Material (by Region), 2011-2013
Revenue and Net Income of Yiteng New Material, 2013-2016E
Revenue and Net Income of Ruitai Chemical, 2007-2011
Revenue Structure of Ruitai Chemical (by Product), 2007-2009
Revenue Structure of Ruitai Chemical (by Region), 2007-2009
Ruitai Chemical’s Procurement from Top 5 Suppliers and % of Total Procurement, 2007-2009
Ruitai Chemical’s Combined Revenue from Top 3 Clients and % of Total Revenue, 2007-2009
Non-ionic Cellulose Ether Revenue of Ruitai Chemical (by Product), 2007-2009
Sales Network of Gomez Chemical (China)
Sales Network of Shandong Guangda Technology Development
Sales Network of Zouping Fuhai Technology Development
Sales Network of Zhejiang Haishen Chem.
Sales Network of Shandong Sainuo Cellulose
Sales Network Shijiazhuang Ruixin Cellulose
China’s Non-ionic Cellulose Ether Consumption, 2013-2016E
Non-ionic Cellulose Ether Market Size, 2006-2016E
Global and China Synthetic Rubber Industry Report, 2021-2027
Synthetic rubber is a polymer product made of coal, petroleum and natural gas as main raw materials and polymerized with dienes and olefins as monomers, which is typically divided into general synthet...
Global and China Carbon Fiber Industry Report, 2021-2026
Carbon fiber is a kind of inorganic high performance fiber (with carbon content higher than 90%) converted from organic fiber through heat treatment. As a new material with good mechanical properties,...
Global and China Dissolving Pulp Industry Report, 2019-2025
In 2018, global dissolving pulp capacity outstripped 10 million tons and its output surged by 14.0% from a year ago to 7.07 million tons, roughly 70% of the capacity. China, as a key supplier of disso...
Global and China 1, 4-butanediol (BDO) Industry Report, 2019-2025
1,4-butanediol (BDO), an essential organic and fine chemical material, finds wide application in pharmaceuticals, chemicals, textile and household chemicals.
As of the end of 2018, the global BDO cap...
Global and China Carbon Fiber and CFRP Industry Report, 2019-2025
Among the world’s three major high performance fibers, carbon fiber features the highest strength and the highest specific modulus. It is widely used in such fields as aerospace, sports and leisure.
...
Global and China Natural Rubber Industry Report, 2019-2025
In 2018, global natural rubber industry continued remained at low ebb, as a result of economic fundamentals. Global natural rubber price presented a choppy downtrend and repeatedly hit a record low in...
Global and China Ultra High Molecular Weight Polyethylene (UHMWPE) Industry Report, 2019-2025
Ultra high molecular weight polyethylene (UHMWPE), a kind of linear polyethylene with relative molecular weight of above 1.5 million used as an engineering thermoplastic with excellent comprehensive p...
China Polyether Monomer Industry Report, 2019-2025
China has seen real estate boom and issued a raft of policies for continuous efforts in improving weak links in infrastructure sector over the years. Financial funds of RMB1,663.2 billion should be al...
Global and China Viscose Fiber Industry Report, 2019-2025
Over the recent years, the developed countries like the United States, Japan and EU members have withdrawn from the viscose fiber industry due to environmental factor and so forth, while the viscose f...
Global and China Synthetic Rubber (BR, SBR, EPR, IIR, NBR, Butadiene, Styrene, Rubber Additive) Industry Report, 2018-2023
In 2018, China boasted a total synthetic rubber capacity of roughly 6,667kt/a, including 130kt/a new effective capacity. Considering capacity adjustment, China’s capacity of seven synthetic rubbers (B...
Global and China Dissolving Pulp Industry Report, 2018-2022
With the commissioning of new dissolving pulp projects, the global dissolving pulp capacity had been up to about 8,000 kt by the end of 2017. It is worth noticing that the top six producers including ...
Global and China Carbon Fiber and CFRP Industry Report, 2018-2022
As a new generation of reinforced fiber boasting intrinsic properties of carbon material and excellent processability of textile fiber, carbon fiber is the one with the highest specific strength and s...
Global and China Ultra High Molecular Weight Polyethylene (UHMWPE) Industry Report, 2017-2021
Ultra High Molecular Weight Polyethylene (UHMWPE), a kind of linear polyethylene with relative molecular weight of above 1.5 million and an engineering thermoplastic with excellent comprehensive prope...
Global and China Aramid Fiber Industry Report, 2017-2021
Global aramid fiber output totaled 115kt with capacity utilization of 76.0% in 2016. As industries like environmental protection and military develop, the output is expected to rise to 138kt and capac...
Global and China Natural Rubber Industry Report, 2017-2021
In 2016, the global natural rubber output edged up 1.1% year on year to 12.4 million tons, and the consumption rose by 3.8% year on year to 12.6 million tons, indicating the gap of 200,000 tons betwee...
China Synthetic Rubber Industry Report, 2017-2021
Synthetic rubber is one of important strategic materials, mainly used in tyres and other industries. In 2016, the global output and consumption of synthetic rubber reached 14.822 million tons and 14.9...
Global and China 1,4-butanediol (BDO) Industry Report, 2017-2021
1,4-butanediol (BDO) is a key raw material for organic and fine chemicals, capable of generating various derivatives like THF, PTMEG and GBL. BDO and its derivatives find wide application in PBT plast...
Global and China Ethylene Oxide (EO) Industry Report, 2017-2021
Ethylene oxide (EO) is one of the major derivatives of the ethylene industry. Featured with special reactivity, it can generate a series of fine chemical products for a wide range of applications.
In...