Global and China 1,4-Butanediol (BDO) Industry Report, 2014-2017
-
Oct.2014
- Hard Copy
- USD
$2,500
-
- Pages:100
- Single User License
(PDF Unprintable)
- USD
$2,350
-
- Code:
HK050
- Enterprise-wide License
(PDF Printable & Editable)
- USD
$3,600
-
- Hard Copy + Single User License
- USD
$2,700
-
As an important organic and fine chemical, 1,4-butanediol (BDO) is widely used in pharmaceutical, chemical, textile and household chemical fields.
By the end of September 2014, the BDO capacity worldwide topped around 3.35 million tons, of which about 48% came from Mainland China. Global BDO manufacturers mainly include Taiwan-based Dairen Chemical Corporation (DCC), Germany-based BASF and U.S.-based LyondellBasell, combining 38.5% of total worldwide capacity.
The BDO production process on a global scale is dominated by BASF, U.S.-based ISP and Invista, U.K.-based Davy, Japan’s Mitsubishi Chemical, and DCC. In spite of relatively small BDO capacity, Invista, Mitsubishi Chemical and Davy with core production technologies and patents are playing an important role in the global BDO industry by technology transfer or other means.
During 2009-2011, the BDO industry in China faced a tight supply, the rising BDO price drove a large number of enterprises to add or expand capacity projects, which gave rise to the BDO capacity swelling. By the end of September 2014, China’s BDO capacity has been around 1.616 million tons, while the severe overcapacity was accompanied by an operating rate (regarding to BDO facilities) of merely 30% or so.
At present, the BDO in Mainland China is mostly manufactured via reppe process and maleic anhydride process, of which maleic anhydride-process BDO makes up roughly 27.5% of capacity. From 2012 onward, due to the stubbornly high price of maleic anhydride, maleic anhydride-process BDO facilities were in the red, basically shut down. While reppe-process BDO facilities are in relatively steady operation, but the profit margin thereof has been sharply reduced.
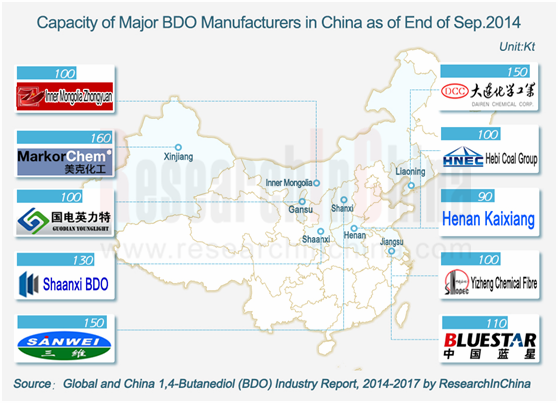
In the next few years, more new BDO capacities were to be built in Mainland China as it is planned, totaling 1.4 million tons or so, however, against the excess capacity and the sluggish market demand, some projects will probably be put aside or cancelled, and the growth rate of BDO capacity will slacken. In the meantime, the concentration of China’s BDO industry is expected to increase step by step. Mainstream manufacturers such as Markor Chem and Shanxi Sanwei will continue to expand their BDO capacities and the BDO facilities of some small producers will be gradually eliminated under cost pressure.
Up to the end of September 2014, the top 3 BDO manufacturers in Mainland China were Markor Chem, Shanxi Sanwei and Chang Chun Dairen Chemical (PANJIN), respectively featuring capacity of 160,000 tons, 150,000 tons and 150,000 tons.
Global and China 1,4-Butanediol (BDO) Industry Report, 2014-2017 by ResearchInChina mainly highlights the followings:
 Supply & demand, competitive landscape, price trend, etc. of global BDO industry;
Supply & demand, competitive landscape, import & export, price trend and development forecast (2014-2017) of the BDO industry in China;
Supply & demand, competitive landscape, import & export, price trend, etc. of BDO downstream industries such as PTMEG, PBT, GBL, etc. at home and abroad;
Operation and BDO business of 13 BDO manufacturers in the world and China and progress of BDO projects of 16 Chinese enterprises.
1 Profile of BDO
1.1 Properties and Purposes
1.2 Process
2 Overview of Global BDO Industry
2.1 Status Quo
2.2 Supply
2.3 Demand
2.4 Competitive Landscape
2.5 Price
3 Overview of China BDO Industry
3.1 Policy
3.2 Supply
3.3 Demand
3.4 Competitive Landscape
3.5 Import & Export
3.6 Price
4 Development of BDO Downstream Industry
4.1 THF/PTMEG
4.1.1 World
4.1.2 China
4.2 PBT
4.2.1 World
4.2.2 China
4.3 GBL
4.3.1 World
4.3.2 China
4.4 Others
5 Major Overseas BDO Manufacturers
5.1 BASF
5.1.1 Profile
5.1.2 Operation
5.1.3 Operation of Chemical Division
5.1.4 Revenue Structure of Chemical Division
5.1.5 BDO Business
5.1.6 Business in China
5.2 Dairen Chemical
5.2.1 Profile
5.2.2 BDO Business
5.2.3 Advantages and Outlook
5.3 LYONDELLBASELL
5.3.1 Profile
5.3.2 Operation
5.3.3 BDO Business
5.3.4 Business in China
5.4 Ashland
5.4.1 Profile
5.4.2 Operation
5.4.3 Operation of Functional Material Division
5.4.4 BDO Business
5.4.5 Business in China
5.5 Nan Ya Plastics
5.5.1 Profile
5.5.2 Operation
5.5.3 BDO Business
5.5.4 Outlook
6 Major BDO Manufacturers in Mainland China
6.1 Shanxi Sanwei
6.1.1 Profile
6.1.2 Operation
6.1.3 Revenue Structure
6.1.4 Gross Margin
6.1.5 Clients and Suppliers
6.1.6 BDO Business
6.1.7 Forecast and Outlook
6.2 Yunnan Yunwei
6.2.1 Profile
6.2.2 Operation
6.2.3 Revenue Structure
6.2.4 Gross Margin
6.2.5 BDO Business
6.2.7 Forecast and Outlook
6.3 Sinopec Yizheng Chemical Fibre
6.3.1 Profile
6.3.2 BDO Business
6.4 Markor Chem
6.4.1 Profile
6.4.2 Operation
6.4.3 Clients and Suppliers
6.4.4 BDO Business
6.5 Fujian Meizhouwan
6.5.1 Profile
6.5.2 BDO Business
6.6 Nanjing Bluestar
6.6.1 Profile
6.6.2 BDO Business
6.7 China New Materials
6.7.1 Profile
6.7.2 BDO Business
6.8 HNCC
6.8.1 Profile
6.8.2 BDO Business
6.9 Other Companies
6.9.1 Shaanxi BDO
6.9.2 Sichuan Tianhua
6.9.3 Jianfeng Chemical
6.9.4 Guodian Younglight
6.9.5 Henan Kaixiang
6.9.6 Inner Mongolia Zhongyuan
6.9.7 Sinopec Sichuan Vinylon Works
6.9.8 Zhongjia Huachen Energy
6.9.9 Jiangshan Chemical
6.9.10 Xinjiang Tianye
6.9.11 Yanchang Petroleum
6.9.12 Hengyuan Coal Industry and Electricity Power
6.9.13 Shandong Weijiao
6.9.14 Shaanxi Ronghe Chemical
6.9.15 Xinjiang Blue Ridge Tunhe Chemical Industry Joint Stock
6.9.16 Xinjiang Guotai Xinhua Mining
7 Summary and Forecast
7.1 Summary
7.2 Forecast
7.2.1 Development Trend
7.2.2 Supply & Demand
BDO Industry Chain
Advantages and Disadvantages of BDO Production Process
Application of Global BDO Production Technology
Global BDO Capacity and Growth Rate, 2007-2014
Major BDO Manufacturers Worldwide and Their Capacity, as of Sep. 2014
Global BDO Demand and Growth Rate, 2007-2014
Capacity Share of Major BDO Manufacturers in the World, as of Sep. 2014
BDO Price Trend Worldwide, 2005-2014
BDO Anti-dumping Cases in China
Deposit and Anti-dumping Tax Rates Levied by China on Saudi Arabian and Taiwanese BDO Companies
BDO Manufacturers and Their Capacity in China, as of Sep. 2014
BDO Capacity Structure (by Production Process) in China, as of Sep. 2014
Proposed/Ongoing BDO Projects in China, 2014
BDO Capacity and Growth Rate in China, 2006-2014
BDO Output and Operating Rate in China, 2006-2014
BDO Apparent Consumption and Growth Rate in China, 2006-2014
BDO Downstream Consumption Structure in China, 2013
Major BDO Downstream Users, 2013
Capacity Share of Major BDO Manufacturers in China, as of Sep. 2014
Import/Export Volume of Other Diols in China, 2009-2014
Average Import/Export Price of Other Diols in China, 2009-2014
Import Sources of Other Diols (by Import Volume) in China, 2013
Export Destinations of Others Diols (by Export Volume) in China, 2013
Main Other Diols Importing Regions and Import Structure in China, 2013
Main Other Diols Exporting Regions and Export Structure in China, 2013
BDO Ex-factory Price of Shanxi Sanwei, 2009-2014
BDO Price (by Region) in China, Sep. 17, 2014
BDO Price (by Business) in China, Sep. 17, 2014
Geographical Distribution of Global PTMEG Capacity, 2013
Capacity Share of Major PTMEG Manufacturers in the World, 2013
Global PTMEG Capacity, 2007-2013
PEMEG Capacity in China, 2006-2013
PTMEG Output and Operating Rate in China, 2006-2013
PTMEG Manufacturers and Their Capacity in Mainland China, 2013
Proposed/Ongoing PTMEG Projects in China, 2014
PTMEG Apparent Consumption and Self-sufficiency Rate in China, 2008-2013
PTMEG Consumption Structure in China, 2013
PTMEG Import/Export Volume in China, 2008-2014
Average PTMEG Import/Export Price in China, 2008-2014
Distribution of PTMEG Import Sources (by Import Volume) in China, 2013
Distribution of PTMEG Export Destinations (by Export Volume) in China, 2013
Average PTMEG (MW: 1000 or 2000) Price in East China, 2013-2014
Global PBT Consumption Structure, 2013
Global PBT Consumption Structure (by Region), 2013
PBT Manufacturers and Their Capacity in China, 2013
PBT Consumption Structure in China, 2013
PBT Import/Export Volume in China, 2008-2014
Average PBT Import/Export Price in China, 2008-2014
Distribution of PBT Import Sources (by Import Volume) in China, 2013
Distribution of PBT Export Destinations (by Export Volume) in China, 2013
PBT (G10) Market Price of Jiangsu Sanfangxiang Group, 2009-2014
Quotations of Major PBT Manufacturers in China, Sep. 2014
Major GBL Manufacturers and Their Capacity in China, 2013
Sales and Net Income of BASF, 2009-2014
Sales Structure of BASF (by Division), 2013
Sales and EBITDA of BASF’s Chemical Division, 2012-2014
Sales Breakdown of BASF’s Chemical Division (by Product), 2012-2014
Sales Structure of BASF’s Chemical Division (by Product), 2012-2014
Intermediates Sales Structure of BASF (by Region), 2011-2013
Address, Capacity and Process of BDO Facilities of BASF, 2013
Main Products and Capacity of Dairen Chemical, 2013
Address and Capacity of BDO Plants of Dairen Chemical, 2013
BDO Industry Chain of Dairen Chemical
Revenue and Net Income of LYONDELLBASELL, 2011-2014
Revenue Structure of LYONDELLBASELL (by Division), 2013
Revenue and Operating Income of Intermediate and Derivative Division of LYONDELLBASELL, 2011-2014
Main Products and Capacity of Intermediate and Derivative Division of LYONDELLBASELL, 2013
Revenue and Net Income of Ashland, FY2010-FY2014
Revenue Structure of Ashland (by Division), FY2011-FY2013
Revenue Structure of Ashland’s Functional Material Division (by Market), 2013
Revenue Structure of Ashland’s Functional Material Division (by Product), 2013
Revenue Structure of Ashland’s Functional Material Division (by Region), 2013
Address, Capacity and Process of BDO Facilities of ISP, 2013
Main Products of Nan Ya Plastics
Revenue and Net Income of Nan Ya Plastics, 2009-2013
Nan Ya Plastics’ Revenue from Main Products and % of Total Revenue, 2013
Nan Ya Plastics’ Revenue from BDO and % of Total Revenue, 2009-2013
BDO Capacity and Output of Nan Ya Plastics, 2008-2013
BDO Sales Volume and Sales/Output Ratio of Nan Ya Plastics, 2009-2013
Proportion of BDO Self-used Volume and External Sales Volume in Total Sales Volume of Nan Ya Plastics, 2011-2013
Revenue and Net Income of Shanxi Sanwei, 2009-2014
Revenue Breakdown of Shanxi Sanwei (by Product), 2012-2014
Revenue Structure of Shanxi Sanwei (by Product), 2012-2014
Revenue Breakdown of Shanxi Sanwei (by Region), 2012-2014
Revenue Structure of Shanxi Sanwei (by Region), 2012-2014
Gross Margin of Main Products of Shanxi Sanwei, 2010-2014
Shanxi Sanwei’s Revenue from Top 5 Clients and % of Total Revenue, 2011-2013
Name List and Revenue Contribution of Shanxi Sanwei’s Top 5 Clients, 2013
Shanxi Sanwei’s Procurement from Top 5 Suppliers and % of Total Procurement, 2011-2013
Name List and Procurement Contribution of Shanxi Sanwei’s Top 5 Suppliers, 2013
Development Course of BDO Business of Shanxi Sanwei
Capacity of BDO and Downstream Products of Shanxi Sanwei, 2013
Revenue and Net Income of Shanxi Sanwei, 2013-2017E
Capacity of Main Products of Yunnan Yunwei, 2013
Revenue and Net Income of Yunnan Yunwei, 2009-2014
Revenue Breakdown of Yunnan Yunwei (by Product), 2012-2014
Revenue Structure of Yunnan Yunwei (by Product), 2012-2014
Revenue Breakdown of Yunnan Yunwei (by Region), 2012-2014
Revenue Structure of Yunnan Yunwei (by Region), 2012-2014
Gross Margin of Yunnan Yunwei (by Product), 2012-2014
BDO Capacity and Output of Yunnan Yunwei, 2011-2014
Revenue and Net Income of Yunnan Yunwei, 2010-2014
Revenue and Net Income of Yunnan Yunwei, 2013-2017E
Financial Indicators of Markor Chem, 2012-2013
Major Clients and BDO Supply of Markor Chem, 2012
Markor Chem’s Procurement and Products Procured from Major Suppliers, H1 2013
BDP Process of Markor Chem
BDO Capacity, Output, Sales Volume and Sales Price of Markor Chem, 2010-2013
Capacity of Main Products of Fujian Meizhouwan, 2013
Development Course of BDO-related Business of Dongying Shengli
Comparison of Some Global and Chinese Enterprises by BDO Revenue, 2013-2014
BDO Capacity and Growth Rate in China, 2013-2017E
BDO Output and Apparent Consumption in China, 2013-2017E
?
Global and China Synthetic Rubber Industry Report, 2021-2027
Synthetic rubber is a polymer product made of coal, petroleum and natural gas as main raw materials and polymerized with dienes and olefins as monomers, which is typically divided into general synthet...
Global and China Carbon Fiber Industry Report, 2021-2026
Carbon fiber is a kind of inorganic high performance fiber (with carbon content higher than 90%) converted from organic fiber through heat treatment. As a new material with good mechanical properties,...
Global and China Dissolving Pulp Industry Report, 2019-2025
In 2018, global dissolving pulp capacity outstripped 10 million tons and its output surged by 14.0% from a year ago to 7.07 million tons, roughly 70% of the capacity. China, as a key supplier of disso...
Global and China 1, 4-butanediol (BDO) Industry Report, 2019-2025
1,4-butanediol (BDO), an essential organic and fine chemical material, finds wide application in pharmaceuticals, chemicals, textile and household chemicals.
As of the end of 2018, the global BDO cap...
Global and China Carbon Fiber and CFRP Industry Report, 2019-2025
Among the world’s three major high performance fibers, carbon fiber features the highest strength and the highest specific modulus. It is widely used in such fields as aerospace, sports and leisure.
...
Global and China Natural Rubber Industry Report, 2019-2025
In 2018, global natural rubber industry continued remained at low ebb, as a result of economic fundamentals. Global natural rubber price presented a choppy downtrend and repeatedly hit a record low in...
Global and China Ultra High Molecular Weight Polyethylene (UHMWPE) Industry Report, 2019-2025
Ultra high molecular weight polyethylene (UHMWPE), a kind of linear polyethylene with relative molecular weight of above 1.5 million used as an engineering thermoplastic with excellent comprehensive p...
China Polyether Monomer Industry Report, 2019-2025
China has seen real estate boom and issued a raft of policies for continuous efforts in improving weak links in infrastructure sector over the years. Financial funds of RMB1,663.2 billion should be al...
Global and China Viscose Fiber Industry Report, 2019-2025
Over the recent years, the developed countries like the United States, Japan and EU members have withdrawn from the viscose fiber industry due to environmental factor and so forth, while the viscose f...
Global and China Synthetic Rubber (BR, SBR, EPR, IIR, NBR, Butadiene, Styrene, Rubber Additive) Industry Report, 2018-2023
In 2018, China boasted a total synthetic rubber capacity of roughly 6,667kt/a, including 130kt/a new effective capacity. Considering capacity adjustment, China’s capacity of seven synthetic rubbers (B...
Global and China Dissolving Pulp Industry Report, 2018-2022
With the commissioning of new dissolving pulp projects, the global dissolving pulp capacity had been up to about 8,000 kt by the end of 2017. It is worth noticing that the top six producers including ...
Global and China Carbon Fiber and CFRP Industry Report, 2018-2022
As a new generation of reinforced fiber boasting intrinsic properties of carbon material and excellent processability of textile fiber, carbon fiber is the one with the highest specific strength and s...
Global and China Ultra High Molecular Weight Polyethylene (UHMWPE) Industry Report, 2017-2021
Ultra High Molecular Weight Polyethylene (UHMWPE), a kind of linear polyethylene with relative molecular weight of above 1.5 million and an engineering thermoplastic with excellent comprehensive prope...
Global and China Aramid Fiber Industry Report, 2017-2021
Global aramid fiber output totaled 115kt with capacity utilization of 76.0% in 2016. As industries like environmental protection and military develop, the output is expected to rise to 138kt and capac...
Global and China Natural Rubber Industry Report, 2017-2021
In 2016, the global natural rubber output edged up 1.1% year on year to 12.4 million tons, and the consumption rose by 3.8% year on year to 12.6 million tons, indicating the gap of 200,000 tons betwee...
China Synthetic Rubber Industry Report, 2017-2021
Synthetic rubber is one of important strategic materials, mainly used in tyres and other industries. In 2016, the global output and consumption of synthetic rubber reached 14.822 million tons and 14.9...
Global and China 1,4-butanediol (BDO) Industry Report, 2017-2021
1,4-butanediol (BDO) is a key raw material for organic and fine chemicals, capable of generating various derivatives like THF, PTMEG and GBL. BDO and its derivatives find wide application in PBT plast...
Global and China Ethylene Oxide (EO) Industry Report, 2017-2021
Ethylene oxide (EO) is one of the major derivatives of the ethylene industry. Featured with special reactivity, it can generate a series of fine chemical products for a wide range of applications.
In...