Global and China Optoelectronic Device Industry Report, 2014-2016
-
July 2014
- Hard Copy
- USD
$2,600
-
- Pages:114
- Single User License
(PDF Unprintable)
- USD
$2,450
-
- Code:
PQ010
- Enterprise-wide License
(PDF Printable & Editable)
- USD
$3,800
-
- Hard Copy + Single User License
- USD
$2,800
-
Optoelectronic device refers to various functional devices made through the electricity-photon conversion effect, widely used in communications, solar energy, industrial laser, LED and other fields. The report mainly focuses on optoelectronic devices for communication applications. In 2013, the worldwide communication optoelectronic device industry registered revenue of USD7.2 billion, up 7.5% on year-on-year basis (an increase of 6 percentage points compared to last year).
Global communication optoelectronic device manufacturers are concentrated in a handful of countries or regions such as the United States, Japan,Taiwan and China. In 2013, the world’s top five manufacturers occupied an around 48.2% market share. And preponderant enterprises are constantly improving the industrial chain through mergers and acquisitions to sharpen their competitiveness. On June 28, 2013, for example, Avago completed the acquisition of the indium phosphide (InP) optical chip and component technology supplier – CyOptics with USD377 million; later, it announced on December 17, 2013 the takeover of LSI, a storage-on-chip giant, at a price of USD6.6 billion.
Given the advantage of labor cost as well as the huge demand potential, China has become a worldwide leading production base of optoelectronic devices for Finisar, Avago and other foreign tycoons. In 2013, Finisar earned USD229.2 million in revenue from the Chinese market, surging 34% year on year; Avago also reported 19% revenue growth in China.
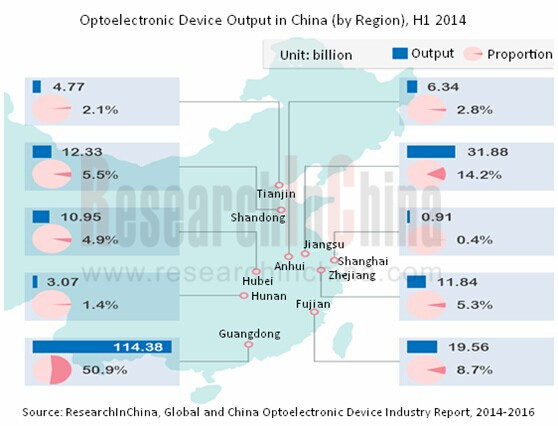
China’s production of optoelectronic devices presented explosive growth during the years 2008-2013, at a CAGR of 40.3%. In 2013, the output saw a slowdown in the growth rate but still sustained high-speed upward migration, up 31.5% year on year, which even hit 50.9% in the first half of 2014. From the regional perspective, optoelectronic device production bases are primarily located in Guangdong and Jiangsu provinces, which have contributed a combined 65.1% to China’s total output in the first half of 2014.
?
Global and China Optoelectronic Device Industry Report, 2014-2016 mainly contains the followings:
 Supply and demand, downstream market, major countries/regions (USA, Japan and Taiwan), etc. of global optoelectronic device industry;
Policy environment, supply and demand, competition pattern, trends, etc. of China optoelectronic device industry;
Operation, optoelectronic device business, development in China, etc. of 11 key optoelectronic device manufacturers worldwide (involving USA, Japan, China and Taiwan).
1. Overview of Optoelectronic Device Industry
1.1 Definition
1.2 Classification
1.3 Industry Chain
2. Global Optoelectronic Device Industry and Market
2.1 Supply and Demand
2.1.1 Supply Market
2.1.2 Demand Market
2.2 Downstream Market
2.2.1 Internet
2.2.2 Internet of Things (IoT)
2.2.3 Telecom Industry
2.3 Major Country/Region
2.3.1 USA
2.3.2 Japan
2.3.3 Taiwan
3. China Optoelectronic Device Industry and Market
3.1 Policy Environment
3.2 Supply and Demand
3.2.1 Supply
3.2.1 Demand
3.3 Competition Pattern
3.4 Downstream Market
3.5 Trends
3.5.1 Technology Trends
3.5.2 Industry Trends
4. Upstream Industry
4.1 Optical Chip
4.2 Copper Material
5. Key Players
5.1 Finisar
5.1.1 Profile
5.1.2 Operation
5.1.3 Revenue Structure
5.1.4 Gross Margin
5.1.5 R&D and Investment
5.1.6 Customers and Suppliers
5.1.7 Optoelectronic Device
5.1.8 Business in China
5.1.9 Development Forecast
5.2 Avago
5.2.1 Profile
5.2.2 Operation
5.2.3 Revenue Structure
5.2.4 Gross Margin
5.2.5 R&D and Investment
5.2.6 Customers and Suppliers
5.2.7 Optoelectronic Device
5.2.8 Business in China
5.2.9 Development Forecast
5.3 JDSU
5.3.1 Profile
5.3.2 Operation
5.3.3 Revenue Structure
5.3.4 Operating Margin
5.3.5 R&D and Investment
5.3.6 Optoelectronic Device
5.3.7 Business in China
5.3.8 Development Forecast
5.4 Oclaro
5.4.1 Profile
5.4.2 Operation
5.4.3 Revenue Structure
5.4.4 Gross Margin
5.4.5 R&D and Investment
5.4.6 Customers and Suppliers
5.4.7 Optoelectronic Device
5.4.8 Business in China
5.4.9 Development Forecast
5.5 Sumitomo Osaka Cement
5.5.1 Profile
5.5.2 Operation
5.5.3 Revenue Structure
5.5.4 Gross Margin
5.5.5 Optoelectronics
5.5.6 Development Forecast
5.6 Fujitsu
5.6.1 Profile
5.6.2 Operation
5.6.3 Revenue Structure
5.6.4 Operating Margin
5.6.5 R&D and Investment
5.6.6 Optoelectronic Device
5.6.7 Development Forecast
5.7 Accelink
5.7.1 Profile
5.7.2 Operation
5.7.3 Revenue Structure
5.7.4 Gross Margin
5.7.5 R&D and Investment
5.7.6 Customers and Suppliers
5.7.7 Optoelectronic Device
5.7.8 Development Forecast
5.8 NeoPhotonics
5.8.1 Profile
5.8.2 Operation
5.8.3 Revenue Structure
5.8.4 Gross Margin
5.8.5 R&D and Investment
5.8.6 Customers and Suppliers
5.8.7 Optoelectronic Device
5.8.8 Business in China
5.8.9 Development Forecast
5.9 Oplink
5.9.1 Profile
5.9.2 Operation
5.9.3 Revenue Structure
5.9.4 Gross Margin
5.4.5 R&D
5.9.6 Customers and Suppliers
5.9.7 Optoelectronic Device
5.9.8 Business in China
5.9.9 Development Forecast
5.10 Browave
5.10.1 Profile
5.10.2 Operation
5.10.3 Revenue Structure
5.10.4 Gross Margin
5.10.5 R&D and Investment
5.10.6 Customers and Suppliers
5.10.7 Optoelectronic Device
5.10.8 Business in China
5.10.9 Development Forecast
5.11 Broadex
5.11.1 Profile
5.11.2 Operation
5.11.3 Revenue Structure
5.11.4 Gross Margin
5.11.5 R&D and Investment
5.11.6 Customers and Suppliers
5.11.7 Optoelectronic Device
5.11.8 Development Forecast
6. Summary and Forecast
6.1 Summary
6.2 Forecast
Classification and Application of Optoelectronic Device
Communication Industry Chain
Global communication Optoelectronic Device Market Share (by Manufacturer), 2013
Revenue and YoY Growth of Global communication Optoelectronic Device Industry, 2009-2013
Global IP Traffic and YoY Growth, 2012-2016E
Global Mobile Data Traffic and YoY Growth, 2012-2016E
Global Video Traffic and YoY Growth, 2012-2016E
Global Mobile Phone User Scale (by Region), 2009-2016E
Global Mobile Phone Penetration (by Region), 2009-2016E
Global Mobile Broadband User Scale (by Region), 2010-2016E
Global Mobile Broadband Penetration (by Region), 2010-2016E
Global Fixed-line Broadband User Scale (by Region), 2010-2016E
Global Fixed-line Broadband Penetration (by Region), 2010-2016E
Global M2M Connections and YoY Growth, 2013-2016E
Global Wearable Device Connections and YoY Growth, 2013-2016E
Worldwide Telecom Spending and YoY Growth, 2009-2016E
U.S. Telecom Spending and YoY Growth, 2009-2016E
U.S. Access Infrastructure Equipment Expenditures (by Type), 2009-2016E
U.S. Network Security Spending and YoY Growth, 2009-2016E
U.S. Cloud Services Spending and YoY Growth, 2009-2016E
U.S. Mobile Phone User Scale and Penetration, 2009-2016E
U.S. Fixed-line Broadband User Scale and Penetration, 2009-2016E
Japan’s Mobile Phone User Scale and Penetration, 2009-2016E
Japan’s Fixed-line Broadband User Scale and Penetration, 2009-2016E
Optoelectronic Device Products of Major Optoelectronic Device Manufacturers in Taiwan
China’s Optoelectronic Device Output and YoY Growth, 2008-2014
Top 10 Optoelectronic Device Production Areas in China, 2009-2014
Trends in Structure of China’s Optoelectronic Device Output (by Region), 2009-2014
China’s Optoelectronic Device Output (by Product), 2009-2013
China’s Optoelectronic Device Sales Volume (by Product), 2009-2013
Primary Business of Major Optoelectronic Device Manufacturers in China
China’s Mobile Phone User Scale and Penetration, 2009-2016E
China’s Fixed-line Broadband User Scale and Penetration, 2009-2016E
China’s IoT Market Size and YoY Growth, 2009-2016E
China’s Cloud Computing Market Size and YoY Growth, 2009-2016E
China’s Copper Material Output and YoY Growth, 2008-2014
Revenue and Net Income of Finisar, FY2009-FY2013
Revenue Breakdown of Finisar (by Market Application), FY2010-FY2013
Revenue Breakdown of Finisar (by Region), FY2010-FY2013
Gross Margin of Finisar, FY2010-FY2013
R&D Costs and % of Total Revenue of Finisar, FY2010-FY2013
Mergers and Acquisitions of Finisar, 2008-2014
Finisar’s Optoelectronic Device Products and Their Application Fields
Finisar’s Companies in China and Their Primary Business
Revenue and YoY Growth of Finisar in China, FY2010-FY2013
Revenue and Net Income of Finisar, FY2012-FY2016E
Avago’s Major Products and Their Applications
Revenue and Net Income of Avago, FY2009-FY2014
Revenue Breakdown of Avago (by Market Application), FY2010-FY2014
Revenue Breakdown of Avago (by Region), FY2010-FY2013
Gross Margin of Avago, FY2010-FY2014
R&D Costs and % of Total Revenue of Avago, FY2010-FY2014
Avago’s Optoelectronic Devices and Their Applications
Avago’s Subsidiaries in China
Revenue and YoY Growth of Avago in China, FY2010-FY2014
Revenue and Net Income of Avago, FY2012-FY2016E
Revenue and Net Income of JDSU, FY2009-FY2014
Revenue Breakdown of JDSU (by Market Application), FY2012-FY2014
Revenue Structure of JDSU (by Region), FY2013
Operating Margin of JDSU (by Market Application), FY2012-FY2014
R&D Costs and % of Total Revenue of JDSU, FY2010-FY2014
JDSU’s Revenue from Optical Communication Products, FY2012-FY2014
Revenue and Net Income of JDSU, FY2012-FY2016E
Revenue and Net Income of Oclaro, FY2009-FY2014
Revenue Structure of Oclaro (by Product), Q1-Q3 FY2014
Revenue Breakdown of Oclaro (by Region), FY2011-FY2014
Gross Margin of Oclaro, FY2010-FY2014
R&D Costs and % of Total Revenue of Oclaro, FY2010-FY2014
Revenue and YoY Growth of Oclaro in China, FY2011-FY2014
Revenue and Net Income of Oclaro, FY2012-FY2016E
Revenue and Net Income of Sumitomo Osaka Cement, FY2009-FY2013
Revenue Breakdown of Sumitomo Osaka Cement (by Product), FY2010-FY2013
Gross Margin of Sumitomo Osaka Cement, FY2009-FY2013
Optoelectronic Revenue and % of Total Revenue of Sumitomo Osaka Cement, FY2010-FY2013
Revenue and Net Income of Sumitomo Osaka Cement, FY2012-FY2016E
Revenue and Net Income of Fujitsu, FY2009-FY2013
Revenue Breakdown of Fujitsu (by Product), FY2011-FY2013
Revenue Breakdown of Fujitsu (by Region), FY2009-FY2013
Operating Margin of Fujitsu (by Product), FY2011-FY2013
R&D Costs and % of Total Revenue of Fujitsu, FY2009-FY2013
Capital Expenditure and YoY Growth of Fujitsu, FY2009-FY2013
Revenue and Net Income of Fujitsu, FY2012-FY2016E
Revenue and Net Income of Accelink, 2009-2014
Revenue Structure of Accelink (by Product), 2013
Revenue Breakdown of Accelink (by Region), 2009-2013
Gross Margin of Accelink, 2009-2014
R&D Costs and % of Total Revenue of Accelink, 2009-2013
Mergers and Acquisitions of Accelink, 2012-2013
Accelink’s Revenue from Top 5 Customers and % of Total Revenue, 2010-2013
Accelink’s Procurement from Top 5 Suppliers and % of Total Procurement, 2010-2013
Optoelectronic Device Products, Applications and Industry Status of Accelink
Optoelectronic Device Output, Sales Volume and Sales-output Ratio of Accelink, 2011-2013
Revenue and Net Income of Accelink, 2009-2014
Revenue and Net Income of NeoPhotonics, 2009-2014
Revenue Breakdown of NeoPhotonics (by Region), 2009-2013
Gross Margin of NeoPhotonics, 2009-2014
R&D Costs and % of Total Revenue of NeoPhotonics, 2009-2014
NeoPhotonics’ Revenue from Top 10 Customers and % of Total Revenue, 2009-2013
Name List and Revenue Contribution of NeoPhotonics’ Top 3 Customers, 2011-2013
Revenue and YoY Growth of NeoPhotonics in China, 2009-2013
Revenue and Net Income of NeoPhotonics, 2012-2016E
Revenue and Net Income of Oplink, FY2009-FY2014
Revenue Breakdown of Oplink (by Region), FY2010-FY2014
Gross Margin of Oplink, FY2010-FY2014
R&D Costs and % of Total Revenue of Oplink, FY2010-FY2014
Oplink’s Revenue from Top 5 Customers and % of Total Revenue, FY2009-FY2014
Revenue and YoY Growth of Oplink in China, FY2010-FY2014
Revenue and Net Income of Oplink, FY2012-FY2016E
Revenue and Net Income of Browave, 2009-2014
Revenue Breakdown of Browave (by Product), 2010-2013
Revenue Structure of Browave (by Region), 2013
Gross Margin of Browave, 2009-2014
R&D Costs and % of Total Revenue of Browave, 2010-2014
Name List and Revenue Contribution of Browave’s Top 4 Customers, 2013
Name List and Material Supply of Browave’s Major Suppliers
Optoelectronic Device Capacity, Output and Capacity Utilization of Browave (by Product), 2011-2013
Optoelectronic Device Sales Volume, Sales and Sales-output Ratio of Browave (by Product), 2011-2013
Optical Communication Component Module Revenue and YoY Growth of Browave, 2011-2013
Revenue and YoY Growth of Browave in China, 2011-2013
Revenue and Net Income of Browave, 2012-2016E
Revenue and Net Income of Broadex, 2011-2013
Revenue Breakdown of Broadex (by Product), 2011-2013
Revenue Breakdown of Broadex (by Region), 2011-2013
Gross Margin of Broadex (by Product), 2011-2013
R&D Costs and % of Total Revenue of Broadex, 2011-2013
Proposed IPO Prospectus and Fund-raising Projects of Broadex, June 2014
Broadex’s Revenue from Top 5 Customers and % of Total Revenue, 2011-2013
Name List and Revenue Contribution of Broadex’s Top 5 Customers, 2013
Broadex’s Procurement from Top 5 Suppliers and % of Total Procurement, 2011-2013
Name List, Purchase Content and Procurement Contribution of Broadex’s Top 5 Suppliers, 2013
Broadex’s Major Optoelectronic Device Products and Their Applications
Optoelectronic Device Capacity, Output, Capacity Utilization and Sales-output Ratio of Broadex (by Product), 2011-2013
Optoelectronic Device Sales Volume, Unit Price, Sales and % of Sales of Broadex (by Product), 2011-2013
Revenue and Net Income of Broadex, 2012-2016E
Revenue and YoY Growth of Global Communication Optoelectronic Device Industry, 2012-2016E
Output and YoY Growth of China Optoelectronic Device, 2012-2016E
Global and China CMOS Camera Module (CCM) Industry Report, 2020-2026
The global CCM market has been ballooning thanks to expeditious penetration of multi-camera phones and advances in automotive ADAS, being worth $22.723 billion with a year-on-year spike of 16.6% in 20...
Global and China Multi-Layer Ceramic Capacitor (MLCC) Industry Report, 2020-2025
Electronic components like MLCC enjoy a rosy prospect alongside the burgeoning electronic manufacturing, the thriving internet and the prevalence of smart hardware.
MLCC was much sought after and it...
Global and China Voice Coil Motor (VCM) Industry Report, 2019-2025
VCM (voice circle motor or voice coil actuator), a part for smartphone camera, shares around 6% of smartphone camera industry chain value.
Globally, popularity of smartphones such as those with mult...
Global and China Aluminum Electrolytic Capacitor Industry Report, 2019-2025
Chinese aluminum electrolytic capacitor market has been expanding amid a transfer of its downstream industries to China like home appliance illumination, cellphones and computers as well as automatic ...
Global and China Flexible Printed Circuit (FPC) Industry Report, 2019-2025
Flexible printed circuit (FPC) products make their way into consumer electronics like smartphone and tablet PC, in the form of modules for display, touch control, fingerprint recognition, etc. The vol...
Global and China GaAs Industry Report, 2019-2025
Gallium arsenide (GaAs), one of the most mature compound semiconductors, is an integral part of smartphone power amplifier (PA). In 2018, GaAs-based radio frequency (RF) seized over half of the GaAs w...
Global and China Advanced Packaging Industry Report, 2019-2025
The global semiconductor packaging and testing market is enlarging with the prevalence of consumer electronics, automotive semiconductors and the Internet of Things (IoT), with its size edging up 2.5%...
Global and China MLCC Electronic Ceramics Industry Report, 2019-2025
MLCC is mainly used in audio and video equipment, mobile phones, computers and automobiles. The prospective boom of MLCC formula powder hinges on demand: 1) The accelerated renewal of consumer electro...
Global and China OLED Industry Report, 2019-2025
OLED, a new-generation display technology, features simple display structure, green consumables and flexibility and can be rolled up, which makes it easier to transport and install without considering...
Global and China Camera Module Industry Report, 2019-2025
Affected by factors like the maturity of mobile phone markets worldwide and the prolonged replacement of mobile phone by users, the mobile phone market has undergone a slowdown in growth rate. From Q4...
Global and China Multi-Layer Ceramic Capacitor (MLCC) Industry Report, 2018-2023
MLCC finds most application in consumer electronics, automobile and industrial fields and gets beefed up remarkably with the approaching 5G era of cellphones and tablet PCs, the advances in automotive...
Global and China Aluminum Electrolytic Capacitor Industry Report, 2018-2023
Aluminum electrolytic capacitor, a core electronic component, is widely used in consumer electronics, computers and peripherals, industry, electric power, lighting and automobiles.
Global aluminum e...
Global and China CMOS Camera System Industry Report, 2017-2021
Global CCM (CMOS Camera Module) market was worth USD16.611 billion in 2015, a year-on-year rise of 3.8% from 2014, the slowest rate since 2010. Global market fell modestly in 2016 due to a drop in shi...
Global and China Organic Light-Emitting Diode (OLED) Industry Report, 2017-2021
Global OLED market size approximated USD15.7 billion in 2016, a 20.8% rise from a year earlier. Stimulated by reports that Apple will adopt OLED screen for multiple iPhone models in 2017-2018, OLED sc...
Global and China CMOS Camera System Industry Report, 2016-2020
Global and China CMOS Camera System Industry Report, 2016-2020 covers the following:1. Analysis of CMOS Image Sensor (CIS) Industry and Market, with 7 vendors involved.2. Analysis of CMOS Camera Lens ...
Global and China Multi-layer Ceramic Capacitor (MLCC) Industry Report, 2017-2020
The rapid development of consumer electronics and industrial intelligentization has greatly promoted the booming of passive components including multi-layer ceramic capacitor (MLCC). In 2015, China’s ...
Global PCB Industry Report, 2015-2020
Global PCB Industry Report, 2015-2020 highlights the followings:1. Global PCB Market and Status Quo of the Industry2. Global Downstream Markets of PCB3. Mobile Phone PCB Trends4. Tablet PC/Laptop Comp...
Global and China Organic Light-Emitting Diode (OLED) Industry Report, 2016-2020
The OLED market has been developing rapidly worldwide over the recent years, and its market size reached USD13 billion in 2015. With technology and capacity construction, OLED (from small-sized panels...