Global and China CMOS Camera System Industry Report, 2017-2021
-
Dec.2017
- Hard Copy
- USD
$3,400
-
- Pages:230
- Single User License
(PDF Unprintable)
- USD
$3,200
-
- Code:
ZJF113
- Enterprise-wide License
(PDF Printable & Editable)
- USD
$4,800
-
- Hard Copy + Single User License
- USD
$3,600
-
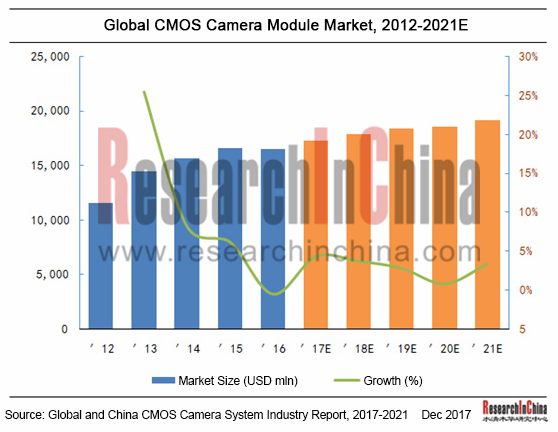
Global CCM (CMOS Camera Module) market was worth USD16.611 billion in 2015, a year-on-year rise of 3.8% from 2014, the slowest rate since 2010. Global market fell modestly in 2016 due to a drop in shipments of Apple phones that carry CCM with the highest unit price. The market experienced a big rebound in 2017 driven by dual camera, growing by 4.3% to USD17.232 billion, and is expected to attain USD19.134 billion in 2021.
CCM is composed of Lens, VCM, IRCF, CIS, DSP and FPC. Among them, CIS, Lens and VCM have the highest value. Take the mainstream 13-megapixel camera module for example, CIS, Lens and VCM make up about 40.6%, 14.3% and 11.3% of total costs, respectively.
CIS: Global CIS market size approximated USD10.516 billion in 2016, up 5.6% from a year ago, and is expected to grow 4.0% in 2017 and hit USD12.621 billion in 2021. Sony is an undisputed leader in the market with a market share of about 42% in 2016, followed by Samsung (18%), OmniVision (12%), ON Semiconductor (6%) and Panasonic (3%). CR3 was 73% and CR5 82% in 2016. Particularly, almost all 13MP-above products are made by first three vendors, indicating a high market concentration, a trend that is growing.
Optical Lens: Global shipments of lens (front and rear) totaled 3.49 billion pieces in 2016, a year-on-year rise of 7.9%, including 1.64 billion 5P-above lenses, a 19.7% increase from a year ago, far higher than the growth rate of the industry, compared with a continued fall in shipments of 5P-below lens. The world’s shipments of optical lens are expected to reach 3.763 billion pieces in 2021, including 2.728 billion 5P-above lenses, representing a 72.5% market share. Taiwanese LARGAN Precision, a behemoth in the market, shipped 1.15 billion lenses with a market share of 32.9% in 2016. It is expected that, along with hot sales of new-generation iPhone and continuous upgrading of mobile phone lens, LARGAN Precision will seize 34.3% by market share and 16.4% by shipments.
VCM: Global demand for mobile phone VCM was 1.49 billion pieces in 2016 and will climb to 3.2 billion pieces in 2021 at a CAGR of 17.1%, Hundreds of VCM producers are primarily divided into Japanese ones (Alps, Mitsumi Electric, TDK), South Korean ones (Samsung Electric, JAHWA, Hysonic and LG) and Chinese ones (New Shicoh Motor, B.L. Electronics, Hozel Electronics, and Liaoning Zhonglan Electronic Technology). Japanese and South Korean players have advanced technologies and mature processes. As Chinese technology and process for VCM advance, local VCM enterprises, with advantages in price and services, have become more competitive and are expected to break monopoly of Japanese and South Korean counterparts.
Global and China CMOS Camera System Industry Report, 2017-2021 highlights the followings:
 CMOS camera module industry and market, 17 relevant vendors;
CMOS image sensor industry and market, 6 relevant vendors;
CMOS camera lens industry and market, 11 relevant vendors;
CMOS camera VCM industry and market, 4 relevant vendors.
1 CMOS Camera Module Industry
1.1 CMOS Camera Module Industry Chain
1.2 Technology Route
1.3 CMOS Camera Module Industry
1.3.1 Market Size
1.3.2 Competitive Landscape
1.4 Mobile Phone CCM Market
1.4.1 Global Mobile Phone Market
1.4.2 Mobile CCM Market Size
1.4.3 Competitive Landscape
1.4.4 Future Development Trend
1.5 Automotive CCM Market
1.5.1 Market Size
1.5.2 Competitive Landscape
1.6 Dual Camera
1.6.1 Overview
1.6.2 Market
1.6.3 Competitive Landscape
1.7 3D Imaging
1.7.1 Overview
1.7.2 Market
2 CMOS Image Sensor Industry
2.1 CIS Overview and Technology Route
2.2 CIS Market Size
2.3 CIS Supply Chain
2.4 Competitive Landscape
3 Optical Lens Industry
3.1 Overview
3.2 Competitive Landscape
3.3 Development Direction
4 VCM Industry
4.1 Introduction to VCM
4.2 Market Size
4.3 Competitive Landscape
5 AA Equipment Industry
5.1 Introduction
5.2 Market Size
5.3 Competitive Landscape
6 CMOS Image Sensor Vendors
6.1 Sony
6.1.1 Profile
6.1.2 Operation
6.1.3 Revenue Structure
6.1.4 CMOS Products and Applications
6.2 Samsung Electronics
6.2.1 Profile
6.2.2 Operation
6.2.3 Revenue Structure
6.2.4 CMOS Products and Applications
6.3 Omnivision
6.3.1 Profile
6.3.2 Major Products
6.3.3 Latest Products and Applications
6.4 ON-SEMI
6.4.1 Profile
6.4.2 Operation
6.4.3 Revenue Structure
6.4.4 Image Sensor Business
6.5 Galaxycore Microelectronics
6.5.1 Profile
6.5.2 Major Products
6.5.3 Dynamics
6.6 SuperPix Micro Technology
6.6.1 Profile
6.6.2 Operation
6.6.3 Revenue Structure
6.6.4 Major Products
7 Optical Lens Vendors
7.1 Largan Precision
7.1.1 Profile
7.1.2 Operation
7.1.3 Revenue Structure
7.1.4 Largan Optronic Co., Ltd.
7.1.5 Suzhou Largan Co., Ltd.
7.2 GeniuS Electronic Optical (GSEO)
7.2.1 Profile
7.2.2 Operation
7.2.3 Revenue Structure
7.2.4 GeniuS Electronic Optical (Xiamen) Co., Ltd.
7.2.5 Giant Electronic Optical (Xiamen) Co., Ltd
7.3 Asia Optical
7.3.1 Profile
7.3.2 Operation
7.3.3 Revenue Structure
7.3.4 Major Products
7.3.5 Dongguan Sintai Optical Co., Ltd.
7.3.6 Sintai Optical (Shenzhen) Co., Ltd.
7.4 Newmax Technology
7.4.1 Profile
7.4.2 Operation
7.4.3 Major Products
7.4.4 Neoptic Co., Ltd
7.5 Ability Opto-Electronics Technology (AOET)
7.5.1 Profile
7.5.2 Operation
7.5.3 Revenue Structure
7.5.4 Output & Sales Volume
7.6 KANTATSU
7.6.1 Profile
7.6.2 Major Products
7.6.3 Layout in China
7.7 Digital Optics
7.7.1 Profile
7.7.2 Operation
7.7.3 Revenue Structure
7.7.4 Output & Sales Volume
7.8 Glorytek
7.8.1 Profile
7.8.2 Operation
7.8.3 Revenue Structure
7.8.4 Major Products
7.8.5 Glorytek (Suzhou) Co., Ltd.
7.9 SEKONIX
7.9.1 Profile
7.9.2 Operation
7.9.3 Output & Sales Volume
7.9.4 Weihai Sekonix Optical Electronics Co., Ltd.
7.10 Korea Optical
7.10.1 Profile
7.10.2 Operation
7.10.3 Lianchuang Electronic Technology's Investment into KOLEN
7.10.4 Rongcheng KOLEN Optical Co., Ltd.
7.11 FUJINON
7.11.1 Profile
7.11.2 FUJIFILM Opt-Electronics (Tianjin) Co., Ltd
7.11.3 FUJIFILM Opt-Electronics (Shenzhen) Co., Ltd
8 VCM Vendors
8.1 ALPS
8.1.1 Profile
8.1.2 Business Performance
8.1.3 Revenue Structure
8.2 Hysonic
8.2.1 Profile
8.2.2Major Products
8.3 Jahwa Electronics
8.3.1 Profile
8.3.2 Business Performance
8.3.3 Revenue Structure
8.3.4 Output & Sales Volume
8.4 Mitsumi Electric
8.4.1 Profile
8.4.2 Operation
9 Camera Module Vendors
9.1 Chicony
9.1.1 Profile
9.1.2 Operation
9.1.3 Revenue Structure
9.1.4 Operation in China
9.2 O-Film
9.2.1 Profile
9.2.2 Business Performance
9.2.3 Revenue Structure
9.2.4 Output & Sales Volume
9.2.5 Acquisition of Sony Electronics Huanan Co., Ltd.
9.3 Q-TECH
9.3.1 Profile
9.3.2 Business Performance
9.3.3 Sales
9.4 LG INNOTEK
9.4.1 Profile
9.4.2 Operation
9.4.3 Revenue Structure
9.4.4 Camera Module Business
9.4.5 Production
9.5 Cowell
9.5.1 Profile
9.5.2 Business Performance
9.5.3 Revenue Structure
9.5.4 Shipment
9.6 Truly International
9.6.1 Profile
9.6.2 Operation
9.6.3 Revenue Structure
9.6.4 Main Business
9.7 BYD
9.7.1 Profile
9.7.2 Major Products
9.8 LITEON
9.8.1 Profile
9.8.2 Operation
9.8.3 Revenue Structure
9.8.4 Output & Sales Volume
9.8.5 Operation in China
9.9 Primax
9.9.1 Profile
9.9.2 Operation
9.9.3 Revenue Structure
9.9.4 Output & Sales Volume
9.9.5 Production Layout
9.10 SEMCO
9.10.1 Profile
9.10.2 Business Performance
9.10.3 Revenue Structure
9.10.4 Tianjin Samsung Electro-Mechanics Co., Ltd.
9.11 Partron
9.11.1 Profile
9.11.2 Business Performance
9.11.3 Revenue Structure
9.11.4 Production Layout
9.12 Sunny Optical
9.12.1 Profile
9.12.2 Business Performance
9.12.3 Revenue Structure
9.12.4 Output & Sales Volume
9.13 CAMMSYS
9.13.1 Profile
9.13.2 Business Performance
9.13.3 Production
9.13.4 SUNYANG DNT
9.14 Powerlogics
9.14.1 Profile
9.14.2 Business Performance
9.14.3 Production
9.14.4 Layout
9.15 MCNEX
9.15.1 Profile
9.15.2 Business Performance
9.15.3 Revenue Structure
9.15.4 Production
9.15.5 MCNEX (Shanghai) Electronics Co., Ltd.
9.16 Globaloptics
9.16.1 Profile
9.16.2 Operation
9.17 Shine Tech
9.17.1 Profile
9.17.2 Operation
Basic Composition of Typical CMOS Camera Module
Value Structure of Mobile Phone Camera Module Industry Chain Links
Differences of CMOS Module Technologies
Packaging of CMOS Module by Technology
Global CMOS Camera Module Market Size, 2013-2021E
Global CCM Vendor Rankings by Revenue, 2010-2016
Capacity of Major Global CCM Vendors, 2016-2017
Supply Relationship of CCM Supply Chain
Global Mobile Phone Shipment, 2013-2021E
Market Share of Global Smartphone Vendors, 2016
Global Mobile Phone CCM Market Size, 2013-2021E
Global Mobile Phone CCM Shipment Structure, 2017
Distribution of Samsung’s Camera Module Suppliers, 2016
Distribution of Apple’s Camera Module Suppliers, 2016
Distribution of ZTE’s Camera Module Suppliers, 2016
Distribution of Huawei’s Camera Module Suppliers, 2016
Distribution of Xiaomi’s Camera Module Suppliers, 2016
Distribution of OPPO’s Camera Module Suppliers, 2016
Distribution of VIVO’s Camera Module Suppliers, 2016
Future Development Path of Mobile Phone CCM
Installation Arrangement of Automotive Cameras (in KIA K9’s Case)
Distribution and Functions of Automotive ADAS Cameras
ADAS-related Requirements in Vehicle Safety Regulations of Major Countries
Global Automotive Camera Module Shipment, 2013-2021E
Market Share of Major Global Automotive CCM Vendors, 2016
Market Share of Major Global Automotive Vision System Vendors, 2016
Advantages of Dual Camera over Single Camera
Comparison among Four Technical Solutions of Dual Camera
Launch of Dual Camera Mobile Phones, 2017
Mobile Phone Dual Camera Module Market Size, 2016-2020E
Value Structure of Dual Camera Module Industry Chain Links, 2020E
Global Dual Camera Module Shipment Structure, 2016
Comparison among There Mainstream 3D Imaging Solutions
Major Global Companies in 3D Imaging Industry Chain
Global Mobile Phone 3D Imaging Market Size, 2016-2020E
Comparison among Different Kinds of CIS (CMOS Image Sensor)
Comparison between BSI Technology and FSI Technology
Comparison between Conventional BSI Image Sensing Technology and 3D Stacked Image Sensing Technology
R&D Progress of Stacked CIS of Major Institutions
Global CIS Market Size, 2011-2021E
Global Handheld Device CIS Shipment Structure by Pixel, 2013-2019E
CIS Downstream Market Size Structure, 2014-2017
CIS Industry Chain
CIS Industry Chain (in Omnivision’s Case)
CIS Market Landscape by Player, 2017
Global CIS Vendor Market Share by Revenue, 2015-2016
Comparison of Optical Lenses by Number of Lens
Global Lens Shipment Structure by Number of Lens, 2014-2021E
Global Optical Lens Shipment Structure by Application, 2017
Shipment Structure of Major Global Mobile Phone Lens Vendors by Number of Lens, 2016
Shipment and Market Share of Major Global Mobile Phone Lens Vendors, 2016-2017
Capacity and Supply Relationship of Major Global Mobile Phone Lens Vendors, 2015-2016
Comparison of Lens Shipment Structure among Some Vendors by Pixel, 2012-2017
Technology Upgrade and Product Launch of Some Global Mobile Pone Lens Vendors
Structure of VCM
Sectional View of VCM
Merits and Demerits of Different VCW
Schematic Diagram of OIS
Structure of OIS
Global Mobile Phone VCM Demand, 2014-2021E
Global Mobile Phone Auto Focus Penetration, 2014-2020E
Shipment of Mobile Phones with OIS, 2014-2021E
Product Layout and Capacity of Major Global VCM Vendors, 2016
Market Share of Major Global VCM Vendors by Shipment, 2016
Supply Relationship between AFA and Camera Module Vendors
Market Share of Major OIS Vendors by Amount, 2016
AA Process Diagram by Degree of Freedom
AA Module Process Diagram
AA Equipment Market Size, 2015-2019E
ASMPT AA Equipment Sales, 2016-2017
Sony’s Main Businesses and Products
Sony’s Revenue and Profits, FY2013-FY2017
Sony’s Revenue Structure by Business, FY2015-FY2017
Sony’s Revenue Structure by Region, FY2015-FY2017
Sony Semiconductor Solutions’ Organizational Structure
Sony’s Image Sensor Capacity Expansion Plan
Applications of Image Sensor
Development Course of Samsung Electronics
Main Businesses of Samsung Electronics
Samsung Electronics’ Revenue and Profits, 2012-2017
Samsung Electronics’ Revenue Structure by Business, 2012-2017
Samsung Electronics’ Revenue Structure by Region, 2015-2017
Samsung Isocell Image Sensors
List of Samsung Electronics’ CMOS Image Sensor Products for Main Mobile Terminals
Application of Samsung Electronics’ CMOS Image Sensor in Automobile
Omnivision Automotive Imaging Application
Omnivision Medical Imaging Application
Omnivision Mobile Devices Application
Omnivision CMOS Surveillance Application
Omnivision AR/VR Application
Omnivision PC/Notebook Application
Evolvement of ON Semiconductor’s Image Sensor Business
ON Semiconductor’s Main Businesses and Products
ON Semiconductor’s Revenue and Net Income, 2012-2017
ON Semiconductor’s Quarterly Sales by Business, 2016-2017
ON Semiconductor’s Quarterly Sales from Products by Application, 2016-2017
ON Semiconductor’s Sales Breakdown by Region, 2014-2016
ON Semiconductor’s Image Sensor Group’s Quarterly Revenue, 2015-2016
ON Semiconductor’s Main Image Sensor Module Products
ON Semiconductor’s Sales Structure by Industry and Application, 2016
List of Galaxycore’s CMOS Image Sensor Products
Revenue and Net Income of Superpix Micro Technology, 2013-2017
Revenue Breakdown of Superpix Micro Technology by Business, 2015-2017
List of Main CMOS Image Sensor Products of Superpix Micro Technology
Applications of Main CMOS Image Sensors of Superpix Micro Technology
Largan Precision’s Main Products and Functions
Largan Precision’s Revenue and Gross Margin, 2006-2017
Largan Precision’s Revenue Breakdown by Region, 2015-2016
Largan Precision’s Shipment Structure by Pixel, 2014-2017
Largan Precision’s Shipment, 2011-2016
Revenue and Profits of Largan Optronic, 2012-2016
Revenue and Profits of Suzhou Largan, 2012-2016
Main Products of GSEO
GSEO’s Production Layout
GSEO’s Revenue and Gross Margin, 2013-2017
GSEO’s Revenue Breakdown by Region, 2015-2016
Revenue and Profits of Genius Electronic Optical (Xiamen) Co., Ltd., 2012-2016
Revenue and Profits of Giant Electronic Optical (Xiamen) Co., Ltd., 2012-2016
Asia Optical’s Revenue and Gross Margin, 2012-2017
Asia Optical’s Revenue Breakdown by Product, 2015-2016
Asia Optical’s Revenue Breakdown by Region, 2015-2016
Asia Optical’s Main Optical Modules
Asia Optical’s Main Optical Lenses
Revenue and Profits of Dongguan Sintai Optical Co., Ltd., 2014-2016
Revenue and Profits of Sintai Optical (Shenzhen) Co., Ltd., 2014-2016
Newmax Technology’s Revenue and Gross Margin, 2012-2017
Output and Sales Volume of Newmax Technology’s Optical Lenses, 2015-2016
Newmax Technology’s Main Optical Lens Products
Dongguan Neoptic’s Revenue and Profits, 2012-2016
Applications of Ability Opto-Electronics Technology’s Optical Lens Products
Business Layout of Ability Opto-Electronics Technology
Revenue and Gross Margin of Ability Opto-Electronics Technology, 2012-2017
Revenue Breakdown of Ability Opto-Electronics Technology by Product, 2015-2016
Revenue Breakdown of Ability Opto-Electronics Technology by Region, 2015-2016
Output and Sales Volume of Ability Opto-Electronics Technology’s Main Products, 2015-2016
Division of Labor and Collaboration between Kantatsu’s Main Factories
List of Kantatsu’s Mobile Phone Camera Modules
Profile of Kanto Tatsumi Electronics (Pinghu) Co., Ltd.
Profile of Lianyungang Kantatsu Fine Technology Co., Ltd.
Digital Optics’ Revenue and Operating Margin, 2012-2017
Digital Optics’ Revenue Breakdown by Business, 2016
Price of Digital Optics’ Main Products, 2014-2016
Production of Digital Optics’ Optical Lens, 2014-2016
Digital Optics’ Raw Material Cost Structure 2014-2016
Glory Science’s Regional Layout
Glory Science’s Revenue and Operating Margin, 2011-2017
Glory Science’s Revenue Breakdown by Product, 2015-2016
Output and Sales Volume of Glory Science’s Optical Lenses, 2015-2016
Glory Science’s Main Optical Lens Products
Profile of Glorytek (Suzhou) Co., Ltd.
Profile of Glorytek (Yancheng) Co., Ltd.
Core Competition of Sekonix
Sekonix’s Revenue and Operating Margin, 2002-2016
Sekonix’s Revenue Breakdown by Product, 2016
Capacity of Sekonix’s Main Products, 2014-2016
Output of Sekonix’s Main Products, 2014-2016
Sekonix’s Revenue Breakdown by Region/Product, 2014-2016
Prices of Sekonix’s Main Products, 2014-2016
Profile of Weihai Sekonix Optical Electronics Co., Ltd.
Korea Optical’s Main Products
Korea Optical’s Revenue and Operating Margin, 2007-2016
Korea Optical’s Roadmap
Profile of Rongcheng KOLEN Optical Co., Ltd.
Fujinon’s Main Optical Lenses
Profile of Fujifilm Opt-Electronics (Tianjin) Co., Ltd.
Profile of Fujifilm Opt-Electronics (Shenzhen) Co., Ltd.
ALPS Electric’s Revenue and Operating Income, FY2012-FY2017
ALPS Electric’s Revenue Breakdown by Product, FY2016-FY2017
ALPS Electric’s R&D Costs, FY2016-FY2017
Hysonic’s Organization
Hysonic’s Revenue and Operating Income, 2006-2016
Hysonic’s Main Products
New Business of Hysonic
Main Clients of Hysonic
Jahwa Electronics’ Revenue and Operating Income, 2011-2017
Jahwa Electronics’ Revenue Breakdown by Product, 2015-2017
Average Unit Price of Production Materials for Jahwa Electronics’ Main Products, 2015-2017
Capacity of Jahwa Electronics’ Main Products, 2015-2017
Output and Capacity Utilization of Jahwa Electronics’ Main Products, 2015-2017
Mitsumi Electric’s Main Products and Market Position
Mitsumi Electric’s Revenue and Operating Margin, FY2006-FY2017
Mitsumi Electric’s Revenue Breakdown by Product, FY2006-FY2016
Chicony Electronics’ Revenue and Gross Margin, 2011-2017
Chicony Electronics’ Quarterly Net Income, 2015-2017
Chicony Electronics’ Revenue Breakdown by Region, 2015-2016
Chicony Electronics’ Revenue Breakdown by Product, 2015-2016
Profile of Chicony Electronics (Suzhou) Co., Ltd.
Revenue and Operating Income of Chicony Electronics (Suzhou) Co., Ltd., 2011-2016
Profile of Chicony Electronics (DongGuan) Co., Ltd.
Revenue and Operating Income of Chicony Electronics (DongGuan) Co., Ltd., 2011-2016
O-film Tech’s Main Businesses and Products
O-film Tech’s Key Subsidiaries
O-film Tech’s Revenue and Operating Margin, 2007-2017
O-film Tech’s Revenue Breakdown by Product, 2014-2017
O-film Tech’s Gross Margin by Product, 2014-2017
O-film Tech’s Revenue Structure by Region, 2014-2017
Capacity and Output of O-film Tech’s Main Products, 2014-2016
Prices of O-film Tech’s Main Raw Materials, 2014-2017
O-film Tech’s Revenue from Top5 Clients, 2014-2017
Milestones of Q-Tech
Main Business of Q-Tech
Q-Tech’s Revenue and Gross Margin, 2011-2017
Quarterly Shipment and Average Price of Q-Tech’s Camera Modules, 2012-2017
Q-Tech’s Monthly Shipment of CCM, 2015-2017
CCM ASP of Q-Tech by Pixel, 2016-2017
Q-Tech’s Top5 Clients, 2017
Q-Tech’s Miniaturization Strategy
LG Innotek’s Main Camera Modules
LG Innotek’s Revenue and Operating Margin, 2006-2017
LG Innotek’s Revenue Breakdown by Business, 2013-2017
Distribution of LG Innotek’s Main Businesses by Sales Region, 2014-2016
LG Innotek’s Optical Revenue by Quarter, 2016-2017
LG Innotek’s Optical Orders by Pixel, 2016-2017
Prices of LG Innotek’s Main Products, 2014-2016
Output of LG Innotek’s Main Products, 2014-2016
Materials List and Cost Structure of LG Innotek’s Main Products, 2014-2016
Cowell E’s Main Businesses
Cowell E’s Revenue and Gross Margin, 2011-2017
Cowell E’s Revenue Breakdown by Segment, 2015-2017
Cowell E’s Revenue Breakdown by Region, 2015-2017
Shipments and ASP of Cowell E’s Camera Modules, 2011-2017
Holding Structure of Truly International's Subsidiaries
Truly International’s Revenue and Operating Margin, 2010-2017
Truly International’s Gross Margin and Net Margin, 2013-2017
Truly International’s Revenue Breakdown by Product, 2015-2017
Truly International’s Revenue Breakdown by Region, 2015-2017
Truly International’s Mobile Phone LCD Clients
Truly International’s Car Display Clients
Truly International’s Touch Screen Capacity
Truly International’s CCM Capacity
Truly International’s CCM Clients
BYD’s Optical Lenses
BYD’s Camera Modules
Lite-On Technology’s Main Businesses and Layout
Lite-On Technology’s Main Product Divisions
Lite-on Technology’s Revenue and Operating Margin, 2012-2017
Lite-on Technology’s Revenue Breakdown by Product, 2015-2017
Lite-on Technology’s Revenue Breakdown by Region, 2015-2016
Capacity and Output of Lite-On Technology’s Main Products, 2015-2016
Sales of Lite-On Technology’s Main Products, 2015-2016
Lite-on Science Park, Guangzhou
Lite-on Technology’s CCM Technology Roadmap
Profile of Lite-on Electronics (Tianjin) Co., Ltd.
Primax’s Main Businesses
Primax’s Organizational Structure
Primax’s Global Layout
Primax’s Key Milestones
Primax’s Revenue and Operating Margin, 2011-2017
Primax’s Revenue Breakdown by Product, 2015-2017
Primax’s Revenue Breakdown by Region, 2015-2016
Production Value and Volume of Primax, 2015-2016
Sales Value and Volume of Primax, 2015-2016
Primax’s Production Layout in Mainland China
SEMCO’s Revenue and Operating Income, 2011-2017
SEMCO’s Revenue Breakdown by Segment, 2014-2017
SEMCO’s Operating Income by Segment, 2015-2017
Profiles of Tianjin Samsung Electro-Mechanics Co., Ltd.
Revenue and Profits of Tianjin Samsung Electro-Mechanics Co., Ltd., 2012-2016
Patron Organization
Patron’s Revenue and Operating Margin, 2007-2017
Patron’s Revenue Breakdown by Business, 2006-2016
Patron’s Revenue Breakdown by Client, 2013-2016
Patron’s Production Layout
Main Divisions of Sunny Optical
Business Models of Sunny Optical
Milestones of Sunny Optical
Revenue and Gross Margin of Sunny Optical, 2004-2016
Financial Summary of Sunny Optical, 2011-2017
Revenue of Sunny Optical by Segment, 2015-2017
Revenue of Sunny Optical by Division, 2010-2016
Gross Margin of Sunny Optical by Division, 2010-2017
Shipments of Sunny Optical by Product, 2013-2016
Automotive LENS Shipments and ASP of Sunny Optical by Pixel, 2014-2018E
Mobile Phone Camera Shipments and Proportion of Sunny Optical by Pixel, 2014-2016
Mobile Phone Camera Module Shipments and Proportion of Sunny Optical by Pixel, 2014-2016
Main Customers of Sunny Optical
Factories of Sunny Optical
Milestones of CAMMSYS
Organizational Structure of CAMMSYS
Development Strategy of CAMMSYS in 2020
Revenue and Operating Margin of CAMMSYS, 2011-2017
Revenue of CAMMSYS from Main Products, 2015-2017
Production and R&D Layout of CAMMSYS
Camera Module Product Line of CAMMSYS
Camera Module Capacity, Output and Capacity Utilization of CAMMSYS, 2015-2017
Profile of SUNYANG DNT
Revenue and Operating Income of POWERLOGIC,
Revenue of POWERLOGIC by Product/Region, 2015-2017
CCM Average Unit Price of POWERLOGIC, 2012-2017
Capacity of POWERLOGIC by Product, 2015-2017
Output of POWERLOGIC by Product, 2015-2017
CCM Component ASP of POWERLOGIC, 2012-2017
Main Camera Modules of POWERLOGIC
Global Business Layout of POWERLOGIC
Profile of POWERLOGICS (Tianjin)
MCNEX’s Main Products for Mobile Phones
MCNEX’s Main Products for Automobile
Revenue and Operating Margin of MCNEX, 2009-2017
Revenue of MCNEX by Business, 2015-2017
Revenue of MCNEX by Business/Region, 2015-2017
Average Selling Price of MCNEX’s Camera Modules, 2015-2017
Average Purchase Price of Major Materials for MCNEX’s Camera Modules, 2015-2017
Camera Module Capacity of MCNEX, 2015-2017
Camera Module Output of MCNEX, 2015-2017
Revenue of MCNEX by Customer, 2015-2017
MCNEX’s Capacity by Region
Profile of MCNEX (Shanghai)
Global Optics Business Structure
Profile of Shenzhen Shine Tech
Main Customers of Shine Tech
Global and China CMOS Camera Module (CCM) Industry Report, 2020-2026
The global CCM market has been ballooning thanks to expeditious penetration of multi-camera phones and advances in automotive ADAS, being worth $22.723 billion with a year-on-year spike of 16.6% in 20...
Global and China Multi-Layer Ceramic Capacitor (MLCC) Industry Report, 2020-2025
Electronic components like MLCC enjoy a rosy prospect alongside the burgeoning electronic manufacturing, the thriving internet and the prevalence of smart hardware.
MLCC was much sought after and it...
Global and China Voice Coil Motor (VCM) Industry Report, 2019-2025
VCM (voice circle motor or voice coil actuator), a part for smartphone camera, shares around 6% of smartphone camera industry chain value.
Globally, popularity of smartphones such as those with mult...
Global and China Aluminum Electrolytic Capacitor Industry Report, 2019-2025
Chinese aluminum electrolytic capacitor market has been expanding amid a transfer of its downstream industries to China like home appliance illumination, cellphones and computers as well as automatic ...
Global and China Flexible Printed Circuit (FPC) Industry Report, 2019-2025
Flexible printed circuit (FPC) products make their way into consumer electronics like smartphone and tablet PC, in the form of modules for display, touch control, fingerprint recognition, etc. The vol...
Global and China GaAs Industry Report, 2019-2025
Gallium arsenide (GaAs), one of the most mature compound semiconductors, is an integral part of smartphone power amplifier (PA). In 2018, GaAs-based radio frequency (RF) seized over half of the GaAs w...
Global and China Advanced Packaging Industry Report, 2019-2025
The global semiconductor packaging and testing market is enlarging with the prevalence of consumer electronics, automotive semiconductors and the Internet of Things (IoT), with its size edging up 2.5%...
Global and China MLCC Electronic Ceramics Industry Report, 2019-2025
MLCC is mainly used in audio and video equipment, mobile phones, computers and automobiles. The prospective boom of MLCC formula powder hinges on demand: 1) The accelerated renewal of consumer electro...
Global and China OLED Industry Report, 2019-2025
OLED, a new-generation display technology, features simple display structure, green consumables and flexibility and can be rolled up, which makes it easier to transport and install without considering...
Global and China Camera Module Industry Report, 2019-2025
Affected by factors like the maturity of mobile phone markets worldwide and the prolonged replacement of mobile phone by users, the mobile phone market has undergone a slowdown in growth rate. From Q4...
Global and China Multi-Layer Ceramic Capacitor (MLCC) Industry Report, 2018-2023
MLCC finds most application in consumer electronics, automobile and industrial fields and gets beefed up remarkably with the approaching 5G era of cellphones and tablet PCs, the advances in automotive...
Global and China Aluminum Electrolytic Capacitor Industry Report, 2018-2023
Aluminum electrolytic capacitor, a core electronic component, is widely used in consumer electronics, computers and peripherals, industry, electric power, lighting and automobiles.
Global aluminum e...
Global and China CMOS Camera System Industry Report, 2017-2021
Global CCM (CMOS Camera Module) market was worth USD16.611 billion in 2015, a year-on-year rise of 3.8% from 2014, the slowest rate since 2010. Global market fell modestly in 2016 due to a drop in shi...
Global and China Organic Light-Emitting Diode (OLED) Industry Report, 2017-2021
Global OLED market size approximated USD15.7 billion in 2016, a 20.8% rise from a year earlier. Stimulated by reports that Apple will adopt OLED screen for multiple iPhone models in 2017-2018, OLED sc...
Global and China CMOS Camera System Industry Report, 2016-2020
Global and China CMOS Camera System Industry Report, 2016-2020 covers the following:1. Analysis of CMOS Image Sensor (CIS) Industry and Market, with 7 vendors involved.2. Analysis of CMOS Camera Lens ...
Global and China Multi-layer Ceramic Capacitor (MLCC) Industry Report, 2017-2020
The rapid development of consumer electronics and industrial intelligentization has greatly promoted the booming of passive components including multi-layer ceramic capacitor (MLCC). In 2015, China’s ...
Global PCB Industry Report, 2015-2020
Global PCB Industry Report, 2015-2020 highlights the followings:1. Global PCB Market and Status Quo of the Industry2. Global Downstream Markets of PCB3. Mobile Phone PCB Trends4. Tablet PC/Laptop Comp...
Global and China Organic Light-Emitting Diode (OLED) Industry Report, 2016-2020
The OLED market has been developing rapidly worldwide over the recent years, and its market size reached USD13 billion in 2015. With technology and capacity construction, OLED (from small-sized panels...