Global and China Connectivity RF Industry Report, 2014-2015
-
June 2015
- Hard Copy
- USD
$2,300
-
- Pages:96
- Single User License
(PDF Unprintable)
- USD
$2,150
-
- Code:
ZYW208
- Enterprise-wide License
(PDF Printable & Editable)
- USD
$3,300
-
- Hard Copy + Single User License
- USD
$2,500
-
The report covers the followings:
1, Introduction to Connectivity RF
2, Analysis on Connectivity RF Market
3, Analysis on Connectivity RF Industry
4. Research on 20 Connectivity RF Companies
A Connectivity RF system is a radio frequency system consisting of electronic devices connected to the network, mainly applied to mobile phones, tablet PCs, laptopsand WLAN / PAN now, and will find wide application in IoT (Internet of Things).
The Connectivity RF system market size reached approximately USD7.516 billion in 2014, showing a substantial rise of 23.4% over 2013. In 2015, the market size is expected to go up by 34.1% year on year to USD10.08 billion. It will maintain the growth rate of 17.3% by 2016, becoming the fastest growing field among all electronic components.
The rapid growth of the Connectivity RF system market is primarily prompted by 4G mobile phones. A standard 2G mobile phone requires a Connectivity RF system costing only about USD0.55, a 3G phone USD2.75, while a 4G phone up to USD8 and a global standard 4G phone USD13 or above. The penetration rate of 4G phones in China is the highest in the world. China’s 4G mobile phone shipment only accounted for 2% of the total mobile phone shipment in December 2013, but the proportion jumped to 71% in December 2014 and more than 80% in March 2015.
In 2015, a wave of 4G phone replacement will speed up worldwide, which will stimulate the Connectivity RF system market.
The rapid growth of 802.11ac is another driving engine. Less than 10% of WiFi supported 802.11ac in 2014, while the proportion is expected to be 80% in 2018. The Connectivity RF cost of 802.11ac is much higher than that of the current mainstream 802.11a/b/g. The next development direction of LTE will be carrier aggregation (CA). The shipment of mobile phones supporting carrier aggregation only amounted to 108 million units in 2014, and is expected to reach 1.185 billion units by 2018. Carrier aggregation makes Connectivity RF more complex and costly.
The core of a Connectivity RF system includes PA and filters (the fastest growing segment). LTE-FDD's Band 8, 13 and 26 need TC-SAW, Band 4, 5, 12, 17, 20, 27 and 28 require SAW, Band 2, 3, 7, 23, 25 and 30 demand BAW, while LTE-TDD’s Band 38, 10, 41, 42 and 43 use SAW.
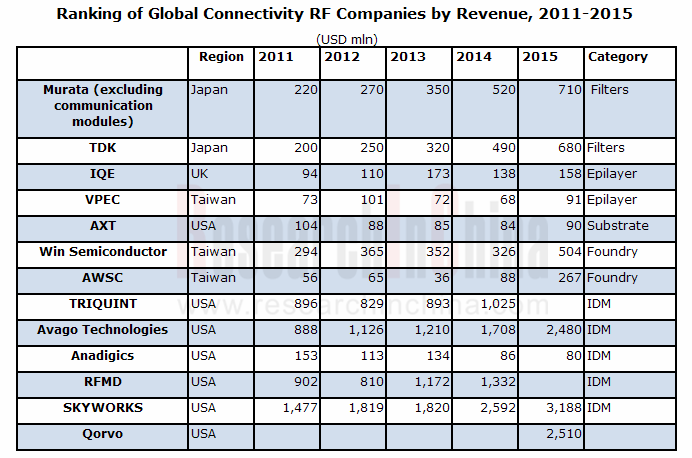
In the highly concentrated Connectivity RF system industry, the top five companies enjoy over 97% market share, which is hard for small firmsto survive. One reason is that PA requires unique GaAs wafers instead of the traditional Si wafers; the other reason rests with the high production threshold in the filter field. All laboratories can accomplish trial production, but only a handful of companies (mainly Japanese companies) are capable to conduct mass production with high consistency and quality. Major SAW companies embrace Murata, TDK and Fujitsu. Panasonic and Qorvo target TC-SAW. Avago, Qorvo, Taiyoyuden and TDK focus on BAW.
Qorvo is a new company after the merger of RFMD and Triquint. Taiwanese companies witness the fastest growth in 2015. For example, Skyworks and Avago outsource considerable products to their foundries Win and AWSC respectively, especially Avago lavish huge capital on acquisitions to significantly reduce manufacturing costs, so that AWSC’s revenue will ascend by at least 200% in 2015.
1 Overview of Connectivity RF
1.1 Brief Introduction to Connectivity RF
1.2Brief Introduction to GaAs
1.3Comparison between GaAs,Ganand Sige
2Connectivity RF Industry
2.1 Connectivity RF Market Size
2.2Connectivity RF Industry Chain
2.3Analysis of RF System of Latest Handsets
2.4 Mobile Phone Filter Industry
2.5 Mobile Phone Antenna Switch
2.6 Ranking of Connectivity RF Companies
3 Connectivity RF Downstream Markets
3.1 LTE Mobile Phone Market
3.2 Global Mobile Phone Industry
3.3 Chinese Mobile Phone Market
3.4 Laptop Market
3.5 Tablet PC Market
3.6 Board Connectivity RF Market
4 Connectivity RF Companies
4.1 Murata
4.2 Kopin
4.3 Semiconductor Division of Sumitomo Electric
4.4 Freiberger
4.5 AXT
4.6 IQE
4.7 WIN Semiconductor
4.8 AWSC
4.9 VPEC
4.10 GCS
4.11 TRIQUINT
4.12 AVAGO
4.13 ANADIGICS
4.14 RFMD
4.15 RDA
4.16 SKYWORKS
4.17 SEDI
4.18 Hittite Microwave
4.19 M/A-COM TECHNOLOGY
4.20 TDK
Typical RF Structure
Connectivity RF Market Size, 2011-2017E
Filter Market Size, 2011-2017E
Downstream Distribution of Connectivity RF Market, 2011-2017E
Major Companies in Connectivity RF Industry Chain
Costs of Mobile Phone RF System
LTE/WCDMA/CDMA/GSM Block Diagram of Apple iPhone 5S
LTE/WCDMA/GSM Block Diagram of Samsung SM-G900S
Bands Used for Mobile Phone RF Filters
Application Number of Mobile Phone RF Filters
Comparison between BAW and SAW
Shipment of Mobile Phone-use Duplexers / FABR Filters, 2013-2017E
Market Share of Major SAW Filter Companies, 2015
Mobile Phone Antenna Switch Shipment by Technology, 2010-2016E
Market Share of Major Global Mobile Phone Antenna Switch Companies, 2012
Ranking of Global Connectivity RF Companies by Revenue, 2011-2015
Frequency Bands per Mobile Handset Device, 2000-2018E
Cellular Terminal Shipment by Celluar Standard, 2000-2018E
LTE-enabled Cellular Terminal Shipment, 2011-2018E
Worldwide Smartphone Sales to End Users by Vendor, 2014
Worldwide Smartphone Sales to End Users by Operating System, 2014
Shipment of Top Ten Global Mobile Phone Companies, 2014
Monthly Shipment of Chinese Mobile Phone Market, 2013-2014
Market Share of Major Companies in Chinese Smart Phone Market, 2014
Market Share of Major Companies in Chinese 4G Mobile Phone Market, 2014
Laptop Computer Shipment, 2008-2015
Shipment of Major Global Laptop ODM Companies, 2010-2014
Global Tablet PC Shipment, 2011-2016E
Shipment of Top Five Tablet Vendors, Q4 2014
Shipment, Market Share and Growth of Top Five Tablet Vendors, 2014
Total Shipment of Wi-Fi Enabled Products, 2012-2016E
Murata’s Sales and Operation Margin, FY2009-FY2016
Murata’s Sales by Product, FY2013-2016
Murata’s Major Products
Murata's Sales by Application, FY2013-2016
Operating Income of Bridge of Murata, FY2014-2015
Murata's Quarterly Sales, Order and Backlog, Q2 2012-Q1 2015
Global Distribution of KOPIN
Revenue and Operating Margin of KOPIN, 2006-2011
Revenue of KOPIN by Business, 2008-2011
Revenue of KOPIN by Client, 2008-2011
Revenue and Operating Margin of AXT, 2006-2015
Revenue of AXT by Product, 2006-2013
Revenue of AXT by Region, 2006-2014
Revenue and Operating Margin of IQE, 2005-2013
Revenue of IQE by Business, 2008-2014
Revenue of IQE by Region, 2008-2014
Organizational Structure of WIN Semiconductor
Divisions of WIN Semiconductor
Revenue and Operating Margin of WIN Semiconductor, 2006-2015
Quarterly Revenue of WIN Semiconductor, Q2 2013-Q1 2015
Quarterly Gross Margin, Operating Margin and Net Profit Margin of WIN Semiconductor, Q2 2013-Q1 2015
Monthly Revenue of WIN Semiconductor, Apr 2013-Apr 2015
Revenue of WIN Semiconductor by Product, 2014-Q1 2015
Manufacturing Capacity of WIN Semiconductor, 2005-2013
Core Competitiveness of WIN Semiconductor
Organizational Structure of AWSC
Revenue and Gross Margin of AWSC, 2006-2015
Revenue and Operating Margin of AWSC, 2009-2016
Monthly Revenue of AWSC, Apr 2013-Apr 2015
Revenue and Operating Margin of VPEC, 2007-2015
Monthly Revenue of VPEC, Mar 2013- Mar 2015
Revenue of VPEC by Product, Q1 2012-Q4 2013
Revenue and Gross Margin of TRIQUNIT, 2001-2014
Revenue of TRIQUINT by Business, 2005-2014
TRIQUINT’s Mobile Phone Revenue by System, 2005-2012
GaAs Capacity of TRIQUINT’s Texas Plant, Q1 2009-Q4 2011
BAW Capacity of TRIQUINT’s Texas Plant, Q1 2009-Q4 2011
FLSAW Capacity of TRIQUINT’s Florida Plant, Q1 2009-Q4 2011
FLIP CHIP Capacity of TRIQUINT’s Costa Rica Plant, Q1 2009-Q4 2011
RF Framework Trend of Smart Phones
Revenue and Operation Margin of Avago, FY2007-FY2015
Balance Sheet of Avago, FY2010-FY2014
Revenue of Avago by segment, FY2007-FY2015
Core Technologies of Avago
Revenue of Avago by Region, FY2011-FY2014
Revenue and Gross Margin of ANADIGICS, 2006-2015
Revenue and Net Income of ANADIGICS, 2011-2015
Revenue of ANADIGICS by Client, 2007-2012
Revenue of ANADIGICS by Business, 2005-2012
Revenue of ANADIGICS by Region, 2008-2014
Revenue and Operating Margin of RFMD, FY2002-FY2015
Revenue of RFMD by Division, FY2009-FY2014
Revenue of RFMD by Region, FY2010-FY2014
Revenue and Operating Margin of RDA, 2007-2014
Baseband Product Roadmap of RDA
Product Roadmap of RDA
Main Customers of RDA
Revenue of RDA by Product
Revenue, Gross Margin and Operating Margin of Skyworks, FY2008-FY2015
Expenditures of Skyworks, FY2007-FY2014
Quarterly Revenue and Operating Margin of Skyworks, Q2 2013-Q1 2015
Revenue of Skyworks by Region, FY2009-FY2014
Revenue of Skyworks by Client, FY2007-FY2014
Revenue of Skyworks by Product, FY2011-FY2014
Revenue and Operating Income of Hittite Microwave, 2007-2013
Revenue and Operating Income of M / A-COM, FY2007-FY2015
Revenue of M / A-COM by Application, FY2010-FY2014
TDK’s Net Sales, FY2006-FY2015
TDK’s Operating Income, FY2006-FY2015
TDK’s R&D Costs, FY2006-FY2015
TDK’s Capex, FY2006-FY2015
TDK’s Sales by Application, FY2012-FY2015
TDK’s Passive Components Sales by Application, FY2012-FY2015
TDK’s Quarterly Sales by Application, FY2014-FY2015
Quarterly Sales of TDK’s Passive Components by Application, FY2014-FY2015
TDK’s Sales by Segment, FY2014-FY2015
Global and China CMOS Camera Module (CCM) Industry Report, 2020-2026
The global CCM market has been ballooning thanks to expeditious penetration of multi-camera phones and advances in automotive ADAS, being worth $22.723 billion with a year-on-year spike of 16.6% in 20...
Global and China Multi-Layer Ceramic Capacitor (MLCC) Industry Report, 2020-2025
Electronic components like MLCC enjoy a rosy prospect alongside the burgeoning electronic manufacturing, the thriving internet and the prevalence of smart hardware.
MLCC was much sought after and it...
Global and China Voice Coil Motor (VCM) Industry Report, 2019-2025
VCM (voice circle motor or voice coil actuator), a part for smartphone camera, shares around 6% of smartphone camera industry chain value.
Globally, popularity of smartphones such as those with mult...
Global and China Aluminum Electrolytic Capacitor Industry Report, 2019-2025
Chinese aluminum electrolytic capacitor market has been expanding amid a transfer of its downstream industries to China like home appliance illumination, cellphones and computers as well as automatic ...
Global and China Flexible Printed Circuit (FPC) Industry Report, 2019-2025
Flexible printed circuit (FPC) products make their way into consumer electronics like smartphone and tablet PC, in the form of modules for display, touch control, fingerprint recognition, etc. The vol...
Global and China GaAs Industry Report, 2019-2025
Gallium arsenide (GaAs), one of the most mature compound semiconductors, is an integral part of smartphone power amplifier (PA). In 2018, GaAs-based radio frequency (RF) seized over half of the GaAs w...
Global and China Advanced Packaging Industry Report, 2019-2025
The global semiconductor packaging and testing market is enlarging with the prevalence of consumer electronics, automotive semiconductors and the Internet of Things (IoT), with its size edging up 2.5%...
Global and China MLCC Electronic Ceramics Industry Report, 2019-2025
MLCC is mainly used in audio and video equipment, mobile phones, computers and automobiles. The prospective boom of MLCC formula powder hinges on demand: 1) The accelerated renewal of consumer electro...
Global and China OLED Industry Report, 2019-2025
OLED, a new-generation display technology, features simple display structure, green consumables and flexibility and can be rolled up, which makes it easier to transport and install without considering...
Global and China Camera Module Industry Report, 2019-2025
Affected by factors like the maturity of mobile phone markets worldwide and the prolonged replacement of mobile phone by users, the mobile phone market has undergone a slowdown in growth rate. From Q4...
Global and China Multi-Layer Ceramic Capacitor (MLCC) Industry Report, 2018-2023
MLCC finds most application in consumer electronics, automobile and industrial fields and gets beefed up remarkably with the approaching 5G era of cellphones and tablet PCs, the advances in automotive...
Global and China Aluminum Electrolytic Capacitor Industry Report, 2018-2023
Aluminum electrolytic capacitor, a core electronic component, is widely used in consumer electronics, computers and peripherals, industry, electric power, lighting and automobiles.
Global aluminum e...
Global and China CMOS Camera System Industry Report, 2017-2021
Global CCM (CMOS Camera Module) market was worth USD16.611 billion in 2015, a year-on-year rise of 3.8% from 2014, the slowest rate since 2010. Global market fell modestly in 2016 due to a drop in shi...
Global and China Organic Light-Emitting Diode (OLED) Industry Report, 2017-2021
Global OLED market size approximated USD15.7 billion in 2016, a 20.8% rise from a year earlier. Stimulated by reports that Apple will adopt OLED screen for multiple iPhone models in 2017-2018, OLED sc...
Global and China CMOS Camera System Industry Report, 2016-2020
Global and China CMOS Camera System Industry Report, 2016-2020 covers the following:1. Analysis of CMOS Image Sensor (CIS) Industry and Market, with 7 vendors involved.2. Analysis of CMOS Camera Lens ...
Global and China Multi-layer Ceramic Capacitor (MLCC) Industry Report, 2017-2020
The rapid development of consumer electronics and industrial intelligentization has greatly promoted the booming of passive components including multi-layer ceramic capacitor (MLCC). In 2015, China’s ...
Global PCB Industry Report, 2015-2020
Global PCB Industry Report, 2015-2020 highlights the followings:1. Global PCB Market and Status Quo of the Industry2. Global Downstream Markets of PCB3. Mobile Phone PCB Trends4. Tablet PC/Laptop Comp...
Global and China Organic Light-Emitting Diode (OLED) Industry Report, 2016-2020
The OLED market has been developing rapidly worldwide over the recent years, and its market size reached USD13 billion in 2015. With technology and capacity construction, OLED (from small-sized panels...