Global and China Wind Turbine Industry Report, 2016-2020
-
July 2016
- Hard Copy
- USD
$2,600
-
- Pages:145
- Single User License
(PDF Unprintable)
- USD
$2,450
-
- Code:
BXM092
- Enterprise-wide License
(PDF Printable & Editable)
- USD
$3,600
-
- Hard Copy + Single User License
- USD
$2,800
-
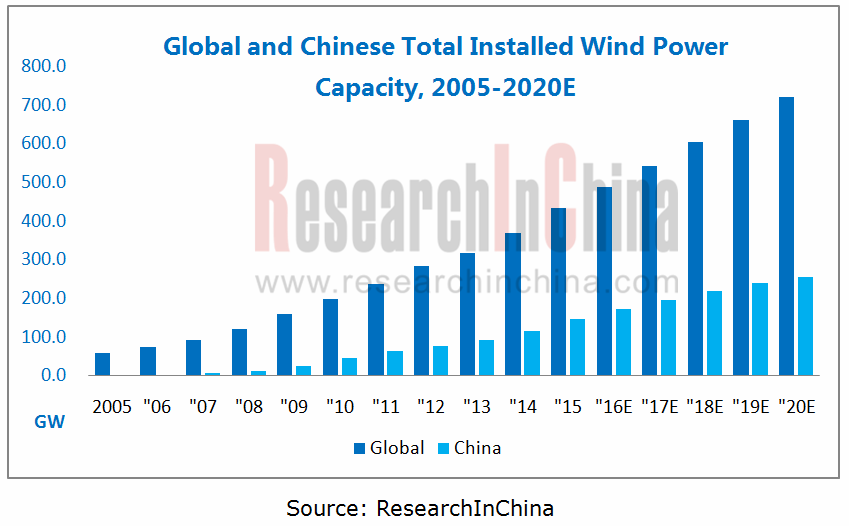
In 2015, global new installed wind power capacity reached 63.01GW, up 22.41% YoY, refreshing new installed wind power capacity records again. China continues to lead the global wind power market with new installed capacity of 30.75GW in 2015 and the first worldwide ranking for six consecutive years.
The wind power market will continue to be buoyant during the 13th Five-Year Plan period (2016-2020). The global total installed wind power capacity is expected to surpass 700GW by 2020, of which, China will reach around 250GW.
Large-scale wind power is the development trend of wind power technology in recent years. China’s new per-unit power of wind turbine has been on the rise since 2000, hitting 1,837kW in 2015, more than three times as much as that in 2000. Concerning China’s new installed wind power capacity in 2015, 1.5MW and 2MW wind turbines were predominant with a combined 84% share, of which, 2MW wind turbine outperformed 1.5MW wind turbine for the first time and accounted for 50%.
Development of offshore wind power growing at a steady pace is expected to accelerate in the future. In 2015, China’s new grid-connected capacity of offshore wind power was recorded at 360.5MW, occupying 10.7% of the global total. China’s total installed grid-connected capacity of offshore wind power is planned to hit 30GW by 2020, while the cumulative actual installed capacity was merely 1GW in 2015. Given this, the offshore wind power construction will be greatly sped up.
To solve the wind turbine suspension problem, distributed wind power generation will be the first choice in the future. There has been a phased saturation for large-scale wind power development in Northwest, Northeast and North China, where the wind turbine suspension problem is increasingly severe. In 2015, wind turbine suspension volume reached a peak i.e. 33.9 billion kWh in five years, registering an average suspension rate of 15%. To improve the situation, the government has proposed the priority development of distributed wind power during the 13th Five-Year Plan period. According to the plan, the installed distributed wind power capacity will be 25GW by 2020 and 70GW by 2050.
The report covers the followings:
 Global wind energy resources, installed wind power capacity and structure, wind power development in major countries, corporate competition, etc.;
China’s installed wind power capacity and structure, offshore wind power, exports, corporate competition, etc.;
Market status of wind turbine parts (e.g. blade, gearbox, tower, converter, generator, bearing) as well as operation of key players;
Wind energy resources, wind power development mode, construction achievements, main developers, etc.;
Operation, R&D, etc. of 5 global and 10 Chinese wind turbine companies.
With global new installed capacity of 7.8GW, Goldwind Science & Technology Co., Ltd. became the world’s largest wind turbine manufacturer in 2015, followed successively by Vestas, GE, Siemens and Gamesa. In June 2016, Siemens announced the signing of a binding agreement with Gamesa on merging wind power business of both sides (including Siemens Wind Power Services). Affected by this, the global wind turbine market structure will be changed in 2016.
In addition to Goldwind Science & Technology, there were 8 Chinese players reporting new installed wind power capacity of over 1MW in 2015, namely United Power, Envision Energy, Mingyang Wind Power, CSIC (Chongqing) HaizhuangWindpower Equipment, Shanghai Electric, XEMC Windpower, DongfangElectric Corporation and Zhejiang Windey, in succession.
Furthermore, wind-turbine parts companies in China have good supply capability.
In terms of wind power blade, China has possessed the 1.5MW wind blade R&D and production capacity, which will increase gradually to 3MW, 5MW and even more; representative firms include AVIC HuitengWindpower Equipment Co., Ltd., Shanghai FRP Research Institute Co., Ltd., Lianyungang ZhongfuLianzhong Composites Group Co., Ltd. and Sinoma Science & Technology Co.,Ltd. With respect to wind power gearbox, Nanjing High Accurate Drive Equipment Manufacturing Group Co., Ltd. (NGC) as a leader in China and even in the world registers a share of 60% domestically and 23% globally. In the aspect of wind power converter, foreign brands like ABB, Converteam and Emerson take the leading position; however, Sungrow Power Supply, Hopewind Electric, Shanghai Hi-tech Control System Co., Ltd. (HITE) and other local firms are rising.
1 Introduction to Wind Turbine
1.1 Definition
1.2 Classification
1.3 Industry Chain
2 Global Wind Turbine Industry
2.1 Wind Energy Resources and Utilization
2.1.1 Resource Distribution
2.1.2 Investment and Construction
2.1.3 Wind Power Generation
2.2 Installed Wind Power Capacity
2.2.1 Total Installed Capacity
2.2.2 Major Regions
2.2.3 Offshore Wind Power
2.3 Major Countries
2.3.1 Germany
2.3.2 Spain
2.3.3 USA
2.3.4 Denmark
2.3.5 UK
2.4 Competition Pattern
3 Chinese Wind Turbine Industry
3.1 Main Policies
3.2 Installed Capacity and Structure
3.2.1 Total Installed Capacity
3.2.2 By Region
3.2.3 By Power
3.2.4 Offshore Wind Power
3.3 Export
3.4 Competition Pattern
4 Main Parts of Wind Turbine
4.1 Blade
4.1.1 Global Market Supply and Demand
4.1.2 Chinese Market Supply and Demand
4.1.3 Technology Status
4.1.4Key Players
4.2 Gearbox
4.2.1 Overview
4.2.2 Market Supply and Demand
4.2.3 Key Players
4.3 Tower
4.3.1 Market Scale
4.3.2 Key Players
4.4 Generator
4.4.1 Market Overview
4.4.2 Key Players
4.5 Wind Power Converter
4.5.1 Overview
4.5.2 Market Supply and Demand
4.5.3 Key Players
4.6 Bearing
4.6.1 Market Supply and Demand
4.6.2 Key Players
5 Development and Construction of Wind Farms
5.1 Wind Energy Resources and Utilization
5.1.1 Resource Distribution
5.1.2 Wind Power Feed-in Metering
5.1.3Wind Power Feed-in Tariff
5.2 Wind Power Development and Construction
5.2.1 Wind Power Development Mode
5.2.2 Development and Construction Achievements
5.2.3 Development and Construction Scheme 2016
5.3 Wind Power Developers
6 Global Wind Turbine Companies
6.1 Vestas
6.1.1 Profile
6.1.2 Operation
6.1.3 Wind Power Business in China
6.2 GE
6.2.1 Profile
6.2.2 Operation
6.2.3 Wind Power Business in China
6.3 Siemens
6.3.1 Profile
6.3.2 Operation
6.3.3 Wind Power Business in China
6.4 Gamesa
6.4.1 Profile
6.4.2 Operation
6.4.3 Wind Power Business in China
6.5 Enercon
6.5.1 Profile
6.5.2 Operation
7 Chinese Wind Turbine Companies
7.1 Goldwind Science & Technology
7.1.1 Profile
7.1.2 Operation
7.2 Sinovel Wind Group
7.2.1 Profile
7.2.2 Operation
7.3 United Power
7.3.1 Profile
7.3.2 Operation
7.4 Dongfang Electric Corporation
7.4.1 Profile
7.4.2 Operation
7.5 Mingyang Wind Power
7.5.1 Profile
7.5.2 Operation
7.6 Shanghai Electric
7.6.1 Profile
7.6.2 Operation
7.7 XEMC Windpower
7.7.1 Profile
7.7.2 Operation
7.8 Envision Energy
7.8.1 Profile
7.8.2 Operation
7.9 CSIC (Chongqing) Haizhuang Windpower Equipment
7.9.1 Profile
7.9.2 Operation
7.10 Zhejiang Windey
7.10.1 Profile
7.10.2 Operation
8 Summary and Forecast
8.1 Market
8.1.1 Global
8.1.2 China
8.2 Enterprise
8.2.1 Global
8.2.2 China
Wind Turbine Structure
Typical Wind Turbine Parts Structure and Cost
Comparison between Double-Fed Wind Turbines and Permanent-Magnet Direct-Drive Wind Turbines
Wind Power Industry Chain
Wind Farm Construction Cost Composition
Distribution of Global Wind Energy Resources
Distribution of Wind Resources in Global Costal Areas
Investment in Global Wind Power Generation Projects and YoY Growth, 2010-2020E
Global Wind Power Generation and Structure, 2009-2020E
Global New Installed Capacity, 2001-2020E
Global Total Installed Capacity, 2001-2020E
Global Installed Wind Power Capacity (by Region), 2014-2015
Top10 Countries by New Installed Wind Power Capacity, 2015
Top10 Countries by Total Installed Wind Power Capacity, 2015
Global Total Installed Offshore Wind Power Capacity, 2011-2020E
Installed Offshore Wind Power Capacity in Major Countries, 2015
Germany's Installed Onshore Wind Power Capacity, 2015
Germany's New and Total Installed Onshore Wind Power Capacity, 1992-2015
Germany's Installed Onshore Wind Power Capacity (by Region), 2015
Germany's Installed Offshore Wind Power Capacity, 2015
Application and Composition of Limits for Offshore Wind Power Integration in Germany at the End of 2015
Distribution of Offshore Wind Power Projects in Germany by the End of 2015
Spain's New Installed Wind Power Capacity, 1990-2015
Spain's Total Installed Wind Power Capacity, 2005-2015
Spain's Total Installed Capacity (by Region), 2015
Spain's Total Installed Capacity (by Company), 2015
Structure of U.S. Installed New Energy Capacity (by Energy Type), 2015
U.S. Installed Wind Power Capacity (by Quarter), 2009-2016
U.S. New and Total Installed Wind Power Capacity, 1999-2016
U.S. Total Installed Wind Power Capacity (by Region) as of 2016Q1
Distribution of Wind Power Related Manufacturers in the U.S., 2015
U.S. Wind Power Projects under Construction as of 2016Q1
Distribution of Proposed Wind Power Projects in the U.S. as of 2016Q1
Wind Power Share in Denmark's Electricity Consumption, 2005-2015
Denmark's Total Installed Wind Power Capacity, 2005-2015
UK's Total Installed Wind Power Capacity, 2009-2015
UK's Installed Wind Power Capacity as of May 2016
Top10 Market Share of Global Wind Power Manufacturers (by Increment)
Top10 Wind Turbine Suppliers in the Five Parts of the World (by Increment), 2015
TOP10 Offshore Wind Turbine Suppliers in the World, 2015
Policies on China Wind Power Industry, 2014-2016
Targets for Wind Power Development in China, 2050
Targets and Layout for Wind Power Development in Main Areas of China, 2050
China's New and Total Installed Wind Power Capacity, 2005-2020E
China's New and Total Installed Wind Power Integration Capacity, 2011-2020E
China's New Installed Wind Power Capacity (by Province/City), 2015
China's Total Installed Wind Power Capacity (by Province/City), 2015
Average Power of Newly and Cumulatively Installed Wind Turbines in China, 1991-2015
China's New Installed Wind Turbine Capacity by Different Powers, 2015
China's New Installed 1.5MW and 2MW Wind Turbine Capacity, 2004-2015
China's New and Total Installed Offshore Wind Power Capacity, 2008-2016
Total Installed Capacity of Offshore Wind Power Projects by Different Types of Resources, 2015
China's New Installed Offshore Wind Power Capacity, 2015
China's Wind Turbine Export Capacity, 2008-2015
China's Total Wind Turbine Export Volume (by Country), 2015
Total Wind Turbine Export Capacity of Chinese Wind Turbine Companies at the End of 2015
New Wind Turbine Export Capacity of Chinese Wind Turbine Companies, 2015
New Installed Wind Power Capacity of Major Companies in China, 2015 (10000kW)
Total Installed Wind Power Capacity of Major Companies in China by the End of 2015 (10000kW)
Production Base Distribution of Major Global Wind Power Blade Companies, 2015
Global Wind Power Blade Demand, 2009-2016
Companies Out of Wind Power Blade Industry in Recent Years
China's Wind Power Blade Capacity and Capacity Utilization, 2010-2015
China's Wind Power Blade Demand, 2009-2020E
China's Wind Power Blade Sales Volume, 2013-2015
Technological Paths of Major Wind Power Blade Companies in China
Materials and Process Characteristics of Major Blade Companies in China
Product Line of Major Wind Power Blade Companies in China, 2015
Revenue and Profit of LM Wind Power, 2011-2015
Wind Power Blade Series of LM Wind Power, 2015
Distribution of LM Wind Power's Production Bases, 2015
Blade Output of LM Wind Power, 2010-2015
Wind Power Blade Factories of LM Wind Power in China, 2015
Distribution of Vestas' Production Bases, 2015
Wind Power Blade Production Bases of AVIC HuitengWindpower Equipment, 2016
Revenue and Net Income of AVIC HuitengWindpower Equipment, 2011-2016
Wind Power Blade Production Bases of Lianyungang ZhongfuLianzhong Composites Group, 2016
Revenue and Net Income of Sinoma Science & Technology, 2011-2016
Wind Power Blade Output and Sales Volume of Sinoma Science & Technology, 2012-2015
Capacities of Wind Power Blade Production Bases of Sinoma Science & Technology, 2015
Wind Power Blade Series of Sinoma Science & Technology, 2015
Wind Power Blade Revenue and Net Income of Sinoma Science & Technology, 2012-2015
Distribution of Wind Power Blade Bases of Zhuzhou Time New Material Technology, 2016
Major Economic Indicators of Shanghai FRP Research Institute, 2012-2015
Double-Fed Wind Generation System
Cost Structure of Typical Double-Fed Wind Turbine
Wind Power Gearbox Shipments of NGC, 2010-2020E
Revenue and Wind Power Gear Revenue of NGC, 2009-2016
Major Economic Indicators of CN GPOWER Gearbox 2014-2016
Revenue and Wind Power & Industrial Transmission Product Revenue of Hangzhou Advance Gearbox Group, 2009-2016
Wind Power Gearbox Output and Sales Volume of Hangzhou Advance Gearbox Group, 2013-2016
Wind Power Gearbox Revenue of Ningbo Donly, 2012-2016
Wind Tower Output and Sales Volume of Titan Wind Energy, 2012-2015
Operating Revenue of Titan Wind Energy (by Business), 2014-2015
Proposed Wind Power Development Projects of Titan Wind Energy, 2016
Global Distribution of CS Wind Corporation's Wind Tower Business
Wind Turbine Tower Output and Sales Volume of Shanghai Taisheng Wind Power Equipment, 2012-2016
Revenue and Net Income of Shanghai Taisheng Wind Power Equipment, 2011-2016
Operating Revenue of Shanghai Taisheng Wind Power Equipment (by Business), 2014-2016
Classification of Wind Power Converter
Cost Structure of Wind Power Converter
Sales Volume of Major Wind Power Converter Companies in China, 2015
Product Line of Major Wind Power Converter Companies in China
Supporting Relationship between Major Wind Turbine Companies and Converter Companies in China
China's Wind Power Converter Demand, 2009-2016
Operating Revenue of Sichuan Jiuzhou Electric Group (by Revenue), 2014-2015
Revenue and Net Income of Shanghai Hi-tech Control System, 1994-2015
Double-Fed Wind Power Converter Diagram of Delta Electronics
Full-Power Liquid-Cooled Wind Power Converter Diagram of Delta Electronics
Completed Wind Power Projects of Hopewind Electric as of April 2016
Operating Revenue of Beijing Corona Science & Technology (by Product), 2014-2015
Completed Wind Power Projects of Beijing Corona Science & Technology as of May 2016
Distribution of HRV Electric's Wind Power Converter Projects
Wind Power Converter Revenue and Shipments of Sungrow Power Supply, 2011-2015
Wind Power Converter Products of Beijing Nego Automation Technology, 2016
Demand for Wind Power Bearings in China, 2009-2015
Major Wind Power Bearing Producers in China
TIMKEN's Business Layout in China
Revenue and Net Income of Tianma Bearing Group, 2008-2015
Wind Power Density Distribution on 70-Meter-High Land of China
Average Wind Power Density Distribution on 5-20-Meter-Deep and 100-Meter-High Offshore of China
China's Wind Power Feed-in Metering and Structure, 2011-2016
Wind Turbine Suspension Volume and Rate in China, 2011-2016
Assessment Form for Guaranteed Minimum Purchased Annual Utilization Hours in Key Wind Power Areas of China, 2016
China's Onshore Wind Power Feed-in Tariffs (Benchmark Prices), 2016 & 2018
China's Offshore Wind Power Feed-in Tariffs (Benchmark Prices), 2016
Approval and Construction of 10 Large Wind Power Bases in China at the End of 2014
Construction Progress of Distributed Wind Power Projects in China at the End of 2014
Progress of Chinese Offshore Wind Power Projects (Development Scheme 2014-2016) by the End of July 2015
Schemes for Wind Power Development and Construction in China, 2016
New Installed Capacity of Chinese Wind Power Development Enterprises, 2015
Total Installed Capacity of Chinese Wind Power Development Enterprises, 2015
Revenue and Net Income of Vestas, 2009-2015
Handling Orders and Stock of Vestas (by Region), 2015
Global Wind Turbine Delivery of Vestas as of Dec 31, 2015
GE's Revenue, 2013-2016
GE's Renewable Energy Revenue and Profit, 2013-2015
Siemens' Revenue and Net Income, FY2014-FY2016
Siemens' Revenue and Profits from Wind Power and Renewables, FY2014-FY2016
Gamesa's Share in Global Wind Turbine Market, 2015
Gamesa's Revenue and Net Income, 2014-2016
Structure of Gamesa's New Orders (by Region), 2014-2015
Enercon's Share in Global and German Markets, 2015
Revenue and Net Income of Goldwind Science & Technology, 2009-2016
Revenue and Gross Margin of Goldwind Science & Technology (by Product), 2015
Installed Wind Farm Capacity of Goldwind Science & Technology, 2010-2015
Wind Turbine Sales Volume of Goldwind Science & Technology, 2012-2015
Handling Orders of Goldwind Science & Technology, 2011-2015
Revenue and Net Income of Sinovel Wind Group, 2009-2015
Production Bases of United Power
Revenue and Net Income of Dongfang Electric Corporation, 2009-2016
Wind Turbine Output of Dongfang Turbine, 2011-2015
Operating Revenue and Net Income of Mingyang Wind Power, 2010-2016
Output of Mingyang Wind Power, 2014-2015
Revenue and Net Income of Shanghai Electric, 2009-2016
Wind Power Bases of Shanghai Electric, 2016
Events of XEMC Windpower, 2010-2016
New Installed Wind Power Capacity of XEMC Windpower, 2012-2015
Global Business Layout of Envision Energy
Development History of Zhejiang Windey
Global and China's Total Installed Wind Power Capacity, 2015-2020E
Global and China's Total Installed Offshore Wind Power Capacity, 2015-2020E
Global and China CNC Machine Tool Industry Report, 2022-2027
As typical mechatronics products, CNC machine tools are a combination of mechanical technology and CNC intelligence. The upstream mainly involves castings, sheet metal parts, precision parts, function...
Global and China Hydraulic Industry Report, 2021-2026
Hydraulic components are key parts for mobile machineries including construction machinery, agricultural and forestry machinery, material handling equipment and commercial vehicle. The global construc...
China Motion Controller Industry Report, 2021-2026
The motion control system is the core component of intelligent manufacturing equipment, usually composed of controllers, motors, drivers, and human-computer interaction interfaces. Through the control...
Global and China Industrial Robot Servo Motor Industry Report, 2021-2026
As the actuator of control system, servo motor is one of the three crucial parts to industrial robot and its development is bound up with industrial robots. Given the slow progress of 3C electronics a...
Global and China Industrial Laser Industry Report, 2020-2026
As one of the most advanced manufacturing and processing technologies in the world, laser technology has been widely used in industrial production, communications, information processing, medical beau...
Global and China Mining-use Autonomous Driving Industry Report, 2020-2021
Demand and policies speed up landing of Autonomous Driving in Mining
Traditional mines have problems in recruitment, efficiency, costs, and potential safety hazards, while which can be solved by aut...
Autonomous Agricultural Machinery Research Report, 2020
Autonomous Agricultural Machinery Research: 17,000 sets of autonomous agricultural machinery systems were sold in 2020, a year-on-year increase of 188%
Autonomous agricultural machinery relies heavil...
Global and China CNC Machine Tool Industry Report, 2020-2026
As a typical type of mechatronic products, CNC machine tools combine mechanical technology with CNC intelligence. The upstream mainly involves castings, sheet weldments, precision parts, functional pa...
Global and China Hydraulic Industry Report, 2020-2026
Hydraulic parts, essential to modern equipment manufacturing, are mostly used in mobile machinery, industrial machinery and large-sized equipment. Especially, construction machinery consumes the overw...
Global and China Industrial Robot Speed Reducer Industry Report, 2020-2026
Controller, servo motor and speed reducer, three core components of industrial robot, technologically determine key properties of an industrial robot, such as work accuracy, load, service life, stabil...
Global and China Industrial Robot Servo Motor Industry Report, 2020-2026
As the actuator of control system, servo motor is one of the three crucial parts to industrial robot and its development is bound up with industrial robots. Given the agonizingly slow progress of 3C e...
Global and China Laser Processing Equipment Industry Report, 2020-2026
Laser processing which offers centralized and stable laser beams is applicable to high hardness, high melting point materials that are hard to be processed with traditional technologies. By purpose, l...
Global and China Forklift Industry Report, 2020-2026
In 2019, a total of 1,493,271 forklifts were sold worldwide, up 0.25% year on year, including 647,229 ones or 43.3% sold in Asia.
As the largest producer and seller of forklifts around the globe, Chi...
Global and China Injection Molding Machine Industry Report, 2020-2026
Injection molding machine plays a crucial role in plastics processing machinery, constituting 40% to 50% of the total output value of plastics processing machinery in China. In 2019, injection molding...
China Motion Controller Industry Report, 2019-2026
The motion control market is growing alongside machine tools, robotics, packaging machinery, semiconductors, electronics, among others, being vulnerable to fluctuations in downstream market. In 2018, ...
China Smart Meter Industry Report, 2020-2026
In 2019, instrument and meter companies (each with annual revenue over RMB20 million) in China collectively registered RMB724.26 billion in revenue and RMB70.04 billion in net income, up by 5.5% and 5...
Global and China Agricultural Machinery Industry Report, 2020-2026
Affected by insufficient demand for traditional products, adjustment of purchase subsidy policies, and lower prices of grain crops, China’s agricultural machinery sales remain a downward trend.
In 20...
Global and China Elevator Industry Report, 2019-2025
About 800,000 elevators were sold across the world in 2018, up 1% from a year ago thanks to the robust demand from China, India and the United States, and the ownership of elevators rose to virtually ...