China Bus Industry Report, 2019-2025
-
Jun.2019
- Hard Copy
- USD
$2,700
-
- Pages:150
- Single User License
(PDF Unprintable)
- USD
$2,500
-
- Code:
ZHP092
- Enterprise-wide License
(PDF Printable & Editable)
- USD
$3,900
-
- Hard Copy + Single User License
- USD
$2,900
-
China as the world’s largest bus manufacturer supplies nearly 50% buses in global market. In 2018, the country manufactured 489,000 buses, 7.0% less than in the previous year. China’s bus industry has made changes over the years, with output sliding at an annual average rate of 6.1% between 2015 and 2018. The downtrend in output will continue in 2019, due to lack of market dynamism. The “electric, global and high-end” buses will turn to be the driver for the Chinese bus market.
By product, coaches and public buses account for over 80% in China. In 2018, sales of all types of buses suffered a slump, apart from public buses which enjoyed a slight increase.
Public bus: in 2018, public bus market size reached roughly 100,000 units, on a par with what it was in 2015 and 2017 but much less than that in the peak year of 2016. It was a proof that bus market in China was still being redefined. Thereof, 8m/10m buses had become the mainstay of the market and would sustain growth.
Coach: in 2018, sales of this type of bus plummeted as other ways to travel such as high-speed trains, civil aircrafts, private cars and ride-hailing services were in vogue. Wherein, sales of medium and large-sized coaches dropped further while demand for light-sized ones remained relatively stable. There was a change in medium and large-sized coaches market structure that share of those for transporting general passengers waned, compared with a far more bigger proportion of those that were used in tourism and group tour. The rising domestic tourism market will provide a guarantee for the steady growth of medium and large-sized tourist coaches market.
With a range of favorable policies for new energy, new energy bus market will develop at a steady pace. According to auto insurance data, 110,000 new energy buses were sold in China in 2018, down by 7% and 2% versus 2017 and 2016, respectively. In the country, new energy buses, especially medium and large-sized ones which play a crucial role in urban public transit, are superior to diesel engine vehicles beset with huge crisis, in the wake of the launch of Blue Sky Protection Campaign, though subsidies for new energy vehicles are on the decline in 2019.
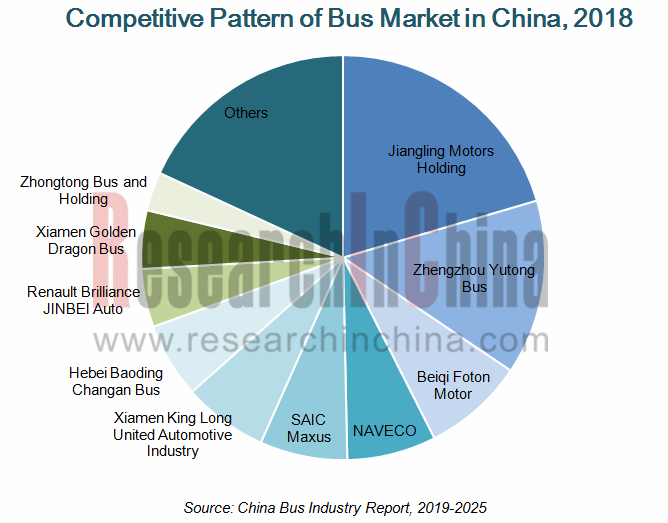
China’s bus industry features a stable competitive pattern and a high market concentration. In 2018, the top ten and the top five bus manufacturers dominated over 73% and 50% of the market, respectively. Yet among the ten largest makers, only SAIC Maxus and Xiamen Golden Dragon Bus sold more buses than the previous year in 2018, and the other eight all saw declining sales volume, especially Zhongtong Bus, Renault Brilliance JINBEI Auto and Beiqi Foton Motor whose sales dropped by a wider margin.
China Bus Industry Report, 2019-2025 highlights the following:
 Bus industry (definition, classification, development trends, policy, etc.);
China bus industry (output, sales, ownership, etc.);
China bus market segments (large, medium and light buses) (output and sales, competitive pattern, etc.);
China new energy bus market (output and sales, competitive pattern, policy, etc.);
China bus industry chain (raw materials market, downstream application market, etc.);
16 manufacturers (Yutong Bus, Zhongtong Bus, Xiamen King Long Motor Group, Dongfeng Motor Corporation, Beiqi Foton Motor, Jiangling Group, JAC, etc.) (profile, operation, output and sales, featured products, distribution and latest news of manufacturing bases, etc.).
1 Industry Overview
1.1 Introduction to Product
1.2 Product Classification
1.3 Policies
1.4 Active Safety and Connected Car
1.4.1 Policy and Planning
1.4.2 Technical Standards
1.4.3 Enterprises’ Layout
2 Chinese Bus Market
2.1 Market Size
2.2 Market Structure
2.3 Competitive Landscape
2.3.1 Market Share
2.3.2 Performance Comparison
2.4 Market Segments
2.4.1 Coach
2.4.2 Public Bus
2.4.3 School Bus
2.5 Natural-gas Bus
2.6 Export
3 Chinese Bus Market Segments
3.1 Large Bus
3.1.1 Market Size
3.1.2 Competitive Landscape
3.2 Medium-sized Bus
3.2.1 Market Size
3.2.2 Competitive Landscape
3.3 Light Bus
3.3.1 Market Size
3.3.2 Competitive Landscape
4 New Energy Bus Market
4.1 Market Size
4.2 Market Structure
4.3 Competitive Landscape
4.3 Industry Policies
4.3.1 Policies on Fiscal Subsidies
4.3.2 Policy of Cutting Subsidies for Diesel Oil and Increasing Subsidies for Electric Bus
4.3.3 Promotion and Assessment Methods
4.4 Technical Routes
4.5 Fuel-cell Bus
5 Bus Market Industry Chain
5.1 Upstream Raw Material Market
5.2 Key Components
5.2.1 Transmission
5.2.2 Wheel
5.2.3 New Energy Battery
5.3 Downstream Demand Market
5.3.1 Passenger Transport
5.3.2 High-speed Rail
5.3.3 Tourism
6 Major Enterprises
6.1 Zhengzhou Yutong Bus Co., Ltd.
6.1.1 Profile
6.1.2 Financial Position
6.1.3 Operating Revenue Structure
6.1.4 Output and Sales
6.1.5 New Energy Bus
6.1.6 Production Capacity
6.1.7 R&D Costs
6.1.8 Cost Structure
6.1.9 Components & Parts
6.1.10 Developments
6.1.11 Operational Prospects
6.2 Xiamen King Long Motor Group
6.2.1 Profile
6.2.2 Financial Position
6.2.3 Operating Revenue Structure
6.2.4 Operation of Major Subsidiaries
6.2.5 Output and Sales
6.2.6 New Energy Bus
6.2.7 Production Capacity
6.2.8 R&D Costs
6.2.9 Cost Structure
6.2.10 Developments
6.2.11 Operational Prospects
6.3 Zhongtong Bus and Holding Co., Ltd.
6.3.1 Profile
6.3.2 Financial Position
6.3.3 Operating Revenue Structure
6.3.4 Output and Sales
6.3.5 New Energy Bus
6.3.6 R&D Costs
6.3.7 Cost Structure
6.3.8 Developments
6.3.9 Operational Prospects
6.4 Beiqi Foton Motor Co., Ltd.
6.4.1 Profile
6.4.2 Financial Position
6.4.3 Operating Revenue Structure
6.4.4 Output and Sales
6.4.5 New Energy Bus
6.4.6 Production Capacity
6.4.7 R&D Costs
6.4.8 Operational Prospects
6.5 Anhui Ankai Automobile Co., Ltd.
6.5.1 Profile
6.5.2 Financial Position
6.5.3 Operating Revenue Structure
6.5.4 Output and Sales
6.5.5 New Energy Bus
6.5.6 Production Capacity
6.5.7 R&D Costs
6.5.8 Cost Structure
6.6 Liaoning SG Automotive Group Co., Ltd.
6.6.1 Profile
6.6.2 Financial Position
6.6.3 Operating Revenue Structure
6.6.4 Output and Sales
6.6.5 New Energy Business
6.6.6 Cost Structure
6.7 Yangzhou Asiastar Bus Co., Ltd.
6.7.1 Profile
6.7.2 Financial Position
6.7.3 Operating Revenue Structure
6.7.4 Output and Sales
6.7.5 New Energy Bus
6.7.6 R&D Costs
6.7.7 Cost Structure
6.8 BYD
6.8.1 Profile
6.8.2 Financial Position
6.8.3 Operating Revenue Structure
6.8.4 Output and Sales
6.8.5 New Energy Bus
6.8.6 Developments
6.9 Anhui Jianghuai Automobile Co., Ltd.
6.9.1 Profile
6.9.2 Financial Position
6.9.3 Operating Revenue Structure
6.9.4 Output and Sales
6.9.5 R&D Costs
6.9.6 Cost Structure
6.9.7 Operational Prospects
6.10 Shenyang Jinbei Automotive Co., Ltd.
6.10.1 Profile
6.10.2 Financial Position
6.10.3 Operating Revenue Structure
6.10.4 Output and Sales
6.10.5 R&D Costs
6.10.6 Cost Structure
6.10.7 Operational Prospects
6.11 Jiangling Motors Co., Ltd.
6.11.1 Profile
6.11.2 Financial Position
6.11.3 Operating Revenue Structure
6.11.4 Output and Sales
6.11.5 R&D Costs
6.11.6 Operational Prospects
6.12 Dongfeng Motor Corporation
6.12.1 Profile
6.12.2 Financial Position
6.12.3 Operating Revenue Structure
6.12.4 Output and Sales
6.12.5 R&D Costs
6.12.6 Cost Structure
6.12.7 Operational Prospects
6.13 NAVECO Ltd.
6.13.1 Profile
6.13.2 Output and Sales
6.13.3 Developments
6.14 Hebei Baoding Changan Bus Co., Ltd.
6.14.1 Profile
6.14.2 Output and Sales
6.14.3 Developments
6.15 SAIC Maxus Co., Ltd.
6.15.1 Profile
6.15.2 Output and Sales
6.15.3 New Energy Business
6.15.4Developments
6.16 Fujian New Forta Automobile Co., Ltd.
6.16.1 Profile
6.16.2 Output and Sales
Intelligent Operational Systems of Major Bus Enterprises in China
China’s Bus Output and Sales, 2005-2025E
Monthly Sales of Buses in China, 2016-2018
Monthly Sales of Conventional Buses in China, 2016-2018
Sales of 3.5m-above Buses in China, 2013-2018
Chinese Bus Market Structure, 2005-2025E
Monthly Sales of Buses by Product in China, 2016-2018
TOP10 Bus Enterprises in China, 2014
Top10 Bus Enterprises in China, 2015
Top10 Bus Enterprises in China, 2016
Top10 Bus Enterprises in China, 2017
Top10 Bus Enterprises in China, 2018
Revenue of Major Bus Enterprises in China, 2014-2018
Net Income of Major Bus Enterprises in China, 2014-2018
Gross Margin of Major Bus Enterprises in China, 2014-2018
Bus Sales Structure in China by Application, 2018
Sales of Large and Medium-sized Coaches in China, 2010-2019
Chinese Large and Medium-sized Coach Market Structure by Application, 2010-2019
Sales of Large and Medium-sized Passenger Buses in China, 2010-2019
Product Mix of Passenger Buses in China, 2015&2018
Public Bus Sales in China, 2014-2018
Public Bus Sales of Major Manufacturers, 2017-2018
School Bus Sales in China, 2009-2018
Natural-gas Bus Sales in China, 2014-2018
China’s Bus Exports and Growth Rate, 2015-2018
Exports of Major Bus Exporters in China, 2018
China’s Bus Sales by Model, 2017-2018
Large Bus and Chassis Output in China, 2005-2025E
Large Bus and Chassis Sales in China, 2005-2025E
Top10 Large Bus Makers in China, 2014
Market Share of Large Bus Chassis Enterprises in China, 2014
Top10 Large Bus Makers in China, 2015
Market Share of Large Bus Chassis Enterprises in China, 2015
Top10 Large Bus Makers in China, 2016
Market Share of Large Bus Chassis Enterprises in China, 2016
Top10 Large Bus Makers in China, 2017
Market Share of Large Bus Chassis Enterprises in China, 2017
Top10 Large Bus Makers in China, 2018
Market Share of Large Bus Chassis Enterprises in China, 2018
Medium-sized Bus and Chassis Output in China, 2005-2025E
Medium-sized Bus and Chassis Sales in China, 2005-2025E
Top10 Medium-sized Bus Makers in China, 2014
Market Share of Medium-sized Bus Chassis Enterprises in China, 2014
Top10 Medium-sized Bus Makers in China, 2015
Market Share of Medium-sized Bus Chassis Enterprises in China, 2015
Top10 Medium-sized Bus Makers in China, 2016
Market Share of Medium-sized Bus Chassis Enterprises in China, 2016
Top10 Medium-sized Bus Makers in China, 2017
Market Share of Medium-sized Bus Chassis Enterprises in China, 2017
Top10 Medium-sized Bus Makers in China, 2018
Market Share of Medium-sized Bus Chassis Enterprises in China, 2018
Light Bus and Chassis Output in China, 2005-2025E
Light Bus and Chassis Sales in China, 2005-2025E
Top10 Light Bus Makers in China, 2014
Market Share of Light Bus Chassis Enterprises in China, 2014
Top10 Light Bus Makers in China, 2015
Market Share of Light Bus Chassis Enterprises in China, 2015
Top10 Light Bus Makers in China, 2016
Market Share of Light Bus Chassis Enterprises in China, 2016
Top10 Light Bus Makers in China, 2017
Market Share of Light Bus Chassis Enterprises in China, 2017
Top10 Light Bus Makers in China, 2018
Market Share of Light Bus Chassis Enterprises in China, 2018
New Energy Bus Output in China, 2016-2018
Monthly Sales of New Energy Buses, 2016-2019
Monthly Sales of New Energy Buses by Product, 2016-2018
Application Structure of New Energy Bus, 2016-2019
New Energy Bus Sales Structure by City in China, 2018-2019
Top20 New Energy Bus Makers in China by Output, 2016-2018
Sales of 6m-above New Energy Buses in China, 2018
Top20 Battery Electric Bus Makers in China by Output, 2016-2018
Top20 Plug-in Hybrid Bus Makers in China by Output, 2016-2018
Changes in National Subsides for Non-fast-charge Battery Electric Buses, 2017-2019
Technical Performance and Specification for Electric Buses with Different Technology Roadmap
Toyota’s Fuel Cell Bus
Raw Material Costs of Major Bus Makers in China, 2014-2018
Market Share of Major Commercial Vehicle Transmission Producers in China
Major Suppliers of Commercial Vehicle Transmission in China
Wheel Hub Suppliers of Major Bus Makers in China
China’s Power Lithium Battery Manufacturers and Supported Models
Highway Passenger Transportation in China, 2004-2018
High-speed Rail Mileage in China, 2013-2018
Total Tourism Revenue in China, 2001-2018
Number of Tourists during the Chinese Golden Week Holiday, 2008-2018
Main Financial Indicators of Yutong Bus, 2012-2018
Gross Margin of Yutong Bus, 2007-2018
Operating Revenue Structure of Yutong Bus by Business, 2013-2018
Operating Revenue Structure of Yutong Bus by Region, 2013-2018
Output and Sales of Yutong Bus by Product, 2012-2018
Sales Structure of Yutong Bus, 2007-2018
Exports of Yutong Bus, 2014-2018
New Energy Bus Output of Yutong Bus, 2014-2018
New Energy Bus Sales of Yutong Bus, 2012-2018
Monthly Sales of New Energy Buses of Yutong Bus, 2017-2019
New Energy Bus Sales of Yutong Bus by Type, 2015-2018
R&D Costs of Yutong Bus, 2009-2018
Product Cost Structure of Yutong Bus, 2014-2018
Revenue, Net Income, and Gross Margin of Yutong Bus, 2015-2025E
Main Financial Indicators of Xiamen King Long Motor Group, 2012-2018
Operating Revenue and Gross Margin of Xiamen King Long Motor Group's Major Products, 2015-2018
Operating Revenue Structure of Xiamen King Long Motor Group by Region, 2013-2018
Revenue and Net Income of Major Subsidiaries of Xiamen King Long Motor Group, 2014-2018
Bus Output of Subsidiaries of Xiamen King Long Motor Group, 2012-2018
Bus Sales of Subsidiaries of Xiamen King Long Motor Group, 2012-2018
Truck Output and Sales of Xiamen King Long Motor Group, 2012-2018
New Energy Bus Output of Xiamen King Long Motor Group, 2014-2018
New Energy Bus Sales of Xiamen King Long Motor Group by Length, 2015-2018
New Energy Bus Sales of Xiamen King Long Motor Group by Application, 2015-2018
Percentage of Key Parts Purchased by Xiamen King Long Motor Group for New Energy Bus
Xiamen King Long Motor Group’s Capacity by Enterprise, 2018
Xiamen King Long Motor Group’s Capacity by Model, 2018
R&D Costs of Xiamen King Long Motor Group, 2010-2018
Cost Structure of Xiamen King Long Motor Group, 2013-2018
Revenue, Net Income, and Gross Margin of Xiamen King Long Motor Group, 2015-2025E
Main Financial Indicators of Zhongtong Bus, 2012-2018
Operating Revenue Structure of Zhongtong Bus by Business, 2013-2018
Operating Revenue Structure of Zhongtong Bus by Region, 2013-2018
Output and Sales of Zhongtong Bus, 2012-2018
New Energy Bus Output of Zhongtong Bus, 2014-2018
Suppliers of New Energy Bus of Zhongtong Bus
R&D Costs of Zhongtong Bus, 2012-2018
Cost Structure of Zhongtong Bus, 2013-2018
Revenue, Net Income, and Gross Margin of Zhongtong Bus, 2015-2025E
Main Financial Indicators of Beiqi Foton Motor, 2010-2018
Operating Revenue Structure of Beiqi Foton Motor by Business, 2014-2018
Operating Revenue Structure of Beiqi Foton Motor by Region, 2013-2018
Bus Output and Sales of Beiqi Foton Motor by Type, 2012-2018
New Energy Bus Output of Beiqi Foton Motor, 2014-2018
Major Suppliers of New Energy Bus of Beiqi Foton Motor
New Energy Bus Sales of FOTON AUV, 2013-2018
R&D Costs of Beiqi Foton Motor, 2010-2018
Revenue, Net Income, and Gross Margin of Beiqi Foton Motor, 2015-2025E
Financial Indicators of Anhui Ankai Automobile, 2012-2018
Operating Revenue Structure of Anhui Ankai Automobile by Business, 2015-2018
Operating Revenue Structure of Anhui Ankai Automobile by Region, 2013-2018
Output and Sales of Anhui Ankai Automobile, 2012-2018
New Energy Bus Output of Anhui Ankai Automobile, 2014-2018
Core Suppliers for Electric Bus of Ankai
Capacity Layout of Bus (Including New Energy Bus) of Anhui Ankai Automobile, 2018
R&D Costs of Anhui Ankai Automobile, 2010-2018
Cost Structure of Anhui Ankai Automobile, 2015-2018
Financial Indicators of SG Automotive Group, 2012-2018
Operating Revenue Structure of SG Automotive Group by Business, 2013-2018
Operating Revenue Structure of SG Automotive Group by Region, 2013-2018
Huanghai Bus Output and Sales Volume of SG Automotive Group, 2012-2018
Huanghai New Energy Bus Output of SG Automotive Group, 2014-2018
Cost Structure of SG Automotive Group, 2014-2018
Financial Indicators of Asiastar Bus, 2012-2018
Operating Revenue Structure of Asiastar Bus by Business, 2013-2018
Operating Revenue Structure of Asiastar Bus by Region, 2013-2018
Output and Sales of Asiastar, 2012-2018
New Energy Bus Sales Volume of Asiastar, 2014-2018
Asiastar’s Income from New Energy Bus Subsidies, 2015-2018
R&D Costs of Asiastar, 2010-2018
Cost Structure of Asiastar, 2014-2018
Financial Indicators of BYD, 2012-2018
Operating Revenue Structure of BYD by Business, 2013-2018
Operating Revenue Structure of BYD by Region, 2015-2018
Bus Output and Sales Volume of BYD, 2012-2018
Main New Energy Buses of BYD
Capacity and Output of BYD’s Major New Energy Bus Bases, 2018
Key Orders of BYD, 2018
Financial Indicators of JAC, 2012-2018
Operating Revenue Structure of JAC by Business, 2015-2018
Operating Revenue Structure of JAC by Region, 2013-2018
Bus Output and Sales of JAC, 2012-2018
R&D Costs of JAC, 2010-2018
Cost Structure of JAC, 2018
Revenue, Net Income, and Gross Margin of JAC, 2014-2025E
Financial Indicators of Jinbei Auto, 2012-2018
Operating Revenue Structure of Jinbei Auto by Business, 2013-2018
Operating Revenue Structure of Jinbei Auto by Region, 2013-2018
Commercial Vehicle Output and Sales of Jinbei Auto, 2012-2018
R&D Costs of Jinbei Auto, 2012-2018
Cost Structure of Jinbei Auto, 2014-2018
Revenue, Net Income, and Gross Margin of Jinbei Auto, 2015-2025E
Financial Indicators of JMC, 2012-2018
Operating Revenue Structure of JMC by Business, 2013-2018
Bus Output and Sales of JMC, 2012-2018
R&D Costs of JMC, 2010-2018
Revenue, Net Income, and Gross Margin of JMC, 2015-2025E
Financial Indicators of Dongfeng Motor, 2012-2018
Operating Revenue Structure of Dongfeng Motor by Business, 2013-2018
Operating Revenue Structure of Dongfeng Motor by Region, 2013-2018
Bus Output and Sales of Dongfeng Motor, 2012-2018
R&D Costs of Dongfeng Motor, 2010-2018
Cost Structure of Dongfeng Motor, 2014-2018
Revenue, Net Income, and Gross Margin of Dongfeng Motor, 2015-2025E
Bus Output and Sales of SAIC MAXUS, 2012-2018
Capacity of SAIC MAXUS (including New Energy), 2018
Ongoing Projects of SAIC MAXUS, 2018
New Energy Vehicle Output, Sales Volume, and Revenue of SAIC MAXUS, 2015-2018
Global and China CNC Machine Tool Industry Report, 2022-2027
As typical mechatronics products, CNC machine tools are a combination of mechanical technology and CNC intelligence. The upstream mainly involves castings, sheet metal parts, precision parts, function...
Global and China Hydraulic Industry Report, 2021-2026
Hydraulic components are key parts for mobile machineries including construction machinery, agricultural and forestry machinery, material handling equipment and commercial vehicle. The global construc...
China Motion Controller Industry Report, 2021-2026
The motion control system is the core component of intelligent manufacturing equipment, usually composed of controllers, motors, drivers, and human-computer interaction interfaces. Through the control...
Global and China Industrial Robot Servo Motor Industry Report, 2021-2026
As the actuator of control system, servo motor is one of the three crucial parts to industrial robot and its development is bound up with industrial robots. Given the slow progress of 3C electronics a...
Global and China Industrial Laser Industry Report, 2020-2026
As one of the most advanced manufacturing and processing technologies in the world, laser technology has been widely used in industrial production, communications, information processing, medical beau...
Global and China Mining-use Autonomous Driving Industry Report, 2020-2021
Demand and policies speed up landing of Autonomous Driving in Mining
Traditional mines have problems in recruitment, efficiency, costs, and potential safety hazards, while which can be solved by aut...
Autonomous Agricultural Machinery Research Report, 2020
Autonomous Agricultural Machinery Research: 17,000 sets of autonomous agricultural machinery systems were sold in 2020, a year-on-year increase of 188%
Autonomous agricultural machinery relies heavil...
Global and China CNC Machine Tool Industry Report, 2020-2026
As a typical type of mechatronic products, CNC machine tools combine mechanical technology with CNC intelligence. The upstream mainly involves castings, sheet weldments, precision parts, functional pa...
Global and China Hydraulic Industry Report, 2020-2026
Hydraulic parts, essential to modern equipment manufacturing, are mostly used in mobile machinery, industrial machinery and large-sized equipment. Especially, construction machinery consumes the overw...
Global and China Industrial Robot Speed Reducer Industry Report, 2020-2026
Controller, servo motor and speed reducer, three core components of industrial robot, technologically determine key properties of an industrial robot, such as work accuracy, load, service life, stabil...
Global and China Industrial Robot Servo Motor Industry Report, 2020-2026
As the actuator of control system, servo motor is one of the three crucial parts to industrial robot and its development is bound up with industrial robots. Given the agonizingly slow progress of 3C e...
Global and China Laser Processing Equipment Industry Report, 2020-2026
Laser processing which offers centralized and stable laser beams is applicable to high hardness, high melting point materials that are hard to be processed with traditional technologies. By purpose, l...
Global and China Forklift Industry Report, 2020-2026
In 2019, a total of 1,493,271 forklifts were sold worldwide, up 0.25% year on year, including 647,229 ones or 43.3% sold in Asia.
As the largest producer and seller of forklifts around the globe, Chi...
Global and China Injection Molding Machine Industry Report, 2020-2026
Injection molding machine plays a crucial role in plastics processing machinery, constituting 40% to 50% of the total output value of plastics processing machinery in China. In 2019, injection molding...
China Motion Controller Industry Report, 2019-2026
The motion control market is growing alongside machine tools, robotics, packaging machinery, semiconductors, electronics, among others, being vulnerable to fluctuations in downstream market. In 2018, ...
China Smart Meter Industry Report, 2020-2026
In 2019, instrument and meter companies (each with annual revenue over RMB20 million) in China collectively registered RMB724.26 billion in revenue and RMB70.04 billion in net income, up by 5.5% and 5...
Global and China Agricultural Machinery Industry Report, 2020-2026
Affected by insufficient demand for traditional products, adjustment of purchase subsidy policies, and lower prices of grain crops, China’s agricultural machinery sales remain a downward trend.
In 20...
Global and China Elevator Industry Report, 2019-2025
About 800,000 elevators were sold across the world in 2018, up 1% from a year ago thanks to the robust demand from China, India and the United States, and the ownership of elevators rose to virtually ...