Global and China Titanium Dioxide Industry Report, 2016-2020
-
Aug.2016
- Hard Copy
- USD
$2,600
-
- Pages:155
- Single User License
(PDF Unprintable)
- USD
$2,400
-
- Code:
ZHP044
- Enterprise-wide License
(PDF Printable & Editable)
- USD
$3,700
-
- Hard Copy + Single User License
- USD
$2,800
-
Titanium dioxide is one of the best white pigments on the market in terms of performance. Over the past decade, the global titanium dioxide market has been growing steadily, with an AAGR of about 5.0%. In 2015, the global titanium dioxide market size hit EUR10.17 billion, up 3.7% year on year. In 2016-2020, the global market size is expected to present a CAGR of around 4.5% and reach nearly EUR13 billion in 2020.
China is one of major producing countries of titanium dioxide worldwide. In 2015, China produced 2.323 million tons of titanium dioxide, down 4.6% year on year. Due to falling prices, shrinking demand and fierce market competition, China’s output of titanium dioxide has declined for the first time in the past five years. However, the annual output is expected to climb up in 2016 thanks to rising product prices and the rebounding market.
By production process, titanium dioxide preparation is divided into two main methods: sulfuric acid and chlorination, wherein the titanium dioxide made from chlorination process shows better performance. China’s capacity from chlorination process only accounts for 6.5% of the total capacity, far below the global average of 49%. Therefore, Chinese companies represented by Henan Billions Chemicals, Pangang Group Vanadium Titanium & Resources and Luohe City Xingmao Titanium Industry are stepping up the building of the related capacity.
Chemours, the world's largest manufacturer of titanium dioxide, completely (100%) adopts chlorination process. In 2015, the titanium dioxide business triggered the revenue of USD1.8 billion, of which 32% came from the Asia-Pacific region. Starting from August 2015, the company shut down Edge Moor Plant and Johnsonville Plant’s No. 3 titanium dioxide production line, while centralized titanium dioxide production in the factories with cutting-edge technologies.
Huntsman holds both sulphurationand chlorination methods, but chlorination process only contributes 1/4. Because of the deteriorated titanium dioxide performance over recent years, the company closed a titanium dioxide plant in South Africa in July 2016, sold three Europe-based additive factories to Innospec in August 2016, so as to strip the titanium dioxide business entirely.
Henan Billions Chemicals became China's largest manufacturer of titanium dioxide after acquiring Sichuan Lomon, with the annual capacity of 610,000 tons (including 60,000 tons of titanium dioxide produced by chlorination process). In July 2016, the company and Allightec Co., Ltd. signed a "framework agreement" to reach a long-term partnership in the field of functional titanium dioxide, lithium titanate functional modifications, zirconium structure functional materials, aerospace wave-absorbing coating materials and the like.
Pangang Group Vanadium Titanium & Resources produced 85,000 tons and sold 80,000 tons of titanium dioxide in 2015, with a sales-output rate of 93.8%. It invested RMB110 million in building a 15kt/a chlorination process titanium dioxide oxidation test equipment project in December 2015, and the project is planned to be put into trial operation at the end of December 2016.
Capacity of Major Titanium Dioxide Manufacturers in China, As of June 2016
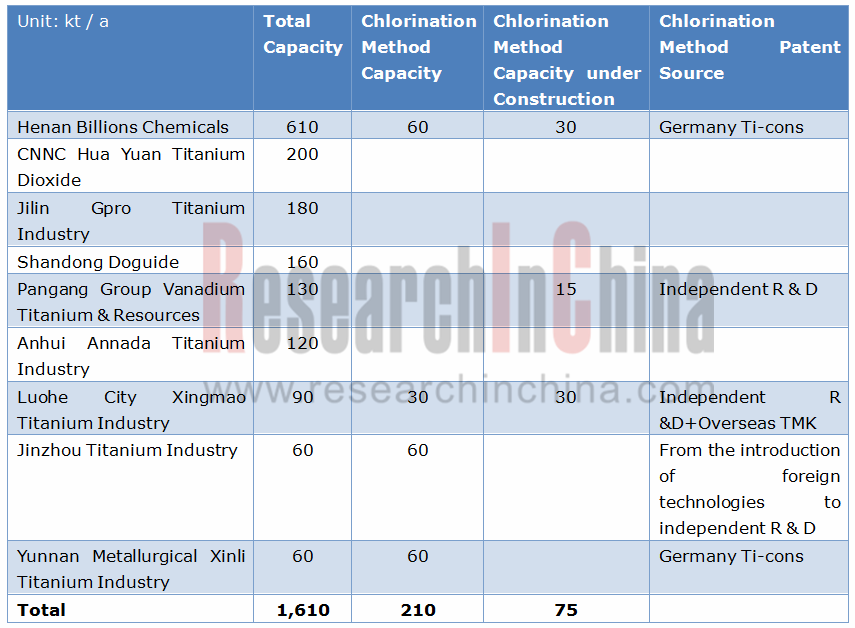
Source: ResearchInChina
From the perspective of applications, titanium dioxide has been used in some emerging fields apart from traditional applications such as coatings, plastics, paper making, etc., which brings new market opportunities to enterprises.
Automobile - Polycarbonate (automotive lightweight material) uses titanium dioxide for surface modification to improve scratch resistance eventually;
Artificial bones and joints - The titanium alloy covered with a layer of mesoporous-structure titanium dioxide on surface is ideal for artificial bones and joints;
Food additives - Nano titanium dioxide can boost the body's absorption as a food additive;
Batteries - Nano titanium dioxide can accelerate charging compared with the graphite electrodes of lithium batteries;
Optical microscopes - Super-lenses made of nano titanium dioxide particles can significantly heighten the resolution of optical microscopes;
Environmental protection - Nano titanium dioxide catalyst can decompose of polychlorinated biphenyls in industrial waste water;
Medical - Nano titanium dioxide can deactivate cancer cells.
Global and China Titanium Dioxide Industry Report, 2016-2020 highlights the followings:
 Development environment, market size, market structure, competitive landscape and so on of global titanium dioxide industry;
Development environment, supply, demand, market structure, competitive pattern, import& export, market prices, etc. of China’s titanium dioxide industry;
Development of the upstream titanium tetrachloride, high titanium slag, titanium ores, sulfuric acid, chlorine and others;
Applications and market situation of the downstream paint, plastics, paper making, denitration, titanium alloy, electronic materials, cosmetics, medicine and other fields;
Operation, titanium dioxide business, development in China, etc. of 15 key Chinese titanium dioxide producers and 5 major titanium dioxide players in the world.
1. Overview of Titanium Dioxide
1.1 Definition
1.2 Classification
1.3 Production Process
1.4 Industry Chain
2. Global Titanium Dioxide Industry
2.1 Development Environment
2.2 Market Size
2.2.1 Global
2.2.2 USA
2.3 Market Structure
2.4 Competition
2.4.1 Merger and Integration
2.4.2 Market Pattern
3. China Titanium Dioxide Industry
3.1 Development Environment
3.1.1 Industrial Policies
3.1.2 Policies on Import and Export
3.2 Market Size
3.2.1 Supply
3.2.2 Demand
3.3 Market Structure
3.3.1 Product Structure
3.3.2 Application Structure
3.3.3 Regional Structure
3.4 Competitive Pattern
3.4.1 Titanium Dioxide
3.4.2 Nano Titanium Dioxide
3.5 Import and Export
3.5.1 Import
3.5.2 Export
3.6 Price Trends
4. Industry Chain – Upstream
4.1 Titanium
4.1.1 Titanium Tetrachloride
4.1.2 High Titanium Slag
4.1.3 Titanium Ore
4.2 Sulfuric Acid
4.2.1 Market Size
4.2.2 Market Price
4.3Chlorine
5. Industry Chain—Downstream
5.1 Paint
5.1.1 Demand for TiO2
5.1.2 Market
5.2 Plastic Industry
5.3 Papermaking Industry
5.4 Denitration catalyst
5.4.1 Demand for TiO2
5.4.2 Market
5.5 Titanium Alloy
5.5.1 Application of Titanium Dioxide in Titanium Alloy
5.5.2 Market Situation
5.6 Others
5.6.1 Electronic Materials
5.6.2 Cosmetics
5.6.3 Medicine, Hygiene and Food Processing
5.6.4 Environmental Protection
6. Key Titanium Dioxide Enterprises in China
6.1 Henan Billions Chemicals Co., Ltd.
6.1.1 Profile
6.1.2 Operation
6.1.3 Revenue Structure
6.1.4 Gross Margin
6.1.5 R & D and Investment
6.1.6 Titanium Dioxide Business
6.1.7 Performance Forecast
6.2 CNNC Hua Yuan Titanium Dioxide Co., Ltd.
6.2.1 Profile
6.2.2 Operation
6.2.3 Revenue Structure
6.2.4 Gross Margin
6.2.5 R & D and Investment
6.2.6 Titanium Dioxide Business
6.2.7 Competitive Advantage
6.2.8 Performance Forecast
6.3 Shandong Doguide Group Co., Ltd.
6.3.1 Profile
6.3.2 Titanium Dioxide Business
6.4 Jilin Gpro Titanium Industry Co., Ltd.
6.4.1 Profile
6.4.2 Operation
6.4.3 Revenue Structure
6.4.4 Gross Margin
6.4.5 R & D and Investment
6.4.6 Titanium Dioxide Business
6.4.7 Competitive Advantage
6.4.8 Performance Forecast
6.5 Anhui Annada Titanium Industry Co., Ltd.
6.5.1 Profile
6.5.2 Operation
6.5.3 Revenue Structure
6.5.4 Gross Margin
6.5.5 R & D and Investment
6.5.6 Titanium Dioxide Business
6.5.7 Competitive Advantage
6.5.8 Performance Forecast
6.6 Pangang Group Vanadium Titanium & Resources Co., Ltd.
6.6.1 Profile
6.6.2 Operation
6.6.3 Revenue Structure
6.6.4 Gross Margin
6.6.5 R & D and Investment
6.6.6 TiO2 Business
6.6.7 Competitive Advantage
6.6.8 Performance Forecast
6.7 Yunnan Dahutong Industry & Trading Co., Ltd.
6.7.1 Profile
6.7.2 Development Course
6.7.3 Sales Network
6.8 Guangxi Jinmao Titanium Co., Ltd.
6.8.1 Profile
6.8.2 Capacity
6.8.3 Marketing Network
6.9 Others
6.9.1 Luohe City Xingmao Titanium Industry Co., Ltd.
6.9.2 Ningbo Xinfu Titanium Dioxide Co., Ltd
6.9.3 Shandong Jinhai Titanium Resources Technology Co., Ltd.
6.9.4 Shandong DAWN Titanium Industry Co., Ltd.
6.9.5 Jinan Yuxing Chemical Co, Ltd.
6.9.6 Jiangsu Taibai Group Co., Ltd.
6.9.7 Blue Star New Chemical Materials Co., Ltd. Guangxi Branch
7. Key Foreign Titanium Dioxide Enterprises
7.1 Chemours
7.1.1 Profile
7.1.2 Operation
7.1.3 TiO2 Business
7.1.4 Development Plan
7.1.5 Development in China
7.2 Huntsman
7.2.1 Profile
7.2.2 Operation
7.2.3 Titanium Dioxide Business
7.2.4 Dynamics
7.2.5 Strategy
7.2.6 Development in China
7.3 Kronos
7.3.1 Profile
7.3.2 Operation
7.3.3 Titanium Dioxide Business
7.4 Tronox
7.4.1 Profile
7.4.2 Operation
7.4.3 Titanium Dioxide Business
7.4.4 Development in China
7.5 Cristal
7.5.1 Profile
7.5.2 TiO2 Business
8. Market Overview and Development Forecast
8.1 Market
8.2 Enterprises
Classification of Titanium Dioxide
Sulphate Production Process
Chloride Production Process
Industry Chain of Titanium Dioxide
Global Titanium Dioxide Market Size, 2014-2020E
Global Titanium Dioxide Capacity, 2008-2020E
Global Titanium Dioxide (by Countries) Capacity Structure, 2015
USA’s Titanium Dioxide Output, 2011-2020E
USA’s Titanium Dioxide Consumption, 2011-2020E
USA’s Titanium Dioxide Application Structure, 2015
Global TiO2 Capacity Structure (by Production Routes), 2015
Proportion of Chloride TiO2 Capacity of Major Global TiO2 Producers, 2015
Global Titanium Dioxide Demand Structure, 2015
Integration Process in Global Titanium Dioxide Industry in the Past Twenty Years
Competitive Pattern of Global Titanium Dioxide Market, 2016
Policies and Standards on Chinese Titanium Dioxide Industry, 2005-2016
Unit Product Energy Consumption Indicators of China’s Titanium Dioxide Production Equipment
Access Conditions to China's Titanium Dioxide Industry
Policies on Titanium Dioxide Import in China
Capacity Development of Chinese TiO2 Producers
Titanium Dioxide Capacity in China, 2010-2020E
Capacity of Major Titanium Dioxide Manufacturers in China, As of June 2016
Titanium Dioxide Output in China, 2008-2020E
Output of Rutile Titanium Dioxide and % of Total Output in China, 2008-2020E
Apparent Consumption of Titanium Dioxide and Growth Rate in China, 2007-2020E
China’s Titanium Dioxide Capacity Structure (by Production Process), As of June 2016
China’s Titanium Dioxide Output Structure (by Product), 2015
China’s Titanium Dioxide Demand Structure, 2015
China’s Titanium Dioxide Capacity Structure (by Region), As of June 2016
Competitive Pattern of Chinese Titanium Dioxide Market, 2015
Capacity of Major Chlorination Process Titanium Dioxide Enterprises in China, 2016
Average Import and Export Prices of Titanium Dioxide in China, 2010-2016
Import Volume of Titanium Dioxide in China, 2008-2016
China’s Titanium Dioxide Import Volume Structure (by Region), 2015
Export Volume of Titanium Dioxide in China, 2008-2016
Titanium Dioxide Export in China (by Destinations), 2015
China’s Rutile-based Titanium Dioxide Price, 2015
China’s Anatase Titanium Dioxide Price, 2013-2016
China’s Rutile-based Titanium Dioxide Price, 2016
Production Cost Structure of TiO2 Business of Jilin Gpro Titanium, 2015
Output of China’s Top Three Titanium Tetrachloride Origins, 2015
Titanium Tetrachloride Price in China, 2015
Output of China’s Top Three High Titanium Slag Origins, 2015
High Titanium Slag Price in China, 2015
Ilmenite Reserves in the World (by Country), 2015
Rutile Reserves in the World (by Country), 2015
Output of Ilmenite in the World (By Country), 2014-2015
Output of Rutile in the World (By Country), 2014-2015
Distribution of Titanium Ore Resources in China
Import Volume of Titanium Ores and Concentrates in China, 2006-2015
Major Import Sources of China’s Titanium Ore, 2015
Major Titanium Ore Import Enterprises in China, 2015
Major Export Destinations of China’s Titanium Ore, 2015
Global Market Prices of Major Titanium Concentrate Products, 2015
Sulfuric Acid Output in China, 2005-2016
China’s Sulfuric Acid Market Price, 2014-2016
China’s Sulfuric Acid Chlorine Market Price, 2015-2016
Application Contrast of Home-made TiO2 and Imported TiO2 in Paint Segment Markets
Output Value and Growth Rate of China’s Paint Industry, 2004-2016
Paint Output in China, 2006-2016
Paint Output Structure (by Region) in China, 2015
Plastic Product Output in China, 2005-2016
Plastic Output Structure (by Product) in China, 2015
Output of Machine-made Paper and Paperboard in China, 2005-2016
Output of China’s Top Ten Papermaking Enterprises, 2014-2015
Nanometer Titanium Dioxide Consumption in China, 2011-2016
China’s SCR Denitration Catalyst Demand, 2010-2016
China’s SCR Denitration Catalyst Demand (by Type), 2010-2016
Structure of China’s SCR Catalyst Enterprises (by Region), 2015
Capacity of Major SCR Catalyst Enterprises in China
Major Properties and Applications of Titanium Alloy
China’s Titanium Sponge and Titanium Material Output, 2006-2016
Global Titanium Alloy Consumption Structure, 2015
China’s Titanium Alloy Consumption Structure, 2015
Global Cosmetic Market Size, 2010-2020E
Global Cosmetic Market Size Structure (by Region), 2010-2015
Global Makeup Market Size, 2010-2020E
CAGR of Pharmaceutical Industry in Major Countries, 2011-2015
Output Value and YoY Growth of China's Pharmaceutical Industry, 2014-2020E
Revenue and Net Income of Henan Billions Chemicals, 2009-2016
Revenue Structure of Henan Billions Chemicals (by Product), 2012-2015
Revenue Structure of Henan Billions Chemicals (by Region), 2008-2015
Gross Margin of Henan Billions Chemicals, 2012-2015
R&D Costs and % of Operating Revenue of Henan Billions Chemicals, 2009-2015
Key Projects under Construction of Henan Billions Chemicals, 2015
Product Line of Henan Billions Chemicals
Product Capacity of Henan Billions Chemicals, 2016
TiO2 Introduction of Henan Billions Chemicals
Titanium Dioxide Output, Sales Volume and Inventory of Henan Billions Chemicals, 2010-2015
Business Distribution of Sichuan Lomon Group
Introduction of Subsidiaries of Sichuan Lomon Titanium Industry Co., Ltd
Output of TiO2 of Sichuan Lomon, 2007-2015
Revenue and Net Income of Henan Billions Chemicals, 2016-2020
Revenue and Net Income of CNNC Hua Yuan, 2009-2016
Revenue Breakdown of CNNC Hua Yuan (by Product), 2013-2016
Revenue Structure of CNNC Hua Yuan (by Region), 2012-2016
Gross Margin of CNNC Hua Yuan, 2012-2016
R&D Costs and % of Total Revenue of CNNC Hua Yuan, 2012-2016
Major Projects of CNNC Hua Yuan
Major Titanium Dioxide Products and Applications of CNNC Hua Yuan
Output of CNNC Hua Yuan, 2007-2016
Output, Sales Volume, and Inventory of TiO2 of CNNC Hua Yuan, 2012-2015
Companies Held and Controlled by Shandong Dongjia Group
Capacity, Output, and Sales Volume of Shandong Dongjia Group, 2007-2015
Revenue and Net Income of Jilin Gpro Titanium, 2011-2016
Revenue Breakdown of Jilin Gpro Titanium by Product, 2012-2015
Revenue Structure of Jilin Gpro Titanium by Region, 2012-2015
Gross Margin of Jilin Gpro Titanium, 2012-2015
R&D Costs and % of Total Revenue of Jilin Gpro Titanium, 2012-2015
Major Project of Jilin Gpro Titanium
Output, Sales Volume, and Inventory of TiO2 of Jilin Gpro Titanium, 2012-2015
Revenue and Net Income of Jilin Gpro Titanium, 2016-2020
Revenue and Net Income of Anhui Annada, 2009-2016
Revenue Structure of Anhui Anna da by Product, 2009-2015
Revenue Structure of Anhui Annada by Region, 2009-2015
Gross Margin of Anhui Annada, 2009-2015
R&D Costs and % of Total Revenue of Anhui Annada, 2009-2015
Output, Sales Volume, and Inventory of TiO2 of Anhui Annada, 2011-2015
Revenue and Net Income of Anhui Annada, 2016-2020
Revenue and Net Income of Pangang Group Vanadium Titanium & Resources, 2009-2016
Revenue Structure of Pangang Group Vanadium Titanium & Resources by Product, 2010-2016
Revenue Structure of Pangang Group Vanadium Titanium & Resources by Region, 2010-2016
Gross Margin of Pangang Group Vanadium Titanium & Resources, 2011-2016
R&D Costs and % of Total Revenue of Pangang Group Vanadium Titanium & Resources, 2012-2016
TiO2 Projects of Pangang Group Vanadium Titanium & Resources, 2016
Output, Sales Volume, and Inventory of TiO2 of Pangang Group Vanadium Titanium & Resources, 2011-2015
Revenue from TiO2 Business of Pangang Group Vanadium Titanium & Resources, 2011-2016
Revenue and Net Income of Pangang Group Vanadium Titanium & Resources, 2016-2020
Development Course of Yunnan Dahutong Industry & Trading
Sales Network of Yunnan Dahutong Industry & Trading in China
Sales Network of Yunnan Dahutong Industry & Trading Worldwide
Product Capacity of Guangxi Jinmao Titanium Co., Ltd.
Sales Network of Guangxi Jinmao Titanium Co., Ltd. in China
Sales Network of Guangxi Jinmao Titanium Co., Ltd. in Overseas Market
Sales Offices of Guangxi Jinmao Titanium Co., Ltd.
Marketing Network of Shandong DAWN Titanium Industry Co., Ltd.
Major Brands of Chemours
Worldwide Distribution of Chemours
Revenue and EBITDA of Chemours (by Business Units), 2012-2015
Assets of Chemours (by Business Units), 2012-2015
Revenue Structure of Chemours (by Regions), 2015
Status Quo of Chemours Titanium Dioxide Business
Global Presence of Huntsman
Revenue and Net Income of Huntsman, 2010-2016
Breakdown of Revenue and EBITDA of Huntsman, 2015-2016
Revenue Structure of Huntsman (by End Markets), 2014
Revenue Structure of TiO2 Business of Huntsman, 2015
Revenue of TiO2 Business Huntsman, 2009-2016
Development Plan of TiO2 Business of Huntsman
TiO2 Business Layout of Huntsman in China
Market Shares of Kronos in Europe and North America, 2009-2015
Revenue and Net Income of Kronos, 2007-2016
Revenue Breakdown of Kronos, 2013-2015
Production Bases of Kronos Worldwide
Titanium Dioxide Plants and Capacity of Kronos Worldwide, 2015
Output and Sales Volume of TiO2 of Kronos, 2007-2016
Sales Structure of TiO2 Business of Kronos (by Sales Volume), 2015
TiO2 Capacity Structure of Kronos, 2016E
Business Distribution of Tronox Worldwide
Revenue and Net Income of Tronox, 2009-2016
Breakdown of Revenue and Net Income of Tronox (bu BU), 2013-2015
Breakdown of Revenue and Net Income of Tronox (bu BU), Q1-Q2, 2016
Revenue Breakdown of Tronox (by Regions), 2013-2015
TiO2 Products of Tronox (by End Markets)
Titanium Dioxide Plants and Capacity of Tronox Worldwide
Sales Volume Structure of TiO2 of Tronox, 2015
Production of Tronox, 2015
Ownership of Cristal
Business Distribution of Cristal Worldwide
Global and China’s Titanium Dioxide Preparation Methods, 2015
Global and China’s Titanium Dioxide Capacity Growth Rate, 2006-2016
China’s Titanium Dioxide Capacity Utilization Rate, 2010-2020E
China’s Titanium Dioxide Output Structure (by Product), 2015/2020E
Application Contrast of Titanium Dioxide in China
Revenue Growth Rate of Global Major Titanium Dioxide Manufacturers
Competitive Landscape of Major Manufacturers in Global Titanium Dioxide Market, 2017
Percentage of Chlorination ProcessAdopted by Global Major Titanium Dioxide Manufacturers
Global and China Synthetic Rubber Industry Report, 2021-2027
Synthetic rubber is a polymer product made of coal, petroleum and natural gas as main raw materials and polymerized with dienes and olefins as monomers, which is typically divided into general synthet...
Global and China Carbon Fiber Industry Report, 2021-2026
Carbon fiber is a kind of inorganic high performance fiber (with carbon content higher than 90%) converted from organic fiber through heat treatment. As a new material with good mechanical properties,...
Global and China Dissolving Pulp Industry Report, 2019-2025
In 2018, global dissolving pulp capacity outstripped 10 million tons and its output surged by 14.0% from a year ago to 7.07 million tons, roughly 70% of the capacity. China, as a key supplier of disso...
Global and China 1, 4-butanediol (BDO) Industry Report, 2019-2025
1,4-butanediol (BDO), an essential organic and fine chemical material, finds wide application in pharmaceuticals, chemicals, textile and household chemicals.
As of the end of 2018, the global BDO cap...
Global and China Carbon Fiber and CFRP Industry Report, 2019-2025
Among the world’s three major high performance fibers, carbon fiber features the highest strength and the highest specific modulus. It is widely used in such fields as aerospace, sports and leisure.
...
Global and China Natural Rubber Industry Report, 2019-2025
In 2018, global natural rubber industry continued remained at low ebb, as a result of economic fundamentals. Global natural rubber price presented a choppy downtrend and repeatedly hit a record low in...
Global and China Ultra High Molecular Weight Polyethylene (UHMWPE) Industry Report, 2019-2025
Ultra high molecular weight polyethylene (UHMWPE), a kind of linear polyethylene with relative molecular weight of above 1.5 million used as an engineering thermoplastic with excellent comprehensive p...
China Polyether Monomer Industry Report, 2019-2025
China has seen real estate boom and issued a raft of policies for continuous efforts in improving weak links in infrastructure sector over the years. Financial funds of RMB1,663.2 billion should be al...
Global and China Viscose Fiber Industry Report, 2019-2025
Over the recent years, the developed countries like the United States, Japan and EU members have withdrawn from the viscose fiber industry due to environmental factor and so forth, while the viscose f...
Global and China Synthetic Rubber (BR, SBR, EPR, IIR, NBR, Butadiene, Styrene, Rubber Additive) Industry Report, 2018-2023
In 2018, China boasted a total synthetic rubber capacity of roughly 6,667kt/a, including 130kt/a new effective capacity. Considering capacity adjustment, China’s capacity of seven synthetic rubbers (B...
Global and China Dissolving Pulp Industry Report, 2018-2022
With the commissioning of new dissolving pulp projects, the global dissolving pulp capacity had been up to about 8,000 kt by the end of 2017. It is worth noticing that the top six producers including ...
Global and China Carbon Fiber and CFRP Industry Report, 2018-2022
As a new generation of reinforced fiber boasting intrinsic properties of carbon material and excellent processability of textile fiber, carbon fiber is the one with the highest specific strength and s...
Global and China Ultra High Molecular Weight Polyethylene (UHMWPE) Industry Report, 2017-2021
Ultra High Molecular Weight Polyethylene (UHMWPE), a kind of linear polyethylene with relative molecular weight of above 1.5 million and an engineering thermoplastic with excellent comprehensive prope...
Global and China Aramid Fiber Industry Report, 2017-2021
Global aramid fiber output totaled 115kt with capacity utilization of 76.0% in 2016. As industries like environmental protection and military develop, the output is expected to rise to 138kt and capac...
Global and China Natural Rubber Industry Report, 2017-2021
In 2016, the global natural rubber output edged up 1.1% year on year to 12.4 million tons, and the consumption rose by 3.8% year on year to 12.6 million tons, indicating the gap of 200,000 tons betwee...
China Synthetic Rubber Industry Report, 2017-2021
Synthetic rubber is one of important strategic materials, mainly used in tyres and other industries. In 2016, the global output and consumption of synthetic rubber reached 14.822 million tons and 14.9...
Global and China 1,4-butanediol (BDO) Industry Report, 2017-2021
1,4-butanediol (BDO) is a key raw material for organic and fine chemicals, capable of generating various derivatives like THF, PTMEG and GBL. BDO and its derivatives find wide application in PBT plast...
Global and China Ethylene Oxide (EO) Industry Report, 2017-2021
Ethylene oxide (EO) is one of the major derivatives of the ethylene industry. Featured with special reactivity, it can generate a series of fine chemical products for a wide range of applications.
In...